R Productivity Environment User’s Guide
Important
This content is being retired and may not be updated in the future. The support for Machine Learning Server will end on July 1, 2022. For more information, see What's happening to Machine Learning Server?
Important
The R Productivity Environment (RPE) is available only for version 8.0.0 of Revolution R Enterprise 2016. It does not apply to Microsoft R Server 8.0.5 or Microsoft R Client.
A Tutorial Introduction
Revolution R Enterprise for Windows combines the popular R data analysis environment with the power of Microsoft’s Visual Studio Shell to create a full-featured R Productivity Environment™ for data analysis and graphics. This chapter introduces you to the Revolution R Enterprise productivity environment by means of a brief tutorial that walks you through the following basic operations:
- Starting and stopping the R Productivity Environment
- Working with the R Console window
- Creating an R project
- Working in the Script window
- Running a script
- Adding Code Snippets to your script
- Completing code with IntelliSense
- Examining R objects with the Object Browser
- Getting help
Starting and Stopping Revolution R Enterprise
On Windows 7 and earlier, you start Revolution R Enterprise as follows:
- Click Start, point to All Programs, point to Revolution R, point to Enterprise 8.x, and then click Revolution R Enterprise 8.x (64).
On Windows 8 and Windows Server 2012, you start Revolution R Enterprise as follows:
- Move your mouse to the lower left corner of the Desktop until Start pops up.
- Click Start to view the Start screen.
- Locate the tile for Revolution R Enterprise 8.x (64).
On Windows 10, you start Revolution R Enterprise as follows:
- Click Start, point to All apps, point to Revolution R, and then click Revolution R Enterprise 8.x (64).
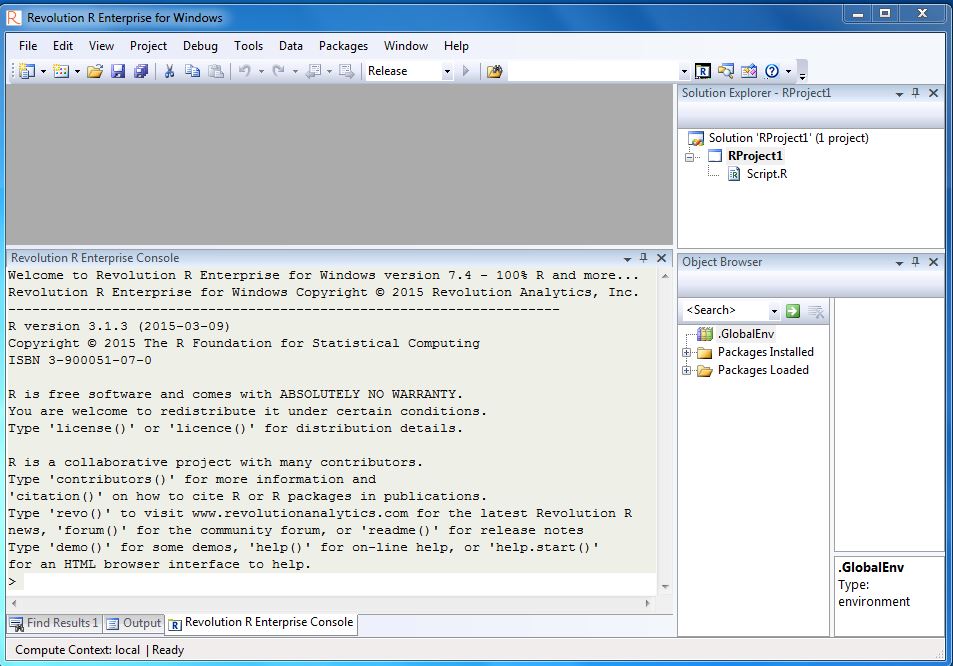
The Revolution R Enterprise user interface appears as follows:
To stop the Revolution R Enterprise productivity environment, do either of the following:
- Click the Close button in the main window’s title bar.
-- or --
- From the File menu, click Exit.
You may use the q() function from the R Console prompt to exit the RPE, but any arguments you pass will be ignored; the function simply calls the standard RPE exit command, as if you’d clicked the Close button or selected Exit from the File menu.
A Quick Tour of the Revolution R Enterprise User Interface
When you first open Revolution R Enterprise, you see a window with menus and toolbars and four open tool windows: the Solution Explorer, the R Console, the Output window, and the Object Browser, as shown on the previous page. The standard toolbar appears as follows:

From left to right, the buttons are as follows:
- New Project: create a new R project.
- Add Item: add projects to solutions, or scripts to a project.
- Open File
- Save
- Save All
- Cut
- Copy
- Paste
- Undo
- Redo
- Navigate Backward: move between bookmarks. Bookmarks are described later in this chapter.
- Navigate Forward: move between bookmarks.
- Solution Configurations: switch between Release and Debug configurations. Release is the standard configuration. Debug configuration allows you to use the visual debugger to debug your R scripts.
- Run Script/Continue: run the active script, or continue debugging.
- Run Line or Selection: run currently selected text or line containing the cursor if no text is selected.
- Find in Files: find specified text in one or more project files.
- Find: find specified text in the current script.
- R Console: display the R Console.
- Solution Explorer: display the Solution Explorer.
- Object Browser: display the Object Browser.
- R Help: explore R help.
The remaining options work as in most Windows applications.
The Text Edit toolbar appears as shown below whenever you have a script window open:

Left to right, its buttons are as follows:
- Display Word Completion
- Decrease Indent
- Increase Indent
- Comment out selected lines
- Uncomment the selected lines
- Toggle a bookmark on the current line
- Move the caret to the previous bookmark
- Move the caret to the next bookmark
- Move the caret to the previous bookmark in the current Folder
- Move the caret to the next bookmark in the current Folder
- Move caret to the previous bookmark in the current document
- Move caret to the next bookmark in the current document
- Clear all bookmarks in all files
The Debug toolbar appears as shown below when the visual debugger is running:
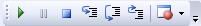
Left to right, its buttons are as follows:
- Start/Continue: continue after stopping for a pause or breakpoint.
- Break All: pause evaluation.
- Stop: stop evaluation.
- Step Into: step into functions while debugging.
- Step Over: step over a line of code while debugging.
- Step Out: step out of a function while debugging.
- Breakpoints: display the Breakpoints window.
Working with the R Console Window
R is at heart an interactive, interpreted programming language, so the simplest way to work with it is by typing commands at an R Console prompt. The R Console window facilitates this interaction—it works much like the R console window in the Windows Rgui program, or like R in a UNIX terminal window.
When you first open the Revolution R Enterprise R Productivity Environment, the R Console window opens at in the bottom left portion of the main window. It shows a lengthy startup message, followed by the R prompt “> “.
To get started, type the following command at the “> “ prompt and press ENTER:
x <- 1:20
The combination “<” followed by “-“ is the main R assignment operator; the colon is the sequence operator. The command is read “x gets 1 to 20,” and its effect is to assign the variable “x” the value “1:20”, which is a vector (a one-dimensional array) consisting of the integers 1 through 20. When you assign a variable, as in the above command, R completes the assignment and returns its standard prompt. To see the contents of an assigned variable, type its name at the prompt and press ENTER (in what follows, we will show input preceded by the R prompt >; if you are following along at the keyboard, do not type the >):
> x
R then returns the value of the variable:
[1] 1 2 3 4 5 6 7 8 9 10 11 12 13 14 15 16 17 18 19 20
Define another variable, y, using the following command:
> y <- 2 + .2 * x + rnorm(20)
To see the contents of y, type its name:
> y
[1] 2.3358666 0.8279776 2.6617999 2.1925148 2.4903571 1.3205465 3.7753439
[8] 3.1476628 3.0461752 4.7368984 4.0402702 4.7821859 4.5344639 5.1235209
[15] 4.9958019 5.7902878 4.2940041 7.3600556 5.6599444 7.5457394
(Because y is created using the random number generating function rnorm, your value will differ.)
To create a plot of y versus x, use the plot command:
> plot(x, y)
A scatter plot is created in separate graphics window.
For further examples of using the R Console, try working through the tutorial in the RPE Getting Started Guide, or by working through the sample session in the R manual An Introduction to R (R-intro.pdf).
Creating an R Project
Like other versions of Visual Studio, the Revolution R Enterprise R Productivity Environment is project-based. When you start Revolution R Enterprise, a default project is created for you. The standard project type in Revolution R Enterprise is the R project. Projects are contained within solutions, and a default solution is created at startup also. Solutions can contain multiple projects, and projects can contain one or more R scripts, as well as other related files.
To create an R project:
- On the File menu, point to New, and then click Project. The New Project dialog box appears, with R Project as the default project type.
- Near the bottom of the form, in the Name text box, enter MyRProject. The Solution Name is automatically changed to match the project name.
- Click OK.
You are prompted to clear your R workspace and history; click OK. In general, your R workspace is cleared whenever you create or open a different solution. You can choose to save your workspace, which saves all the objects you have created.
The MyRProject solution, which contains the MyRProject project, appears in the Solution Explorer. By default, the project contains one R script. However, you can add projects to the solution, and add scripts to each project.
Working in the Script Editor
Right-click on Script.R in the Solution Explorer, and rename it MyRProject.R. Then double-click the script name to open the script in a Script window. If you are familiar with Visual Studio or with the Rgui script editor, you will find working with the Script window very similar.
At the top of your script, add the following lines by selecting all the text in the R Console window from the first definition of x and then selecting Copy Commands Only from the Edit menu, then right-clicking in the Script window and clicking Paste:
x <- 1:20
x
y <- 2 + .2*x + rnorm(20)
y
plot(x, y)
When a line in a script is edited, a yellow highlight appears in the left margin of the Script window. When the change is saved (for example, by running the script) the highlight changes to green.
Running a Script
Now, run your script by clicking the Run button  on the Revolution R Enterprise standard toolbar. The commands and the output are printed in the R Console window, as shown:
>  x <- 1:20
>  x
[1]  1  2  3  4  5  6  7  8  9 10 11 12 13 14 15 16 17 18 19 20
>  y <- 2 + .2*x + rnorm(20)
>  y
[1] 2.636585 3.525021 3.485727 4.058024 1.778333 1.218661 5.201960 3.567151
[9] 3.327252 4.878279 6.317447 3.170078 4.804122 4.199217 5.831666 3.769799
[17] 4.957004 4.293823 4.878549 7.547997
(Notice that your y variable differs from the one you created earlier, as well as from the one shown here. This again is because of the call to rnorm. Also notice that the Script window now shows a green highlight in the left margin; this is because the script is saved to disk before it is run.)
It is sometimes convenient to run only a portion of a script. To do this, select the portion of the script you want to run, for example, the lines that define and display the y variable, and then choose Run Line or Selection from the Edit menu (or, alternatively, click the Run Line or Selection button  in the Revolution R Enterprise standard toolbar). Again, the output is sent to the R Console window:
>  y <- 2 + .2*x + rnorm(20)
>  y
[1] 0.9645519 3.3559849 3.2095384 1.8345245 3.4162445 1.9668614 4.0564819
[8] 2.4992445 3.1564125 3.6010072 4.3156243 5.2222722 5.3168272 5.5181892
[15] 4.7657572 3.2346259 4.8671942 5.5564427 4.7841998 6.7392932
Adding Code Snippets to Your Script
Code Snippets help you quickly expand your R repertoire by including syntactically complete R expressions for which you need only “fill in the blanks.” Revolution R Enterprise comes with dozens of built-in Code Snippets, and you can easily add others for you and your colleagues.
To get started with Code Snippets, right-click on any line of your script, and then click Insert Snippet…. A menu of available snippets appears, organized into folders. Double-click a folder to view the snippets within.
As an example, let’s use snippets to create an R data frame and then fit a linear model to the columns of the data.
To create the data frame:
Right-click on an empty line of the script, click Insert Snippet…, and then double-click data objects.
Double-click data frame. A data frame snippet is inserted, with placeholders for a data frame name (myDataFrame) and a variable to put in the data frame (myVar1 = 1:10).
Move to the variable placeholder by pressing TAB. The placeholder is highlighted in blue.
Replace the placeholder text by typing the following:
x = runif(20), y = rnorm(20)The snippet should now read as follows:
myDataFrame <- data.frame(x = runif(20), y = rnorm(20))Press ENTER to accept your changes and exit the Code Snippet. (You may see an IntelliSense window appear with information about the arguments to the data.frame function. Close this window by pressing ESC before pressing ENTER.)
To fit the linear model:
On the next line of your script, right-click, click Insert Snippet…, and then double-click analysis.
Double-click linear model. An lm snippet is inserted. This has placeholders for a number of parameters that can be specified in defining the linear model, most of which default to NULL.
Press TAB twice, so that the placeholder NULL for the data parameter is highlighted.
Type myDataFrame.
Press ENTER to exit the Code Snippet.
Click the Run button
to run the script.
Completing Code with IntelliSense
IntelliSense is Microsoft’s implementation of auto-completion, common to all Visual Studio-based programs. If you can’t remember the exact name of an R object such as a function or data set, or you have created long object names in order to make your code more readable, IntelliSense can speed up your programming.
For example, having created your linear model lmObj, you may want to view the model residuals. Not quite sure what the R command for this is, you do the following:
Type resi into your Script window, and click the Display Word Completion toolbar button. You see objects named resid and residuals, and clicking on each of them in turn, you see that both are functions that take an object as an argument.
Not sure which you might want (in fact, they are synonyms), you double-click residuals and the full name appears in your script.
Type an opening parenthesis and begin typing lmO, then click Display Word Completion again.
Double-click lmObj and then type a closing parenthesis.
Select the line containing residuals(lmObj) and click Run Line or Selection
to see the residuals of your fitted model.
Examining R Objects with the Object Browser
All R objects that you create by assignment during an R session (whether by running a script or typing commands at the console prompt) are stored during the session in R’s global environment. Other R objects are stored in R package databases. To see information about objects in the global environment and your installed packages, use the Object Browser.
The Object Browser consists of three panes. The left pane shows an icon representing the global environment and two expandable lists, one showing installed packages, and one showing loaded packages.. When you select an entry from the search path, the top right pane shows the objects or variables found in that entry.
Click on an object in the top right pane to view information about the object in the lower right pane. For most built-in data objects and functions, the lower right pane shows help information. For user-defined objects, the class and a brief description of the data are shown.
Getting Help
Revolution R Enterprise includes comprehensive help on both the Revolution R Enterprise graphical user interface and the underlying R language.
To obtain help on the Revolution R Enterprise graphical user interface, do one of the following:
- Click in any Revolution R Enterprise window or dialog, and press F1.
--or--
From the Help menu, click Revolution R User Interface Help.
In the Look for text box of the Document Explorer, enter a term for which you want help.
To obtain R language help, use the R ? operator in the R Console window, or do the following:
From the Help menu, click Search R Help…. The Search R Help dialog appears as shown:
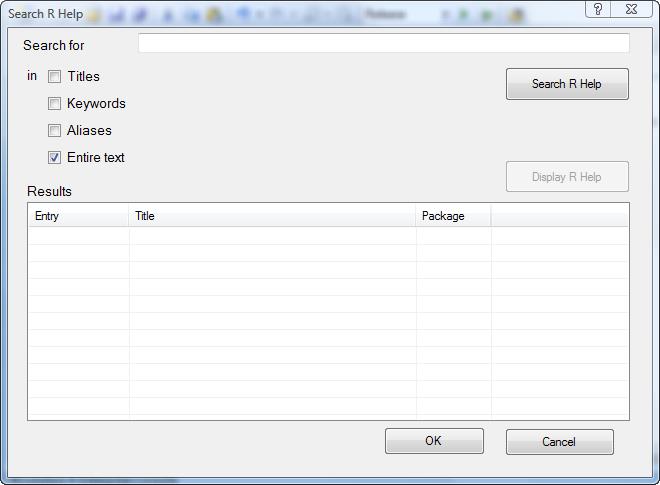
In the Search for text box, enter a search term.
Click Search R Help. R help topics matching your search term are shown in the Results list. If an exact match is found, the exact match topic is listed above the Results table:

To show the help topic without closing the search dialog, click the exact match topic, or select an entry from the list and click Display R Help. To show the help topic and close the dialog, select an entry from the list and click OK.
By default, help topics are displayed in a help window called the Document Explorer, and one help topic is displayed at a time—if you ask for help on a new topic, the new topic replaces the old one. You can choose to display help topics in tabbed windows within the Document Explorer.
To display help in tabbed windows:
From the Tools menu, click Options…. The Options dialog appears.
In the left pane, click Environment, and then expand Help.
Under Help, click General.
In the right pane, clear the check box labeled Reuse topic window.
Managing Data
The Revolution R Enterprise R Productivity Environment contains two main tools for managing R data objects, the Object Browser and the Data menu. The Object Browser is a powerful tool for exploring your R functions and data objects. From the Object Browser, you can obtain descriptive information about your R objects, such as data summaries or function help. You can also edit your R objects, plot them, and perform some basic data management tasks. The Data menu can be a convenient shortcut to data management tasks if you already know the name of the object you want to act upon. This chapter gives a complete description of using the Object Browser and the Data menu.
Opening the Object Browser
By default, the Object Browser is open whenever you start Revolution R Enterprise for Windows. If you close it, however, it is easy to open it again.
To open the Object Browser, do either of the following:
- Click the Object Browser button
 in the Standard toolbar
--or--
- From the View menu, click Object Browser
--or--
- Press CTRL+ALT+J
The Object Browser appears as follows:
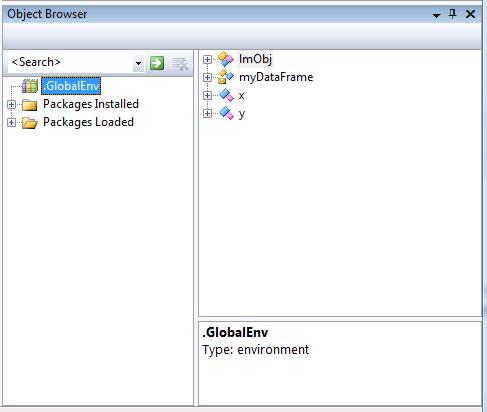
The Object Browser consists of three panes. The left pane is a tree showing your global environment, all loaded packages (that is, packages in your current R search path), and all installed packages. When you click on an environment or package in the left pane, the top right pane shows all the objects in that environment or package. For example, if you click .GlobalEnv, you see all the objects in your current R workspace. When you are in debug mode, you can see the variables in the local environment by examining _Browser_Call.
Click on an object to view information about the object displayed in the lower right pane. Information shown varies by object type, but typically includes the type or class of the object, and a summary or recap of the data contained within the object. If the object is a function, the function's help is shown.
You can obtain detailed information about objects in packages by drilling down. For example, to learn more about the built-in dataset cars:
Expand Packages Loaded and click on the package name datasets in the left pane of the Object Browser. A list of the datasets in the package appears in the top right pane.
In the upper right pane, hover over the symbol just preceding cars. A tooltip will show you that the cars object is a data frame.
Still in the upper right pane, click on cars. Help information on the cars dataset will appear in the lower right pane.
Again in the upper right pane, click on the + sign before cars. All of the components of the cars data frame are listed below, including its attributes and columns.
Click on the column name speed. In the lower right pane you will see that it is numeric data with 50 rows. The first few values from that column are then listed.
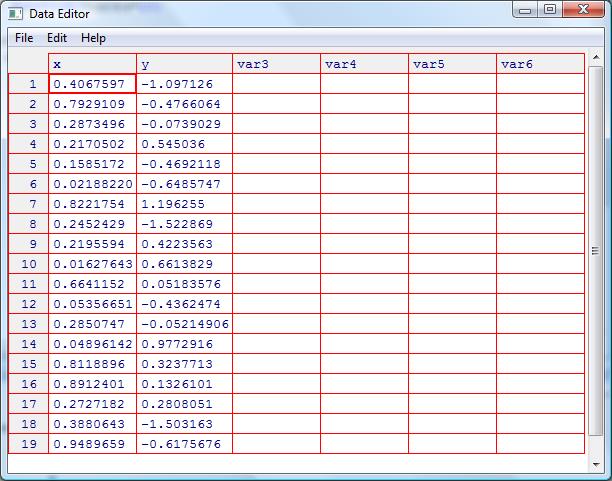
Editing Objects in the Object Browser
Using the Object Browser’s context menu, it is easy to edit both functions and data objects. Most data objects can be edited using R’s spreadsheet-like data editor, which allows you to change values and variable names, add variables, and perform other data edits. R functions can be edited using Notepad (or another editor, if specified).
To edit a data object:
Right-click an object (for example, myDataFrame) in the right pane of the Object Browser.
In the context menu that appears, click Edit Object. The R data editor appears, for the myDataFrame example, as shown at the top of the next page.
Edit values as appropriate, then close the data editor by clicking the Close button
 . The edited object is assigned to your global environment.
To edit a function:
Right-click the function in the right pane of the Object Browser
In the context menu that appears, click Edit Object. Notepad (or another editor specified using the options function) opens with the definition of the function to edit.
Edit the function as desired, then save and close the file. The edited function is assigned to your global environment.
Plotting Objects in the Object Browser
Using the Object Browser, you can visualize most R data objects via simple graphics. One- and two-dimensional data are displayed as scatter plots, except for time series, which are displayed as connected line graphs, while higher dimensional data are displayed as scatterplot matrices showing pairwise scatter plots of all the variables.
To plot a data object in the Object Browser:
Right-click the object in the right pane of the Object Browser.
In the context menu that appears, click Plot Object.
Viewing Data Summaries
Using the Object Browser, you can view summaries of most data objects as generated by the R function summary. The data shown in the summary depends upon the class of the data object.
To view a data summary from the Object Browser:
Right-click the object in the right pane of the Object Browser.
In the context menu that appears, click Summary.
Getting Help
Using the Object Browser, you can get help for most objects as follows:
Right-click the object in the right pane of the Object Browser.
In the context menu that appears, click Help.
Using the Data Menu
The Data menu provides quick access to a number of commands for managing data, as follows:
- List Objects: equivalent to the R ls function, this option lists all the objects in your global environment.
- Remove All Objects: equivalent to the R function call rm(ls(all=TRUE)), this removes all objects from your global environment.
- Remove Object: equivalent to the R rm function, this allows you to remove a specified object.
- Clone Object: copies a specified object and allows you to specify the name of the clone.
- Rename Object: copies a specified object to an object with a new name, and then deletes the original object.
- View Object Summary: equivalent to the R summary function, this prints a summary of the specified data object.
- Edit Object: launches the R data editor on the specified data object.
- List Search Path: equivalent to the R search function, this lists all the environments and databases in your current search path.
Writing and Running R Scripts
For many purposes, it can be convenient to use R purely interactively, either by typing commands in the R Console window or using commands available from the Object Browser and main menu. However, if you want to organize your work in projects, you want your work to be fully reproducible, or if you want to be able to comment your commands so that you’ll have some idea what you were thinking when you typed that strange looking command, you will want to start working with R scripts.
An R script is simply a text file containing R expressions. To create an R script in Revolution R Enterprise, you create an R project, which will by default contain an empty R script. As a simple example, here is how to create a script that prints “Hello, world”:
On the File menu, point to New, and then click Project….
In the Name text box of the New Project dialog box, type HelloWorld.
Click OK.
In the Solution Explorer, right-click Script.R, and then click Rename.
Rename the script Hello.WorldR.
Double-click HelloWorld.R to open it.
In your blank script, type the following:
print("Hello, World")
To run your script, click the Run button . The command in your script is echoed to the R Console window, and the R output is shown:
> print("Hello, World")
[1] "Hello, World"
(In fact, the HelloWorld example can be made even simpler; if you remove the print( and the closing parenthesis, the R output remains the same. Try it.)
HelloWorld is a standard script and code example, but it has little to do with how R is actually used. For that, you need to get into data analysis. To clear the decks for this, close your HelloWorld solution.
To close a solution:
- From the File menu, click Close Solution.
A Simple Analysis
Data analysis begins with a data set, and in this case we’ll start by examining some data concerning SAT scores. We’ll explore the controversial topic of how education spending affects SAT scores.
Most data sets live outside of R. In the course of your work, you may need to read data from database tables, from other statistics packages, or from an accountant’s spreadsheet. On the Windows desktop, one of the more common formats for data storage is the Excel spreadsheet. While R does have several packages to help read native Excel format files, it is often just as convenient to save the data in a more portable format such as CSV (comma-separated values), so for our first example, we’ll start by importing a CSV file.
First, however, we’ll create a new solution:
On the File menu, point to New, and then click Project….
In the Name text box of the New Project dialog box, type SATscores.
Click OK.
In the Solution Explorer, right-click Script.R, and then click Rename.
Rename the script SATscores.R.
Double-click SATscores.R to open it.
Next, we’ll add the SAT data to our project.
Open a Windows Explorer window, and navigate to the IDE\doc\examples\SATanalysis folder of your Revolution R Enterprise installation directory (typically C:\Revolution\R-Enterprise-X.Y, where X.Y is the current Revolution version number).
Copy the file SAT.csv.
Navigate to your SATscores solution folder (you can find the full path to this folder by typing getwd() in the R Console window).
Paste the file in the SATscores solution folder.
Now we’ll make use of the data in our script:
Right-click in the SATscores.R script, and then click Insert Snippet….
Double-click data sets
Double-click import data. A code snippet appears in your script as follows:

Type SAT to replace myDataFrame, and then press TAB.
Type sat.csv to replace myFile, and then press TAB.
Type TRUE to replace FALSE; this tells R to use the first line of the csv file as column names for the new R data frame. Press TAB twice to highlight the placeholder field for row.names.
Type State to specify the State column of the csv file as the row names for the new R data frame.
Press Enter to exit the code snippet.
Press the Run button
to run your script. The data is imported, and a new data object SAT appears in the Object Browser.
It is generally a good idea to have a graphical look at the data before proceeding to analysis, and the Object Browser lets us do that easily.
Right-click SAT in the Object Browser.
Click Plot Object.
The SAT data is displayed as a scatterplot matrix, as shown.
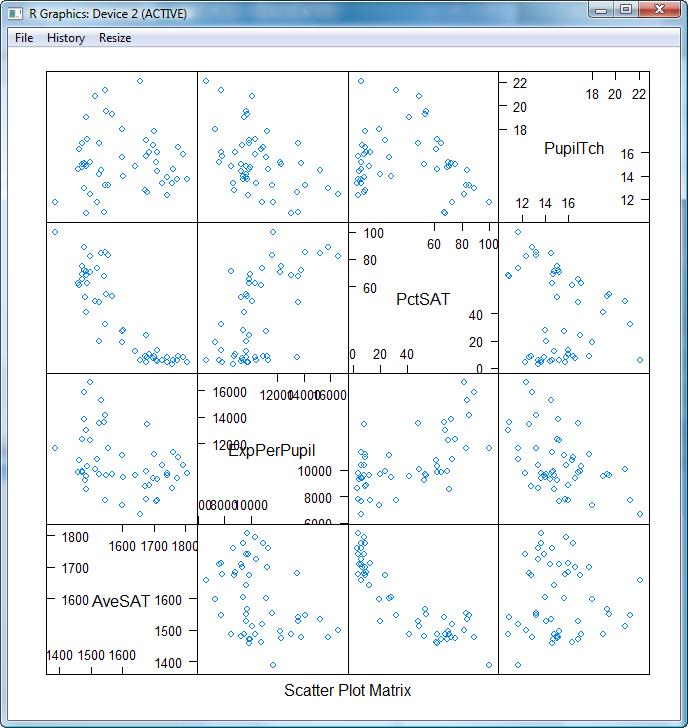
The plot of ExpPerPupil versus AveSAT seems counter-intuitive; it appears to show that average SAT scores fall as expenditure per pupil increases. But notice also that there appears to be a strong negative correlation between the average SAT scores and the percentage of eligible students in a state taking the SAT. Perhaps taking this into account will help explain the seeming anomaly.
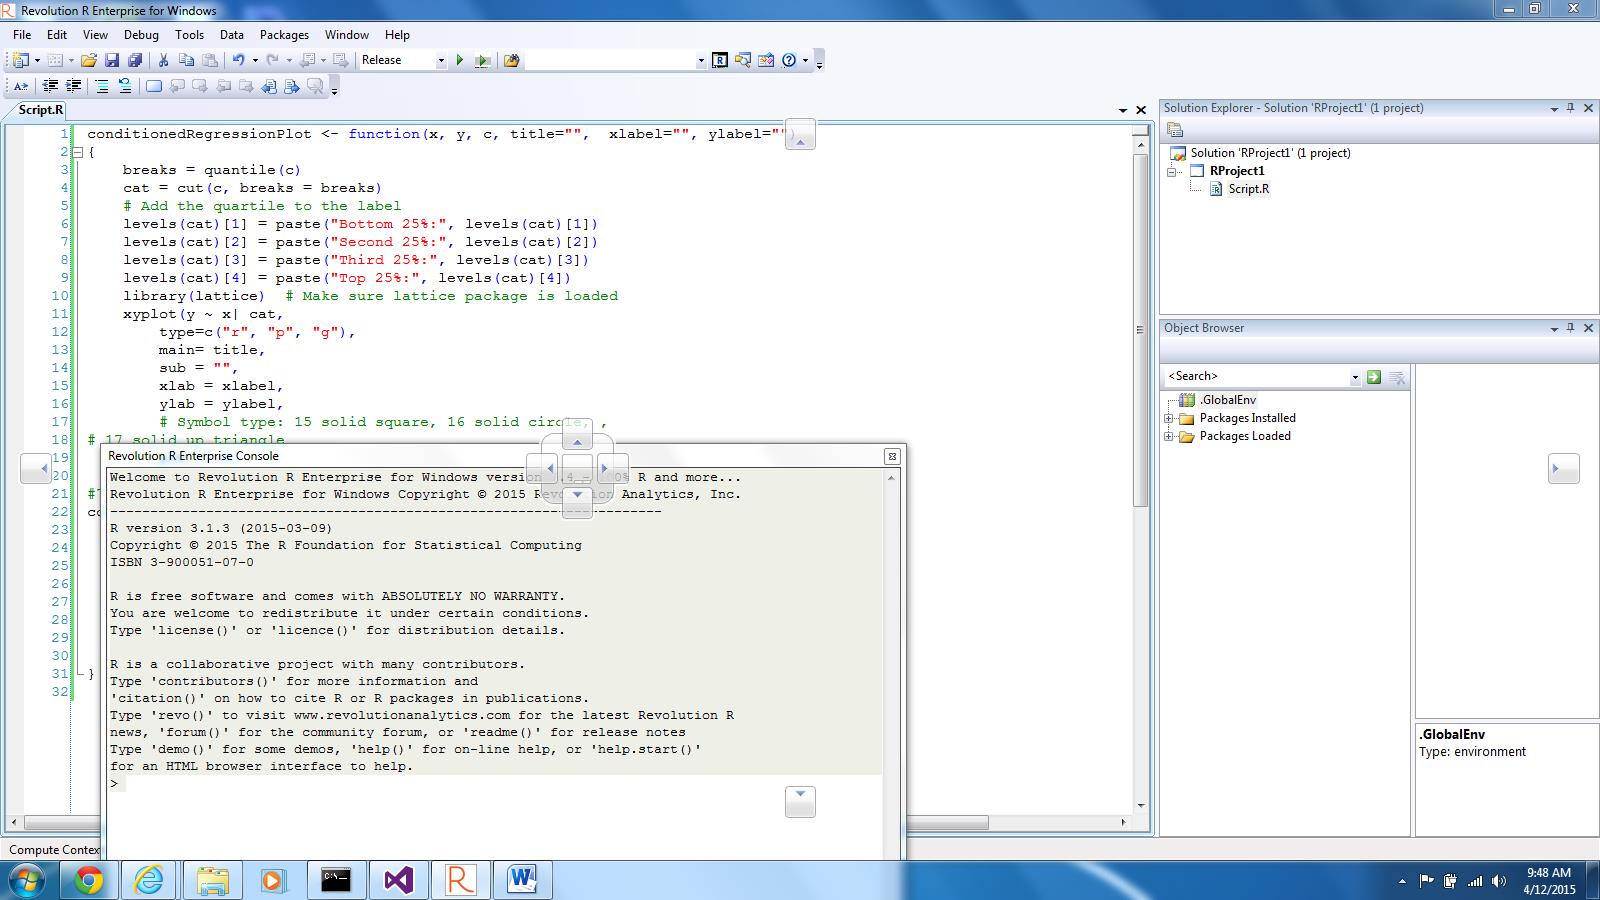
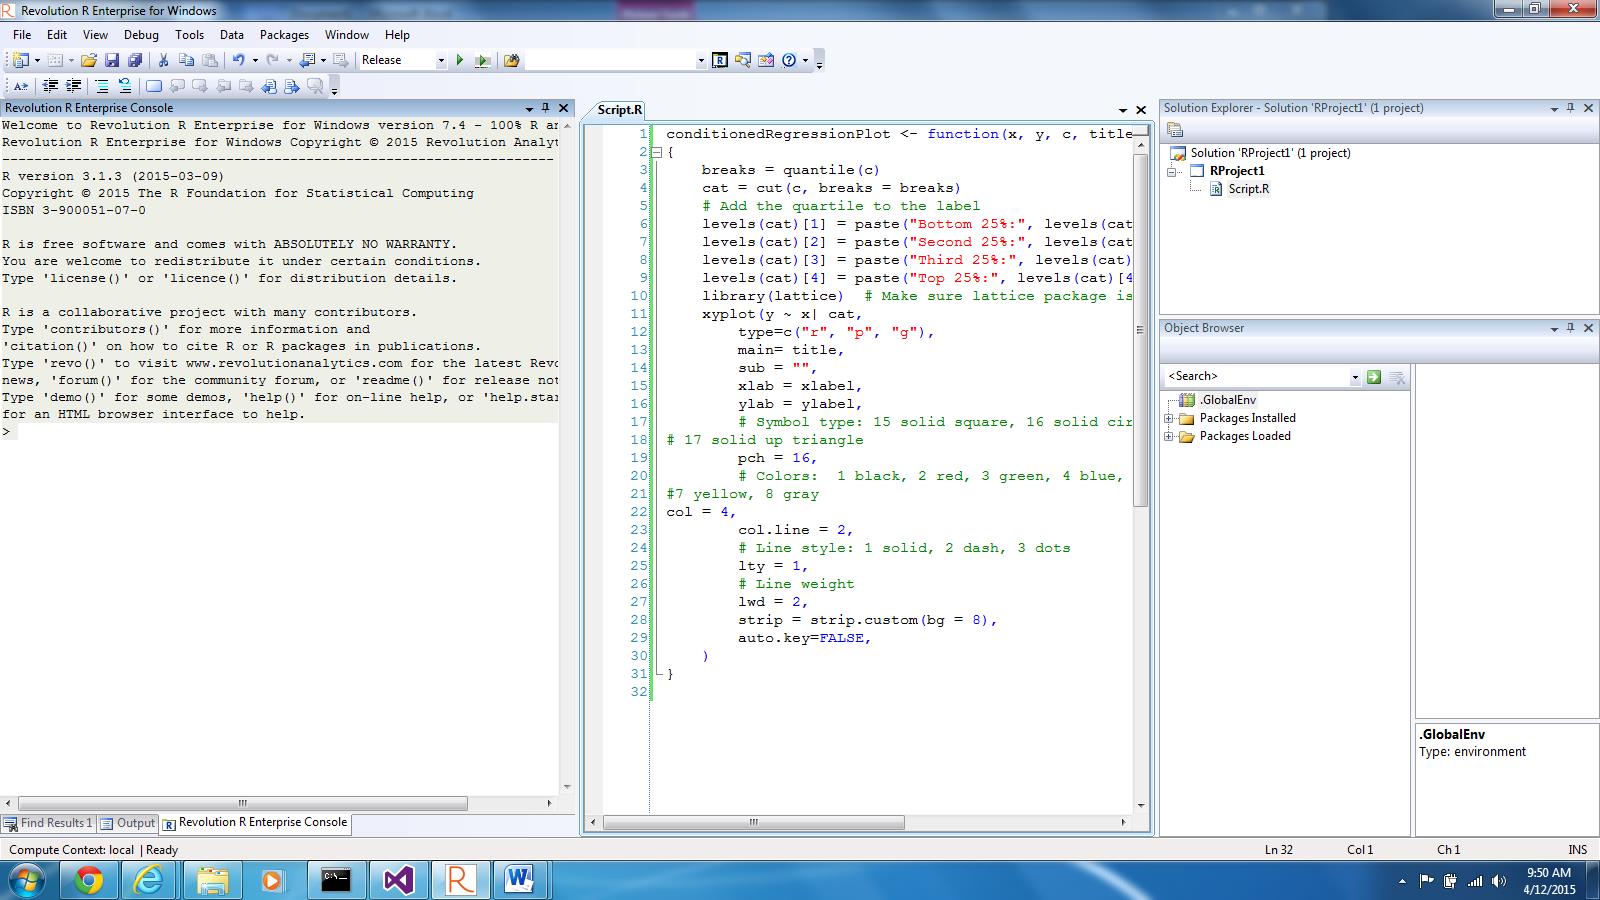
We will try to explore this using a conditioning plot, a feature of R available through the lattice package. In your script, define the following function:
conditionedRegressionPlot <- function(x, y, c, title="",  xlabel="", ylabel="")
{
	breaks = quantile(c)
	cat = cut(c, breaks = breaks)
	# Add the quartile to the label
	levels(cat)[1] = paste("Bottom 25%:", levels(cat)[1])
	levels(cat)[2] = paste("Second 25%:", levels(cat)[2])
	levels(cat)[3] = paste("Third 25%:", levels(cat)[3])
	levels(cat)[4] = paste("Top 25%:", levels(cat)[4])
	library(lattice)  # Make sure lattice package is loaded
	xyplot(y ~ x| cat,
		type=c("r", "p", "g"),
		main= title,
		sub = "",
		xlab = xlabel,
		ylab = ylabel,
		# Symbol type: 15 solid square, 16 solid circle, ,
		# 17 solid up triangle
		pch = 16,
		# Colors:  1 black, 2 red, 3 green, 4 blue, 5 cyan, 6 magenta,
		#7 yellow, 8 gray
		col = 4,
		col.line = 2,
		# Line style: 1 solid, 2 dash, 3 dots
		lty = 1,
		# Line weight
		lwd = 2,
		strip = strip.custom(bg = 8),
		auto.key=FALSE,
	)
}
Notice that the Script window checks the syntax of your R expressions; comments appear green, character strings appear red, numbers and keywords appear blue. If you have syntactical errors in your code, these are underlined in red.
Run your script by clicking Run .
You can then call your function by adding the following lines to your script:
x <- SAT$ExpPerPupil
y <- SAT$AveSAT
c <- SAT$PctSAT
conditionedRegressionPlot(x, y, c,
		title="Conditioning on % Students Taking SATs",
		xlabel = "Educational Expenditures Per Pupil",
		ylabel= "Average SAT Scores By State")
Select those seven lines, right-click, and then click Run Line or Selection. The conditioning plot is produced as follows:
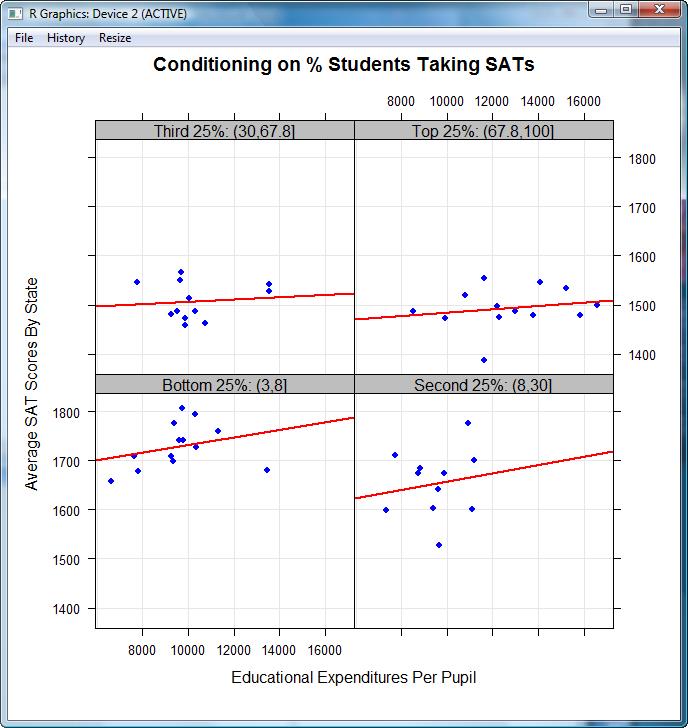
From this we see that when the percentage of students taking the SAT is taken into account, the expected relationship between expenditure per pupil and average SAT score seems to hold.
Running R Scripts
We have seen several ways of running R scripts, using a combination of toolbar buttons and context menus. In this section, we describe all the techniques available for running R code from a script, and how they differ.
There are five locations in the user interface with options for running script code:
- The standard toolbar
- The Edit menu
- The Debug menu
- The Script window’s context menu
- The Solution Explorer’s context menu
The options available in each location differ somewhat, and sometimes have different behavior, as follows:
Running Scripts from the Standard Toolbar
There are two buttons for running scripts on the standard toolbar. The first, , (Run), runs the current or active script. The second, , runs the currently selected text or, if no text is selected, the line containing the cursor.
Running Scripts from the Edit Menu
The Edit menu includes three options for running scripts:
- Run Line or Selection runs the currently selected text. This is equivalent to the toolbar button.
- Run to Cursor runs the current script from the top of the script to the cursor location.
- Run Current Script runs the currently open script. This is equivalent to the toolbar button.
Running Scripts from the Debug Menu
- Debug Line or Selection runs the currently selected text or, if no text is selected, the line containing the cursor. This is equivalent to the toolbar button.
- Start Debugging runs the currently open script. This is equivalent to the toolbar button.
Running Scripts from the Script Window Context Menu
The Script window context menu is available by right-clicking in the Script window, and it has three options for running scripts:
- Run Line or Selection runs the currently selected text. This is equivalent to the toolbar button.
- Run to Cursor runs the current script from the top of the script to the cursor location.
- Run Current Script runs the currently open script. This is equivalent to the toolbar button.
Running Scripts from the Solution Explorer Context Menu
The Solution Explorer context menu is available by right-clicking any item (project, script, etc.) in the Solution Explorer. Options in the context menu depend upon the item type, and include the following options for running scripts:
- Run Project (projects only): runs all scripts in the selected project.
- Run Folder and Subfolders (folders only): runs all scripts in the selected folder and all scripts in any subfolders of the selected folder.
- Run Script (scripts only): runs the selected script.
Sourcing Scripts and Projects
When you run a script, the RPE processes it one line at a time, echoing each line to the R Console window (if open) and displaying any output from that line before continuing. If you have a project containing many scripts, running the project can take considerable time. A faster alternative is to source the project, which reads and parses an entire file, then evaluates it as a single top-level expression. This has two effects: first, this suppresses auto-printing of output from individual expressions, so that the only output displayed is that from explicit print and plot statements in the script. Second, if a syntax error is encountered while parsing a file, none of the file will be executed.
If your project contains script files with data and function definitions, it is usually a good idea to source those files and run only those scripts which perform the analysis you’re interested in.
To source a project:
In the Solution Explorer, right-click the project name.
Click Source Project.
To source a script:
In the Solution Explorer, right-click the script name.
Click Source Script.
-or-
Right-click anywhere in the Script window.
Click Source Current Script.
Customizing Revolution R Enterprise
Revolution R Enterprise offers a number of ways to customize the user interface to suit your working style. Among the aspects available for customization are the following:
- Window layout
- Whether to show line numbers in scripts
- Tab settings
- Font family, style, size, and color
- Keyboard shortcuts
This chapter describes how to perform these customizations.
Customizing the Window Layout
There are two types of windows in the Revolution R Enterprise user interface: document windows and tool windows.
Document windows contain scripts. By default, they are tabbed. To instead use multiple document windows, do the following:
From the Tools menu, choose Options….
Under Environment, click General. The Options dialog appears as follows:

Under Windows layout, select Multiple documents.
Click OK.
Tool windows, such as the Output and Breakpoints windows, can be repositioned in many ways:
- To resize the relative size of two docked (attached) windows: Place the cursor on the connecting border. The cursor changes to a double line with two arrows. Drag the cursor to change the relative size of the two windows.
- To allow windows to “float”: Right-click on the window’s title bar, and then click Floating. This can be useful if you are using dual monitors; you may, for example, want to undock your Console window and move it to the other monitor.
- To tab one or more tool windows: Right-click on the window’s title bar, and then click Tabbed.
- To dock a tool window: Right-click on the window’s title bar, and then click Dockable. Place the cursor on the title bar and drag the cursor. Gray arrows appear in the locations where the window can be docked. Drag the cursor to one of these arrows to highlight the location where the window will be docked. Release the mouse button to dock the window.
The RPE’s default window positioning has the tabbed Script windows in the upper left, the R Console window in the lower left, the Solution Explorer at upper right, and the Object Browser at lower right. If you would prefer to have the R Console window occupying the left side of the application, with the Script window to its right, do the following:
Click the R Console windows title bar, and begin to drag the cursor. The screen appears as shown below:
Note the cluster of arrows in the center:
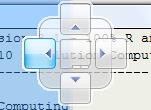
Move the cursor to the left pointing arrow in the cluster and release the mouse button.
The R Console window now occupies the left portion of the application window, as shown:
Your window positions are saved automatically when you close Revolution R Enterprise. There are two sets of window positions, corresponding to the two solution configurations, Release and Debug.
To restore the original window positions:
- From the Window menu, click Reset Window Layout.
Showing Line Numbers
Line numbers can be a convenient editing tool, especially for long, involved scripts. To add line numbers to your scripts:
In the Options dialog box, expand Text Editor and then expand All Languages.
Click General. The Options dialog appears as follows:
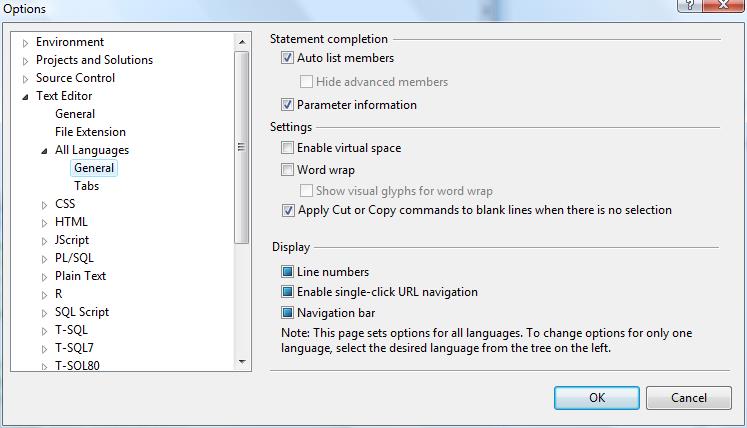
Under Display, click twice in the Line numbers check box to select the option.
Click OK.
Tab Settings
To modify the tab settings for the Script window:
In the Options dialog box, expand Text Editor and then expand R.
Click Tabs. The Options dialog appears as follows:
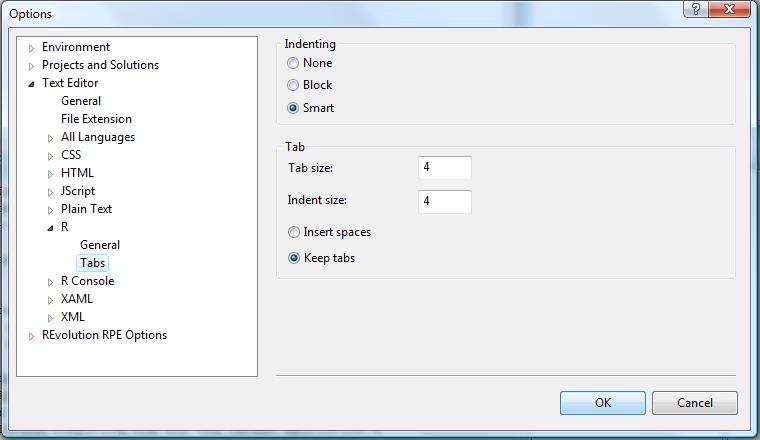
Specify the desired indenting for new lines, as follows:
- None: each new line starts in the leftmost column of the script editor.
- Block: each new line starts in the same column as the preceding line.
- Smart: Text following an opening brace ({) is indented one level; the previous indent level is restored after a closing brace (}).
Specify the desired tab and indent sizes. The tab size is the number of spaces generated by pressing Tab. The Indent size is the number of spaces generated by an automatic indent.
Specify whether to insert spaces when pressing a tab (the number of spaces inserted is equivalent to the Tab size) or to keep tabs (a tab character is inserted when pressing tab or generating an automatic indent).
Click OK to accept your changes.
Changing Font Characteristics
You can change the font family, style, size, and foreground and background color for the text displayed in most Revolution R Enterprise windows. Most commonly, you would change the font used in the Script window or the Output window. The font settings for the Output window apply also to the R Console window.
To change the font characteristics for a window:
From the Tools menu, choose Options….
Expand Environment, if it is not already.
Under Environment, click Fonts and Colors. The dialog appears as follows:
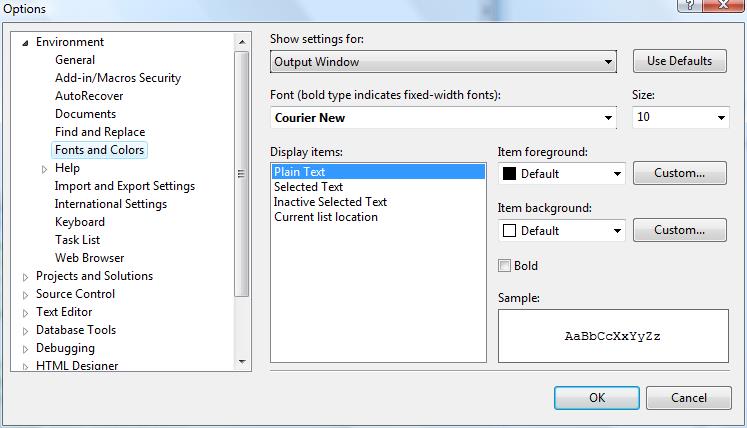
Under Show settings for, choose the type of window. Choose Text Editor to change the settings for the Script window, Output Window to change the settings for the Output or R Console window.
Select the font and size desired.
To change the foreground color of a display item, select the display item and either choose a color from the Item foreground dropdown or click Custom… to specify a custom color.
To change the background color of a display item, select the display item and either choose a color from the Item background dropdown or click Custom… to specify a custom color.
Click OK to accept your changes and close the dialog, or Cancel to abandon your changes.
Modifying Revolution R Enterprise Options
There are several Revolution R Enterprise -specific options in the RPE. They can all be modified from the Revolution RPE Options page of the Options dialog:
- Automatically restore saved objects: Each time you exit the RPE or close a solution, you are asked if you want to save the R objects in your session. Answering yes to this prompt creates a file of saved objects. If this option is True (the default), the RPE automatically loads these saved objects when you next start the RPE or open the solution.
- Automatically run .Rprofile: If you have a .Rprofile file in your solution’s directory, it is normally run automatically at startup. Set this to False to prevent the file from being run automatically.
- Buffered output and History size: These are both options you shouldn’t need to modify. Buffered output provides smoother output display and History size allows you to specify how many commands are stored in your commands history.
- Load last loaded solution at startup: This option provides standard Visual Studio behavior, which is to re-open the solution that was open when the application was last shut down.
- Output To Console: This option displays the output from R commands executed from a Script window to be displayed in the R Console window. This output is also available in the Output window.
- Prompt for Help source: Another option you shouldn’t need to modify, this option causes you to be prompted to look for help locally before looking online.
- Prompt to add opened R files: Normally, when you open a file that does not belong to the current project, you are asked if you want to add the file. Setting this option to False causes the RPE to skip the prompt and simply open the file without adding it to the current project.
Modifying Keyboard Shortcuts
You can create or modify keyboard shortcuts for most RPE commands. Keyboard shortcuts are assigned to either a specific feature, such as Text Editor, or as global shortcuts. Feature-specific shortcuts take precedence over global shortcuts.
To assign a keyboard shortcut:
In the Options dialog box, expand Environment and then click Keyboard. The Options dialog appears as follows:
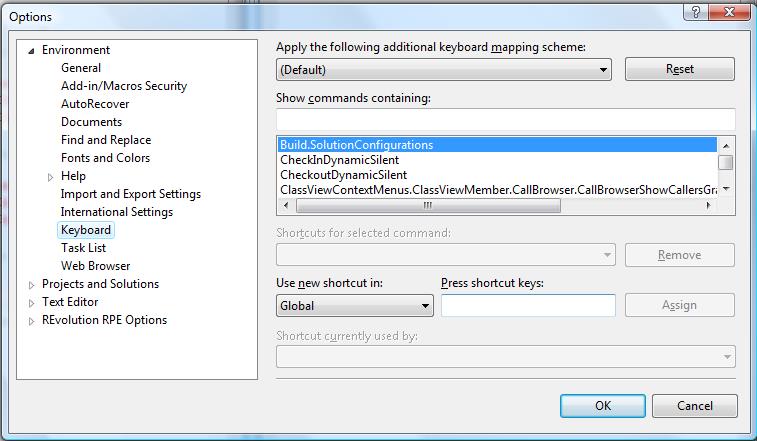
In the Show commands containing text box, type a word or command (such as Delete or Tile). A list of commands containing the word is shown.
Select the command for which you are specifying a shortcut.
In the Use new shortcut in menu, select the feature for which the shortcut applies, or use the default Global.
In the box labeled Press shortcut keys, press the desired keyboard shortcut. If the shortcut is already in use, the Shortcut currently used by box is filled in. To use that shortcut for your purposes, you must first remove it from the command it is currently used by.
If the shortcut is not already assigned, click Assign to complete the assignment.
Click OK to accept your changes.
To remove a keyboard shortcut:
In the Options dialog box, expand Environment and then click Keyboard.
In the Show commands containing text box, type a word or command (such as Delete or Tile). A list of commands containing the word is shown.
Select the command for which you are removing the shortcut. If the command has a shortcut, it is shown in Shortcuts for selected command, and the Remove button becomes active.
Click Remove.
Click OK to accept changes.
Debugging R Scripts
Revolution R Enterprise for Windows incorporates a visual debugger, and if you have ever used Visual Studio for debugging C#, C++, or Visual Basic, the operation of the Revolution R Enterprise debugger will be very familiar to you. However, if you are used to using the browser, trace, or debug functions of R, you will find the visual debugger is a new way of working. This chapter walks you through the basic operations of the visual debugger.
Using the Visual Debugger
To explore debugging using the visual debugger, create a new project, basicstats, with a single R script, and put the following lines into the script:
myVar <- function(x){
	n <- length(x)
	var <- ( (x-mean(x))^2/(n-1))
	var
}
regressYOnX <- function(x,y){
	sumx  <- sum(x)
	sumy  <- sum(y)
	sumxx <- sum(x^2)
	sumxy <- sum(x*y)
	b <- (sumxy - sumx * sumy /n)/(sumxx - (sumx)^2/n)
	a <- mean(y) - b*mean(x)
	returnVal <- c(a,b)
	names(returnVal) <- c("(Intercept)", "x")
	returnVal
}
The first function, myVar, is a “from the definition” implementation of a variance function. The second, regressYOnX, calculates the coefficients a and b of the regression of y on x and returns them as a vector. Both of these functions have errors in them, and we will use the visual debugger to help find them.
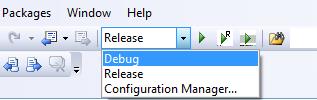
If you type these lines into your script (or copy and paste them from this document), you see that the script editor does not complain of syntax errors. So our first job is to run the script using the debugger. To do this, use the Solution Configurations dropdown menu to select Debug, as shown:
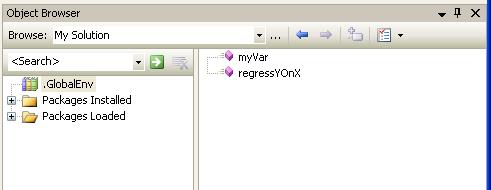
Next, click the Run Script button . The script runs, and the objects myVar and regressYOnX are created in your global environment, as you can see by looking at the Object Browser:
To test myVar, which should be equivalent to the built-in R function var, we simply need to create a vector x and see if the output of myVar is equivalent to the output of var. So we add the following lines to the script and re-run the script:
x <- rnorm(25)
var(x)
myVar(x)
The R Console window shows the following results, which indicates that our function is not equivalent to the built-in var function:
> x <- rnorm(25)
> var(x)
[1] 0.8883512
> myVar(x)
	[1] 1.151835e-02 2.837015e-02 5.715231e-02 1.776550e-03 2.308816e-03
	[6] 6.012832e-05 3.619039e-04 1.993373e-02 5.961041e-04 2.801520e-03
[11] 8.306429e-02 9.613675e-02 1.995132e-03 1.111981e-01 9.188450e-02
[16] 5.008679e-02 1.124161e-01 5.847513e-02 4.587514e-03 2.076363e-03
[21] 2.311226e-03 4.698980e-02 2.180058e-02 5.786210e-02 2.258723e-02
To see what the problem is, we set a breakpoint in our script at the line that calls myVar, by clicking in the gray left margin of the script window, as shown:
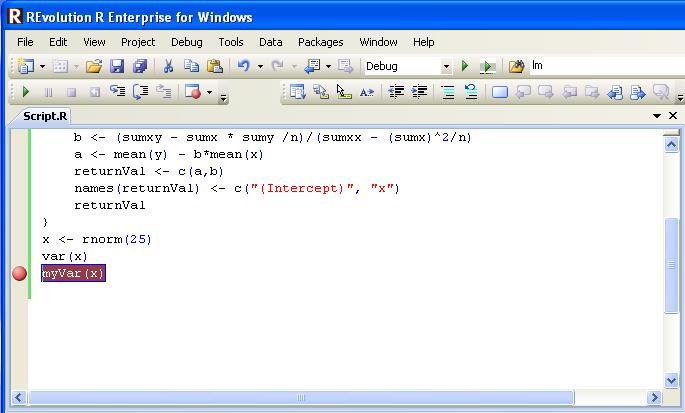
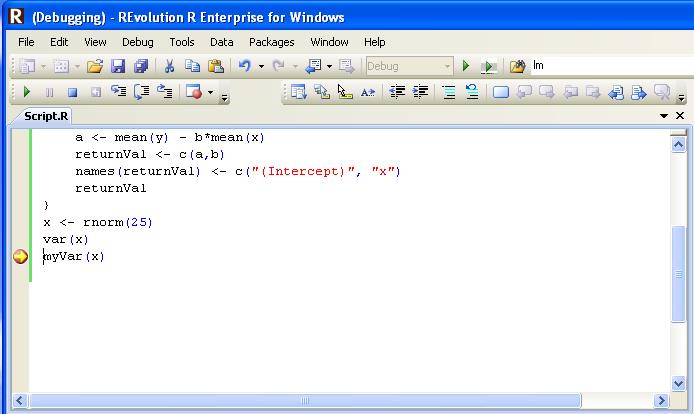
Click to run the script again. When the line containing the breakpoint is reached, execution halts, and the breakpoint shows an arrow, as shown:
Click the Step Into button  to step into the function. The cursor moves to the first line of our myVar function:
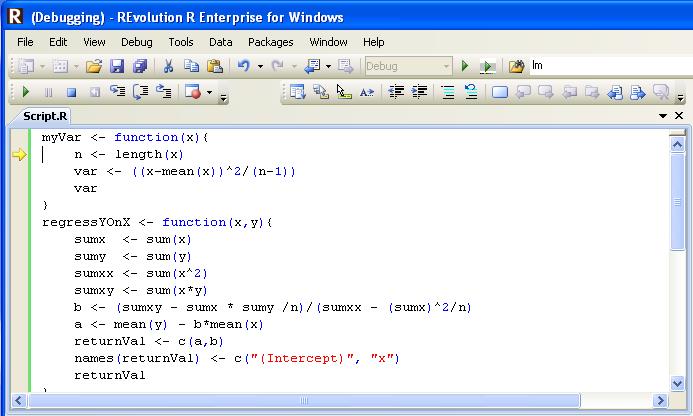
The line “n <- length(x)” seems OK, so click the Step Over button  to step to the next line. The cursor (and the yellow arrow) moves to the next line. The error should stare us in the face—we forgot to sum the squares of the individual variations, so we were returning a vector instead of a scalar. Click to complete the debugging session, and then edit myVar to read as follows:
myVar <- function(x){
	n <- length(x)
	var <- sum((x-mean(x))^2/(n-1))
	var
}
Remove the breakpoint in your script by clicking it, and then click to run the corrected script. The results in the R Console window confirm the fix:
> x <- rnorm(25)
> var(x)
[1] 0.7647091
> myVar(x)
[1] 0.7647091
Looking at Local Variables
Turning our attention to the regressYOnX function, the simplest test sets are those known to be lines. So, add the following line to your script:
regressYOnX(1:5, 1:5)
This should result in the line with intercept 0 and slope 1. But after adding this line and clicking as usual, our results are disappointing:
> regressYOnX(1:5, 1:5)
Error in regressYOnX(1:5, 1:5) : object 'n' not found
But, we now know what to do: set a breakpoint in the script at the newly added line, and then step into the function by clicking when processing stops at the breakpoint.
Click four times to arrive at the line where b is defined. To see the local variables defined at this point, click _Browser_Call in the left pane of the Object Browser. The top right pane then shows the local variables:
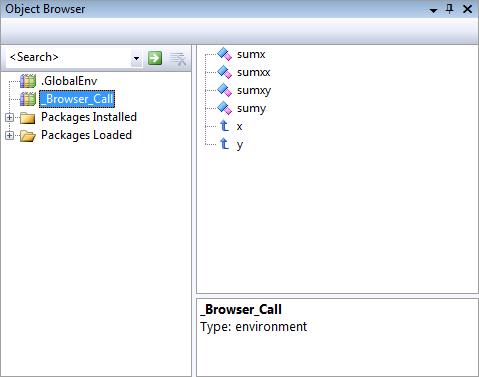
All of the variables needed to produce our value b are there except one—there is no n. We copied the formula from the text, but neglected to tell our function what n was. We just need one more line before the line that defines b, and that is a line defining n:
n <- length(x)
Stop the current debugging session by typing SHIFT-F5, add the above line, then rerun the script. You see the expected output:
> regressYOnX(1:5, 1:5)
(Intercept)           x
		0			  1
Sourcing Scripts for Debugging
When you run a script under the visual debugger, a copy of the script is created in memory and instrumented with debugging instructions. When you run a project under the debugger, instrumented copies of all the scripts in the project are created. As we saw in Chapter 3, running a project can take considerable time, particularly if the project contains many scripts, and there we saw that sourcing the script could save time. You can also source scripts and projects under the visual debugger. However, when you source scripts under the debugger, the instrumented copies are written to disk rather than kept in memory. While this can be a considerable timesaver, it may happen that the instrumented copies of the scripts become out of sync with the scripts themselves, and this can cause problems in execution under the debugger. If this occurs, you may need to clean the project of these instrumented copies. Cleaning the project removes all instrumented copies.
To source a project:
In the Solution Explorer, right-click the project name.
Click Source Project.
To source a script:
In the Solution Explorer, right-click the script name.
Click Source Script.
-or-
Right-click inside the Script editor.
Click Source Current Script.
To clean a project, thus removing any instrumented scripts:
In the Solution Explorer, right-click the project name.
Click Clean Project.
Note that sourcing a script under the debugger is different from sourcing a script by calling the source function from inside another script you are debugging—in the latter case, the sourced script is not instrumented and always runs in Release mode. As from Revolution R Enterprise 6.0, however, there is another option. The function revoSource can be used to source scripts and instrument them if the call to revoSource occurs while debugging.
For example, suppose we put the two original functions we wanted to debug into a script called basicStatsFuns.R:
myVar <- function(x){
	n <- length(x)
	var <- ( (x-mean(x))^2/(n-1))
	var
}
regressYOnX <- function(x,y){
	sumx  <- sum(x)
	sumy  <- sum(y)
	sumxx <- sum(x^2)
	sumxy <- sum(x*y)
	b <- (sumxy - sumx * sumy /n)/(sumxx - (sumx)^2/n)
	a <- mean(y) - b*mean(x)
	returnVal <- c(a,b)
	names(returnVal) <- c("(Intercept)", "x")
	returnVal
}
We then create a script to test these functions, which we call basicStatsTests.R: revoSource("basicstats/basicStatsFuns.R")
x <- rnorm(25)
var(x)
myVar(x)
If we set our breakpoint at myVar(x) as before and run this script in Debug mode, we can debug into the myVar function because the basicStatsFuns.R script is instrumented. If we use the source function instead of revoSource in basicStatsTests.R, we cannot debug into the myVar function because the basicStatsFuns.R script is not instrumented.
Using the Call Stack Window
When stopped at a breakpoint or stepping through the code, you can view the current call stack by opening the Call Stack window.
To open the Call Stack window, do either of the following:
- From the Debug menu, point to Windows and then click Call Stack
—or—
- Press CTRL+ALT+C
The Call Stack window appears as follows:
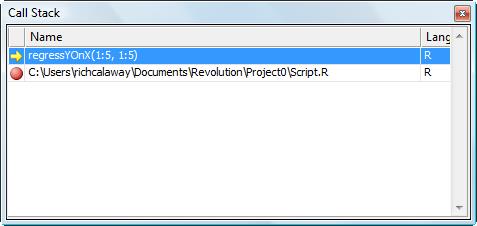
After you have opened the window, you can position it wherever you like. In addition to displaying the current call stack, you may double click on the first entry in the window to take you to the currently executing line of code, or click on the last entry to take you to the top-level command being executed.
Note
If you are sourcing rather than running files, clicking on the last source() entry will simply take you to the first line of the currently executing file.
Debugging in the R Console
The R Console normally runs in Release mode, even if the Solution Configurations dropdown is set to Debug. However, in certain cases it can be useful to run commands in the R Console under the debugger, and so Revolution R Enterprise provides this capability. For example, suppose we have set a breakpoint at the following line of our regressYOnX function:
b <- (sumxy - sumx * sumy /n)/(sumxx - (sumx)^2/n)
and have run our complete script in Debug mode so that the regressYOnX function is instrumented for debugging. In this case, we can run the regressYOnX function in the R Console window under the debugger as follows:
Set the Solution Configurations dropdown to Debug.
Type your call to regressYOnX at the R Console prompt.
Press SHIFT+ENTER.
Your call is then run under the debugger and you will stop at the specified breakpoint. You then can use the visual debugging commands described in this chapter as usual.
Troubleshooting Debugging Problems
The visual debugger included with the Revolution R Enterprise RPE is a powerful tool, but there are some circumstances in which it may not provide you the information you’re looking for. The usual cause of this is that the code you are debugging is using valid R code that is incompatible with the visual debugger. This section describes the most common culprits.
While stopped at a breakpoint in the visual debugger, the R Console window shows the prompt “Debug> “. If you are familiar with R’s browser function, you may be tempted to use its commands at this prompt. DO NOT USE browser COMMANDS WHILE STOPPED AT A BREAKPOINT. You may get into a state that will require you to shut down the RPE and restart. You can, however, type other R expressions at the “Debug> “ prompt, including object names (including local variable names), assignments, and virtually any other valid R expression.
If you type commands at the “Debug> “ prompt and see no output, check to see if the command you are debugging is redirecting output via sink() or similar functions. Re-directed output is incompatible with the visual debugger.
Another problematic R command is source(); although this command may be used in code being debugged, any script executed with it will always be executed in release mode - so you will not be able to debug into or hit breakpoints in any code defined in the sourced files. However, see the section Sourcing Scripts for Debugging for information on the revoSource function that can be used in place of source when you want sourced code instrumented for debugging. Note that using the 'Source' menu command in the RPE is not the same as using the R source function directly - using the RPE UI rather than the function WILL execute the sourced files in whichever mode, debug or release, is set in the UI.
Extending Revolution R Enterprise
Revolution R Enterprise is a powerful tool right out of the box, but because it is built on the Visual Studio Shell, it has a number of extensibility features, including macros, templates, and code snippets. This chapter introduces you to these features.
Macros
Macros allow you to combine common sequences of actions (which can include both mouse and keyboard actions) into a single, repeatable command. You can store and manage macros like any other user interface command—assign them keyboard shortcuts, add them to toolbars, etc.
To define a macro:
Start the macro recorder either doing either of the following, after which the Macro Recorder Toolbar appears:
Press CTRL+SHIFT+R
From the Tools menu, point to Macros, and then click Record TemporaryMacro.
Perform the actions you want to record in the macro.
When you are finished, click the Stop Recording button
 in the Macro Recorder Toolbar.
As the name of the menu item suggests, any macro you create is initially a temporary macro. You can play the temporary macro or save it for permanent use.
To play the temporary macro, do either of the following:
- Press CTRL+SHIFT+P
—or—
- From the Tools menu, point to Macros, and then click Play TemporaryMacro.
To save the temporary macro:
From the Tools menu, point to Macros, and then click Save TemporaryMacro. The Macro Explorer appears, with TemporaryMacro highlighted.
Type a name for your macro, and press ENTER.
Templates
Templates allow you to preserve the structure of a file or project for a later re-use. You can create both project and item templates; project templates supply the structure for an entire project and item templates supply the structure for a particular file type.
Creating a Project Template
Most of us tend to organize our work in similar ways from project to project. Project templates allow you to automate some of that organization.
For example, suppose that in each of your projects, you use one script to define functions specific to that project and a second script to define numeric constants used throughout the project. You can easily define a new project with this initial structure, and then save it as a project template.
To create the project with the desired structure:
On the File menu, point to New, and then click Project.
In the Name text box in the New Project dialog box, type MyProjectTemplate.
Click OK. You may be prompted to choose whether or not to save the files in the current solution and its R workspace.
In the Solution Explorer, right-click the project MyProjectTemplate, point to Add, and then click New Item….
In the Name text box in the Add New Item dialog box, type functions.R.
In the Solution Explorer, right-click the file Script.R and rename it constants.R.
Now edit the script files. Any content you add to your project template is automatically included in a new project created from that template.
In the Solution Explorer, double-click functions.R to open the script in a Script window.
Add the following line to the top of functions.R:
# Specify all function definitions in this fileIn the Solution Explorer, double-click constants.R to open the script in a Script window.
Add the following line to the top of constants.R:
# Define numeric constants here
By default, when you click the Run/Continue button , Revolution R Enterprise runs all the scripts in the current project folder in alphabetical order. Thus, your file constants.R is run before functions.R, and so you can safely use constants defined in that file in your function definitions.
Now you’re ready to create a project template:
On the File menu, click Export Template…. (Click Yes if asked to save your solution and/or project file.)
On the Choose Template Type page of the Export Template Wizard, select Project template.
Specify MyProjectTemplate as the project from which to create the template.
Click Next.
On the Select Template Options page of the Export Template Wizard, type My Usual Project in the Template name text box and type a suitable description in the Template description text box.
Click Finish.
To verify that your template has been successfully deployed, point to New in the File menu, and then click Project…. You should see My Usual Project listed under My Templates on the right side of the New Project dialog box.
Code Snippets
Code Snippets provide a convenient way for new users to learn R coding by providing fill-in-the-blanks code fragments—from flow-of-control constructions to function calls to longer code fragments that users can put together to create complete analyses. Revolution R Enterprise comes with a number of built-in Code Snippets, but the real power is in the ability for local R experts to create their own snippets to share with their colleagues or the R community.
A Code Snippet is an XML file with a specific structure. The file CodeSnippetTemplate.snippet in the IDE\doc\examples folder of your Revolution R Enterprise installation directory can be used as a starting point for creating your own snippets. The first line of the Code Snippet identifies the file as XML. The second and third lines are (opening) tags identifying the snippet as a Visual Studio 2005 Code Snippet:
	<?xml version="1.0" encoding="utf-8" ?>
	<CodeSnippets  xmlns="http://schemas.microsoft.com/VisualStudio/2005/CodeSnippet">
	  <CodeSnippet Format="1.0.0">
The next few lines are the Code Snippet header, where you provide a title, a shortcut, a description, your name (or your company name, if appropriate), and specify whether the snippet is an Expansion, that is, stand-alone, snippet, or a SurroundsWith snippet (which surrounds a bit of selected text). A snippet can be both an Expansion and SurroundsWith snippet:
    <Header>
      <Title>Snippet Template</Title>
      <Shortcut>SnipTemp</Shortcut>
      <Description>Skeleton Template for User-Defined Templates</Description>
      <Author>A. R. User</Author>
      <SnippetTypes>
        <SnippetType>SurroundsWith</SnippetType>
        <SnippetType>Expansion</SnippetType>
      </SnippetTypes>
    </Header>
The next sections include the heart of the snippet—the declarations specify which pieces of the inserted code are to be filled in by the user, and allow you to specify tooltip text to inform the user how those pieces are to be filled in:
    <Snippet>
      <Declarations>
        <Literal>
          <ID>
            <!--ID of first "fill-in-the-blank" blank-->
            fnName
          </ID>
          <ToolTip>
            <!--Tooltip for first "fill-in-the-blank" blank-->
          </ToolTip>
          <Default>myFunction</Default>
        </Literal>
        <Literal>
          <ID>arguments</ID>
          <ToolTip>Function arguments</ToolTip>
          <Default> </Default>
        </Literal>
        <Literal>
          <ID>expressions</ID>
          <ToolTip>Expressions in the function</ToolTip>
          <Default> </Default>
        </Literal>
       </Declarations>
Finally, you specify the code. The IDs of the placeholders you defined in the declarations are used in the code surrounded by dollar sign characters ($):
      <Code Language="R">
        <![CDATA[
	$fnName$ <- function($arguments$)
	{
	   $selected$ $expressions$ $end$
	}
        ]]>
      </Code>
The last lines of the code snippet are closing tags:
	    </Snippet>
	  </CodeSnippet>
	</CodeSnippets>
When you create your own Code Snippets, Revolution R Enterprise looks for them in a particular location, by default the folder Revolution\Code Snippets\R\My Code Snippets under your personal documents directory.
As an example of a Code Snippet created from this template, here is a Code Snippet for launching a NetWorkSpaces sleigh, that uses the package nws from the ParallelR component of Revolution R Enterprise:
	<?xml version="1.0" encoding="utf-8" ?>
	<CodeSnippets  xmlns="http://schemas.microsoft.com/VisualStudio/2005/CodeSnippet">
	  <CodeSnippet Format="1.0.0">
	    <Header>
	      <Title>Create a Sleigh</Title>
	      <Shortcut>sleigh</Shortcut>
	      <Description>Set up a NetWorkSpaces sleigh for parallel
	                    computing</Description>
	      <Author>Revolution Computing</Author>
	      <SnippetTypes>
	        <SnippetType>Expansion</SnippetType>
	      </SnippetTypes>
	    </Header>
	    <Snippet>
	      <Declarations>
	        <!--Use this section to specify the placeholders-->
	        <Literal>
	          <ID>nodeList</ID>
	          <ToolTip>
	            a list of hosts on which workers will be created. This argument is
	            ignored when launch='local'.
	          </ToolTip>
	          <Default>rep('localhost', 3)</Default>
	        </Literal>
	        <Literal>
	          <ID>workerCount</ID>
	          <ToolTip>number of workers to be created</ToolTip>
	          <Default>3</Default>
	        </Literal>
	        <Literal>
	          <ID>launch</ID>
	          <ToolTip>method to launch remote workers. Can be set to the strings 'local' 	or 'web', or to a function object.</ToolTip>
	          <Default>'local'</Default>
	        </Literal>
	       </Declarations>
	      <Code Language="R">
	        <![CDATA[
	s <- sleigh(nodeList = $nodeList$, workerCount = $workerCount$, launch = $launch$)$end$]]>
	      </Code>
	    </Snippet>
	  </CodeSnippet>
	</CodeSnippets>
Managing Projects and Solutions
Revolution R Enterprise for Windows provides a Revosystem for managing R projects and solutions, based on the system used by Visual Studio for managing compiled code. You can combine the R scripts, data, and other related documents within your projects, and you can easily share solutions with colleagues. This chapter describes the Revolution R Enterprise for Windows solution system and gives several examples of its use.
Specifying a Working Directory
The working directory is where R by default searches for files and writes files. The default working directory is specified by the Start In field of your Revolution R Enterprise shortcut properties. You can modify this field to specify a different default working directory, and you can modify your working directory during a Revolution R Enterprise session. The working directory also changes when you create or open a non-default solution, to the solution directory. (Normally, the solution directory is a subdirectory of the default working directory.)
If you want to specify a working directory on a drive specified by a Universal Naming Convention (UNC) path, you must ensure that the drive has been granted FullTrust by the Code Access Security Policy Tool; otherwise, Revolution R Enterprise will be unable to create a default solution on the drive, and you will receive warnings when you create or open a solution or project.
To specify a default working directory:
In the Start menu, navigate to the Revolution R Enterprise shortcut.
Right-click the shortcut, and click Properties.
In the Target field, append the path to a directory for which you have write permission as a quoted string to the end of the command ending in ‘RevoIDE.exe”’. If there is already a directory specified, you can replace it, but be careful not to change anything before the ‘RevoIDE.exe”’.
For example,
C:\Windows\SysWOW64\cmd.exe /c echo Starting... & "C:\Revolution\R-Enterprise-x.x\IDE64\Run_GUI.bat" "C:\Revolution\R-Enterprise-x.x\IDE64\RevoIDE.exe" "C:\Users\yournamehere"
(If the drive chosen is a network drive specified by a UNC path, grant the drive full trust as described below.)
To change the working directory from within Revolution R Enterprise:
From the File menu, click R Working Directory….
In the Browse for Folder dialog, choose a directory for which you have write permission. (If the drive chosen is a network drive specified by a UNC path, grant the drive full trust as described below.)
Click OK.
To grant a network drive full trust on Windows 7 or Windows Vista systems:
From the Start menu, navigate to Accessories, and then right-click Command Prompt.
Click Run as administrator.
Change directory to C:\Windows\Microsoft.NET\Framework\v2.0.50727
Type the following command:
caspol -machine -addgroup 1. –url \\unc\path\* FullTrustwhere \unc\path is the path to the network drive. If prompted, type yes to complete the action.
To grant a network drive full trust on Windows XP systems:
From the Start menu, navigate to Accessories, and then right-click Command Prompt.
Click Run as… and specify a user with Administrator privileges. If you are logged in as a user with Administrator privileges, clear the check box Protect my computer and data from unauthorized program activity and click OK.
Change directory to C:\Windows\Microsoft.NET\Framework\v2.0.50727
Type the following command:
caspol -machine -addgroup 1. –url \\unc\path\* FullTrustwhere \unc\path is the path to the network drive. If prompted, type yes to complete the action.
Creating a Project
Although the top-level organizational unit of Revolution R Enterprise for Windows is the solution, solutions are never created directly. Instead, you create projects, and each new project can either be placed in its own solution or placed in an existing solution. By default, a project named Project0 is created when you start Revolution R Enterprise, with a default solution named RSolution0. When you create a project, the default behavior is to create a new solution with the same name as the new project. All of the examples we have seen up to now use this default behavior.
To create a project in a new solution:
From the File menu, point to New¸ and then click Project….
Type a name for the project in the Name text box, and then click OK.
The Solution Name text box automatically changes to reflect the project name you entered.
To create a project in an existing solution:
From the File menu, point to New, and then click Project….
Type a name for the project in the Name text box.
In the Solution dropdown menu, choose Add to Solution.
Click OK.
—or—
Open the target solution.
In the Solution Explorer, right-click the solution name, point to Add, and then click New Project….
Type a name for the project in the Name text box.
Click OK.
Creating a Project from an Existing Folder
If you have R scripts in existing folders, for example, in existing R packages, you can easily create RPE projects from those existing folders.
To create a project from an existing folder:
From the File menu, point to New¸ and then click Solution from Folder….
Navigate to the desired folder in the Browse for Folder dialog, and then click OK.
A solution is created with the same name as the name of the folder you selected, with a single project whose name is the name of the folder concatenated with the word “Project”.
Opening a Solution
Solutions are stored in their top-level directories as files with .Rsln extensions. Another file, with extension .Rsou, stores the state of the solution when it is closed, so that information such as which files are open, and where breakpoints have been set, is preserved from session to session.
To open a solution:
Navigate to the solution’s top-level directory (generally, this will be a subdirectory of the Revolution directory under the user’s document directory.)
Double-click the file with the .Rsln extension (there should normally be just one such file in a solution directory).
Opening a Project
Projects are stored as files with .rproj extensions in project directories within solution directories. Opening a project opens its enclosing solution as well.
To open a project:
Navigate to the project directory.
Double-click the file with the .rproj extension (there should normally be just one such file in a project directory).
Working with Projects and Solutions
Adding a File to a Solution
R script files are always associated with projects, but data files and other related files can be associated with either solutions or projects. This is important because the R working directory is set to the solution directory; thus, data files you plan to read in with R functions such as read.table should be associated with solutions.
To add a file to a solution:
Copy or create the file in the solution directory.
Open the solution.
In the Solution Explorer, right-click the solution name, point to Add, and then click Existing Item….
Select the file in the Add Existing Item dialog box, and then click Add.
Adding a File to a Project
To add a file to a project:
Copy or create the file in the project directory.
Open the solution containing the project.
In the Solution Explorer, right-click the project name, point to Add, and then click Existing Item....
Select the file in the Add Existing Item dialog box, and then click Add.
Creating an R Package as an R Project
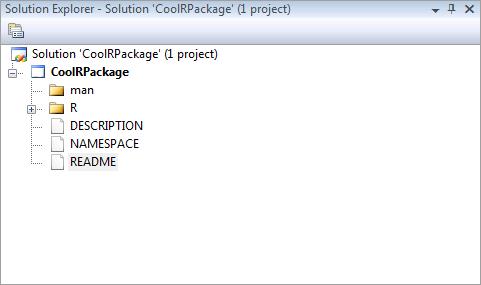
You can use the project type R Package Project to create a new R package. The package is created as an R project containing a DESCRIPTION file, a NAMESPACE file, and R and man directories for holding R scripts and .Rd format help files, respectively. As in all new R projects in the RPE, an empty R script is created for you, but in the R Package Project it is in the R directory. (A README file is also created with instructions for making the package skeleton ready to build. After you have your package ready to go, you can safely delete this file from your package.)
To create an R Package Project:
From the File menu, point to New, and then click Project…
From the New Project dialog, select R Package Project from the Revolution Installed Templates and enter a name for your package in the Name textbox.
Click OK.
The new package project appears in your Solution Explorer as shown below:
As you add functions to your R script, you can create help files for them:
Right-click on the man directory in the Solution Explorer, point to b, and then click New Item.
Click the Rd Help File template and type a name for the Rd file. If the base name matches that of an existing R object, you are asked if you want to use that object to generate a help file skeleton (via the R prompt function). Click Yes to generate the skeleton help file, or No to open an empty file. If the base name does not match that of an existing R object, an empty file is created and opened.
Click OK.
(You don’t need to have an R package to create help files, however. The Rd Help File template is available in all R project types.)
The DESCRIPTION file is a template that you will need to edit before building your package, and the NAMESPACE file is a stub to which you should add directives. Complete details for both of these steps can be found in the R manual Writing R Extensions (R-exts.pdf). After you have completed these steps, you can build your package by right-clicking the package name and then clicking Build R Package from the context menu.
Managing Solution Startup
Normally, when you open a solution, the following events occur:
You are prompted to save the objects in your global environment. If you choose to save them, you can specify a file name for the saved file, or accept the default .Rdata.
The objects in the global environment are deleted.
The solution is opened in Revolution R Enterprise for Windows.
The R working directory is set to the solution directory.
If a file .Rdata is found in the solution directory, R reads the file, restoring the objects defined within to the global environment. Similarly, if a file .Rhistory is found in the solution directory, R loads it, making it available for command-line recall. You can skip the loading of .Rdata by setting the option Automatic restore saved objects to FALSE on the Revolution IDE Options page of the Options dialog.
If a file .Rprofile is found in the solution directory, it is executed, unless a file having the same name as the solution but with extension .Rprofile is found (for example, SATanalysis.Rprofile), in which case that file is executed instead. You can skip the loading of .Rprofille by setting the option Automatic run .Rprofile to FALSE on the Revolution IDE Options page of the Options dialog.
You can use the file .Rprofile (or solution.Rprofile) to specify actions you want R to perform every time you open a given solution. For example, you might want to ensure that certain packages such as the ParallelR package nws are loaded, so you could include lines such as the following:
library(nws)
Any valid R expression can be executed from the .Rprofile file. See the Startup help file for more details.