より多くのデータを Power BI からフェッチする
Power BI 視覚エフェクトを有効にして 30K 行のデータ ビューのハード制限を回避する 1 つの方法として、fetchMoreData API を使ってさまざまなサイズのデータ チャンクを読み込むことができます。 要求されたすべてのチャンクを集計する既存の手法に加え、この API は、データ チャンクの増分読み込みもサポートしています。
一度にフェッチする行数を事前に構成することや、dataReductionCustomization を使って、チャンク サイズを動的に設定する機能をレポート作成者に許可することができます。
注意
fetchMoreData API はバージョン 3.4 以降で使用できます。
動的 dataReductionCustomization API は、バージョン 5.2 以降で使用できます。
使用しているバージョンを確認するには、pbiviz.json ファイルの apiVersion を確認してください。
大規模なセマンティック モデルのセグメント化フェッチを有効にする
必須の dataViewMapping に対して、視覚エフェクトの capabilities.json ファイルで、dataReductionAlgorithm のウィンドウ サイズを定義します。 count によってウィンドウ サイズが決定され、更新ごとに dataview に追加できる新しいデータ行の数が制限されます。
たとえば、一度に 100 行のデータを追加するには、capabilities.json ファイルに次のコードを追加します。
"dataViewMappings": [
    {
        "table": {
            "rows": {
                "for": {
                    "in": "values"
                },
                "dataReductionAlgorithm": {
                    "window": {
                        "count": 100
                    }
                }
            }
    }
]
新しいセグメントが既存の dataview に追加され、update 呼び出しとしてビジュアルに提供されます。
Power BI ビジュアルで fetchMoreData を使用する
Power BI では、次の 2 つのいずれかの方法で fetchMoreData を使用することができます。
- "セグメント集計" モード
- "増分更新" モード
セグメント集計モード (既定)
セグメント集計モードでは、ビジュアルに提供されるデータ ビューに、前のすべての fetchMoreData requests の累積データが含まれます。 そのため、データ ビューのサイズはウィンドウ サイズに応じて更新のたびに大きくなります。 たとえば、合計 100,000 行が予想され、ウィンドウ サイズが 10,000 に設定されている場合、最初の更新データ ビューには 10,000 行、2 番目の更新データ ビューには 20,000 行を含める必要があります。
aggregateSegments = true を使用して fetchMoreData を呼び出して、セグメント集計モードを選択します。
dataView.metadata.segment の存在を調べると、データが存在するかどうかを確認できます。
    public update(options: VisualUpdateOptions) {
        const dataView = options.dataViews[0];
        console.log(dataView.metadata.segment);
        // output: __proto__: Object
    }
また、options.operationKind を調べると、更新が最初の更新か、それとも 2 回目以降の更新かを確認することもできます。 次のコードで、VisualDataChangeOperationKind.Create では最初のセグメントが参照され、VisualDataChangeOperationKind.Append では後続のセグメントが参照されます。
// CV update implementation
public update(options: VisualUpdateOptions) {
    // indicates this is the first segment of new data.
    if (options.operationKind == VisualDataChangeOperationKind.Create) {

    }

    // on second or subsequent segments:
    if (options.operationKind == VisualDataChangeOperationKind.Append) {

    }

    // complete update implementation
}
次のように、UI イベント ハンドラーから fetchMoreData メソッドを呼び出すこともできます。
btn_click(){
{
    // check if more data is expected for the current data view
    if (dataView.metadata.segment) {
        // request for more data if available; as a response, Power BI will call update method
        let request_accepted: bool = this.host.fetchMoreData(true);
        // handle rejection
        if (!request_accepted) {
            // for example, when the 100 MB limit has been reached
        }
    }
}
this.host.fetchMoreData メソッドの呼び出しに対する応答として、Power BI では新しいデータ セグメントを使用してビジュアルの update メソッドが呼び出されます。
注意
クライアントのメモリ制約を回避するため、Power BI では、フェッチされるデータの合計が 100 MB に制限されています。 この制限に達すると、fetchMoreData() によって false が返されます。
増分更新モード
この増分更新モードでは、ビジュアルに提供されるデータ ビューには、次の増分データ セットのみが含まれます。 データ ビューのサイズは、定義されたウィンドウ サイズと同じです (データの最後のビットがウィンドウ サイズより小さい場合は、より小さくなります)。 たとえば、合計 101,000 行が予想され、ウィンドウ サイズが 10,000 に設定されている場合、視覚エフェクトはデータ ビューのサイズが 10,000 で 10 個の更新を取得し、1 つの更新のデータ ビューのサイズは 1,000 です。
増分更新モードは、aggregateSegments = false で fetchMoreData を呼び出すと選択されます。
dataView.metadata.segment の存在を調べると、データが存在するかどうかを確認できます。
    public update(options: VisualUpdateOptions) {
        const dataView = options.dataViews[0];
        console.log(dataView.metadata.segment);
        // output: __proto__: Object
    }
また、options.operationKind を調べると、更新が最初の更新か、それとも 2 回目以降の更新かを確認することもできます。 次のコードで、VisualDataChangeOperationKind.Create では最初のセグメントが参照され、VisualDataChangeOperationKind.Segment では後続のセグメントが参照されます。
// CV update implementation
public update(options: VisualUpdateOptions) {
    // indicates this is the first segment of new data.
    if (options.operationKind == VisualDataChangeOperationKind.Create) {

    }

    // on second or subsequent segments:
    if (options.operationKind == VisualDataChangeOperationKind.Segment) {

    }

    // skip overlapping rows
    const rowOffset = (dataView.table['lastMergeIndex'] === undefined) ? 0 : dataView.table['lastMergeIndex'] + 1;

    // Process incoming data
    for (var i = rowOffset; i < dataView.table.rows.length; i++) {
        var val = <number>(dataView.table.rows[i][0]); // Pick first column

     }

    // complete update implementation
}
次のように、UI イベント ハンドラーから fetchMoreData メソッドを呼び出すこともできます。
btn_click(){
{
    // check if more data is expected for the current data view
    if (dataView.metadata.segment) {
        // request for more data if available; as a response, Power BI will call update method
        let request_accepted: bool = this.host.fetchMoreData(false);
        // handle rejection
        if (!request_accepted) {
            // for example, when the 100 MB limit has been reached
        }
    }
}
this.host.fetchMoreData メソッドの呼び出しに対する応答として、Power BI では新しいデータ セグメントを使用してビジュアルの update メソッドが呼び出されます。
注意
データ ビューのさまざまな更新に含まれるデータのほとんどが排他的であっても、連続するデータ ビュー間にはいくつかのオーバーラップが存在します。
テーブルとカテゴリ データのマッピングでは、最初の N 行のデータ ビューに、前のデータ ビューからコピーされたデータが含まれることが予想されます。
N は、次のようにして決定できます: (dataView.table['lastMergeIndex'] === undefined) ? 0 : dataView.table['lastMergeIndex'] + 1
視覚エフェクトは、渡されたデータ ビューを保持します。そのため、Power BI と追加の通信を行わずにデータにアクセスできます。
カスタマイズされたデータの削減
どのようなデータを表示するために視覚エフェクトが使われるかについて、開発者が常に事前に知ることはできません。そのため、データ チャンクのサイズを動的に設定する機能をレポート作成者に許可する場合があります。 API バージョン 5.2 以降、毎回フェッチするデータ チャンクのサイズを設定する機能をレポート作成者に許可できるようになりました。
このカウントを設定する機能をレポート作成者に許可するには、まず capabilities.json ファイルに dataReductionCustomization というプロパティ ペイン オブジェクトを定義します。
    "objects": {
        "dataReductionCustomization": {
            "displayName": "Data Reduction",
            "properties": {
                "rowCount": {
                    "type": {
                        "numeric": true
                    },
                    "displayName": "Row Reduction",
                    "description": "Show Reduction for all row groups",
                    "suppressFormatPainterCopy": true
                },
                "columnCount": {
                    "type": {
                        "numeric": true
                    },
                    "displayName": "Column Reduction",
                    "description": "Show Reduction for all column groups",
                    "suppressFormatPainterCopy": true
                }
            }
        }
    },
次に、dataViewMappings の後に dataReductionCustomization の既定値を定義します。
   "dataReductionCustomization": {
        "matrix": {
            "rowCount": {
                "propertyIdentifier": {
                    "objectName": "dataReductionCustomization",
                    "propertyName": "rowCount"
                },
                "defaultValue": "100"
            },
            "columnCount": {
                "propertyIdentifier": {
                    "objectName": "dataReductionCustomization",
                    "propertyName": "columnCount"
                },
                "defaultValue": "10"
            }
        }
    }
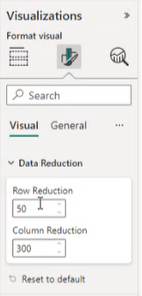
書式設定ペインの [視覚化] の下に、データの削減情報が表示されるようになります。
考慮事項と制限事項
ウィンドウのサイズは、2 から 30,000 の範囲に制限されています。
データ ビューの合計行数は 1,048,576 行に制限されています。
セグメント集計モードでは、データ ビューのメモリ サイズは 100 MB に制限されています。
次のステップ
フィードバック
以下は間もなく提供いたします。2024 年を通じて、コンテンツのフィードバック メカニズムとして GitHub の issue を段階的に廃止し、新しいフィードバック システムに置き換えます。 詳細については、「https://aka.ms/ContentUserFeedback」を参照してください。
フィードバックの送信と表示