
You can use the Microsoft Power BI template to import data into Power BI from Project for the web and Project Online. When you're using the template, you're connected to your Microsoft Dataverse instance, where your Microsoft Project web app data is stored. With the template, you'll be able to download a variety of data to visually explore, monitor, and get reports on key aspects of your Project Portfolio Management (PMM) deployment.
The numbered sections below explain how to set up, launch, and configure your Power BI Desktop template, Dataverse URL, and your Project Web App URL. After those sections, you'll see information on important steps to take after you're connected to your data.
Follow these steps in order, and then see specific types of reports you can use to help you analyze your data and organize your projects.
1. Set up your Power BI Desktop
1. Download the setup wizard. In your Downloads folder, find and open the file named PBIDesktopSetup.exe, and then follow the instructions to complete the installation.
2. Before you install the Power BI template, you must have:
-
A subscription for either Project Plan 3 (previously named Project Online Professional) or Project Plan 5 (previously named Project Online Premium).
-
A subscription for either Power BI Desktop or Power BI Pro.
3. When those things are in place, go to Project Power BI Templates. Open the Project for the Web folder, and then select Go to file.
-
For a consolidated report:
Choose Consolidated Reports/Microsoft Power BI Template.pbit. From your Downloads folder, open the file and then follow the instructions to complete the installation. -
For a Project Online report:
Select Project Online/Microsoft Project Online Power BI Content Pack.pbit. and then select Download. From your Downloads folder, open the file and then follow the instructions to complete the installation. -
For a Project for the web report pack:
Choose Project for the web/Microsoft Project for the Web Power BI Template.Pbit and then select Download. From your Downloads folder, open the file and then follow the instructions to complete the installation.
2. Launch and configure the Power BI Desktop template file
-
Select the Project Power BI template file to open it in Power BI Desktop.
-
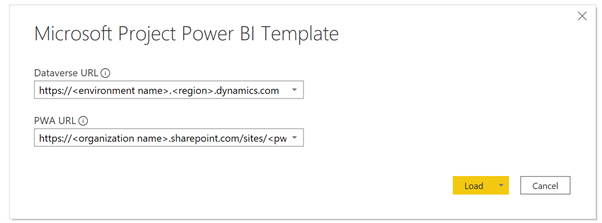
On the Enter Parameters screen, in the Dataverse URL field, type the URL of your Dynamics 365 Dataverse instance you're using for Project for the web.
-
In the PWA URL field, type the URL of your Project Online Project Web App site; for example, https://contoso.sharepoint.com/sites/PWA. Then select Load.
-
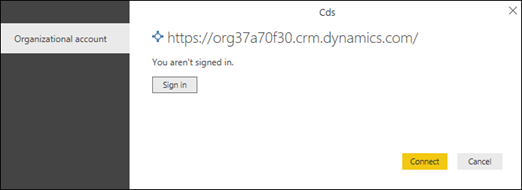
Power BI Desktop will prompt you to authenticate with your Microsoft 365 A5 account. Select Organizational account, then Sign In, and type your credentials.
A message will be displayed, telling you that your data is loading. Depending on the number of projects, tasks, and resources in your system, this may take some time.
If you get an error during the load process that says access to a resource is forbidden, check your data source settings permissions by following these steps:
-
In the ribbon, select Edit queries, and then select Data source settings.
-
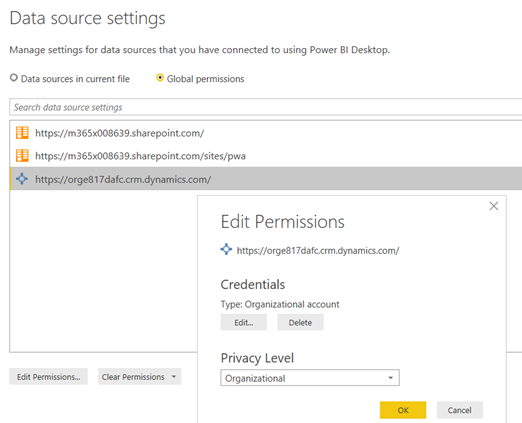
Select Global permissions, choose a data source URL, and then select Edit permissions at the bottom of the screen.
-
On the Edit permissions screen, make sure that Privacy level is set to Organizational.
-
Verify that for Credentials, the Type is set to Organizational account. If it isn't, select Edit, then choose Organizational account on the left pane, and sign in with your credentials. Select Save, and then verify that the Credentials Type has changed.
-
Follow steps 1 through 5 for each of your remaining data source URLs. When you're finished, select Close.
6. Load your data.
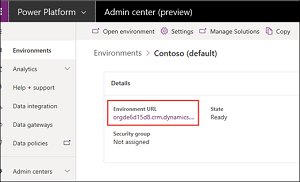
3. Determine your Dataverse URL
Project for the web data is stored in the Dynamics 365 Dataverse. The following steps explain how to find the environment name and the region value for your Dataverse URL.
Find the environment name for your Dataverse URL
-
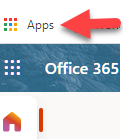
Sign in to Office.com, and then select Apps > All Apps.
-
To create the Dataverse URL, Scroll to Business Apps and select it, or use the search feature to locate it. Next, choose the project application for the organization you want to build your reports about. The Business Apps URL will show you the environment and region value.
-
Type the URL of your Dataverse instance in this way: https://environmentname.regionvalue.dynamics.com. An example of this is https://orgde6d15d8.crm.dynamics.com. Check that you have the region value you need by reviewing the list of regions and their values in the section below.

Set the region value for your Dataverse URL
The region value is usually associated with the data center that's geographically closest to you. If you need to change the region value from the one that's already in your Dataverse URL, see the list below.
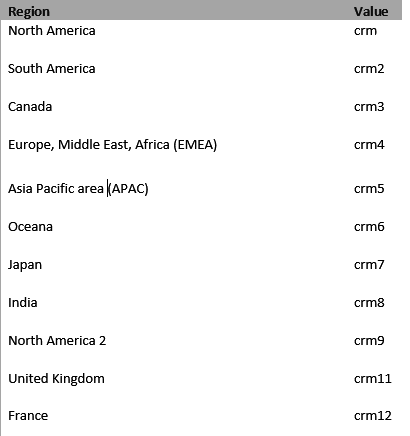
Tip: If you aren't sure which region to use for your location, ask your administrator to check the value in the Power Platform Admin center.
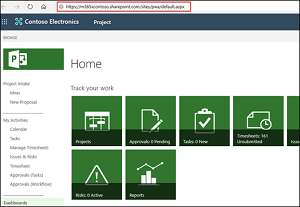
4. Determine your Project Web App (PWA) URL
You can go to your Project Online PWA site home page to find the PWA site URL. Use these steps.
1. Sign in to Office.com, select Apps, and then select Project.
2. On your Project Home page, select Go to Project Online. This will take you to your PWA Home page.
3. Copy the URL in your browser and use that value for the PWA URL field in the Project template.
Tip: If you aren't sure, ask your administrator to check the value in the Power Platform Admin center.
5. After connecting to your data
Important: To get a portfolio-level view of the data, you must have read permissions at the business-unit level for the Dataverse entities connected to the report.
Set up sharing and a refresh schedule
After Power BI Desktop retrieves the data, the visualizations in each report page will load and display the data. Before you view your project reports, it's best to complete these steps:
-
From the Power BI Desktop, publish the report to a shared workspace.
-
Configure scheduled refresh of the data to keep your dataset current.
Project reports
When you've completed the setup steps above, you can view and analyze your data using several different types of reports.
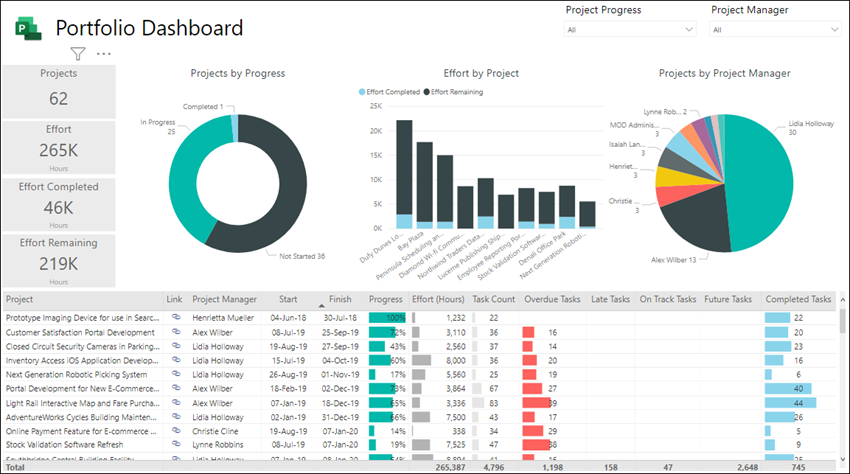
Portfolio Dashboard
This report gives you a roll-up of all projects. It lets you know the total number of projects, effort completed, and remaining effort. You can filter your project data by project progress or by project manager.
Portfolio Timeline
This gives a visual representation of where all your projects fall on a timeline, including their duration and progress to date.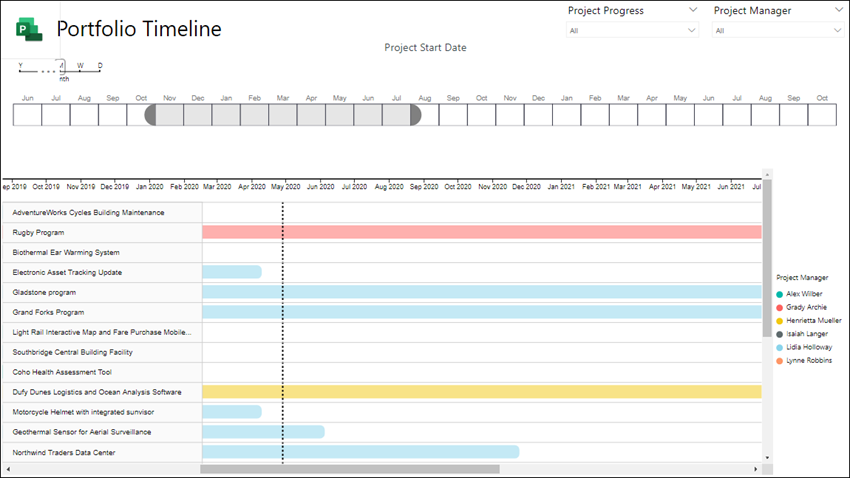
Portfolio Milestones
This report summarizes all milestones completed and those that are still in progress, over the past 30 days. It also shows you the milestones you have planned for the next 30 days.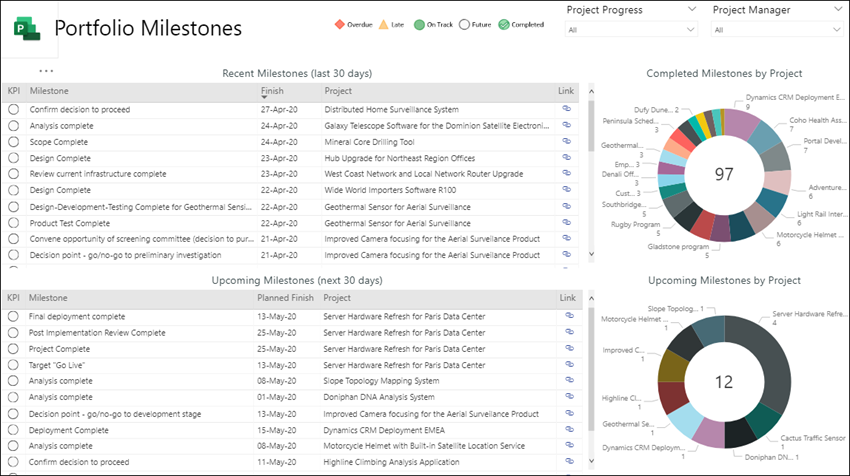
Resource Dashboard
This shows a resource manager an overview of how their resources are allocated to projects. It displays details about the total effort for each resource, remaining tasks, and task status.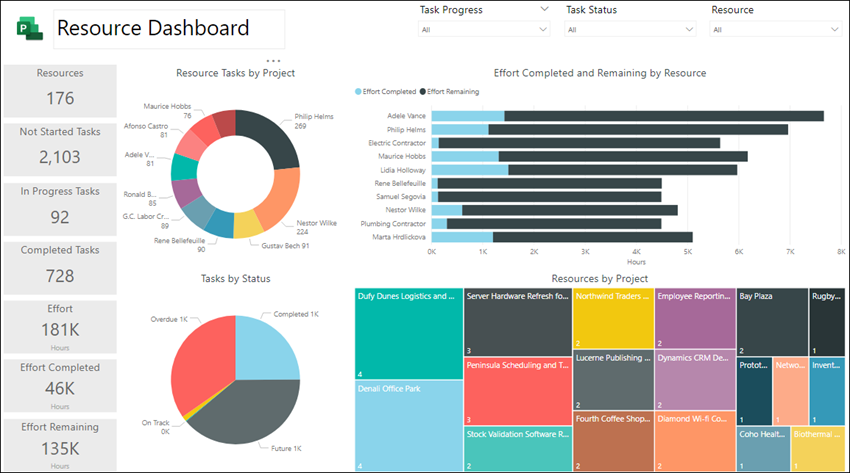
Resource Assignments
With this report, you can see task and project data for each of your project resources, including start and finish times, effort completed, effort remaining, and total effort hours. You can also see effort hours sorted by resource and by project, and compare the effort completed and effort remaining for each project manager.
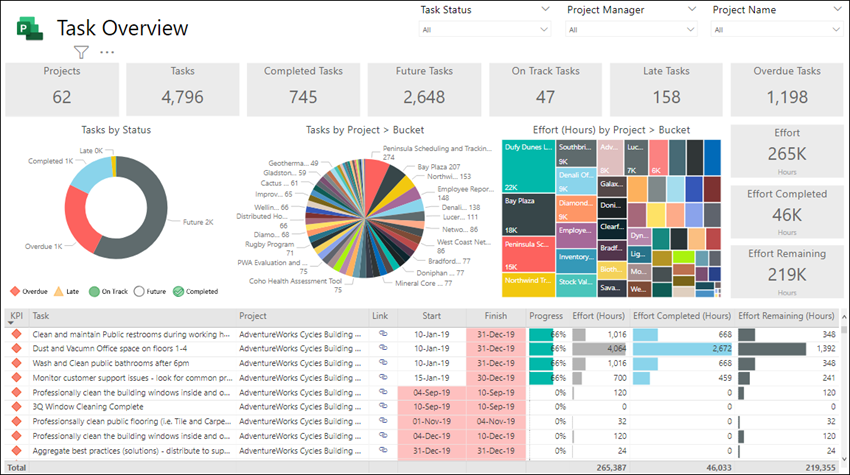
Task Overview
This report shows you task details across projects. You can apply filters to get specific reports, for current, completed, and future projects. You can compare task by status, tasks by project, remaining effort hours for each project. See what's on track, what's late, and which tasks are overdue.
Project Timeline
The Project Timeline shows each project with details about its tasks. Create the reports you need when you sort by task status, project manager, and project name.

My Work
Using this report, individual team members can see a detailed task list of all their own work across projects and get visibility into other team members' work.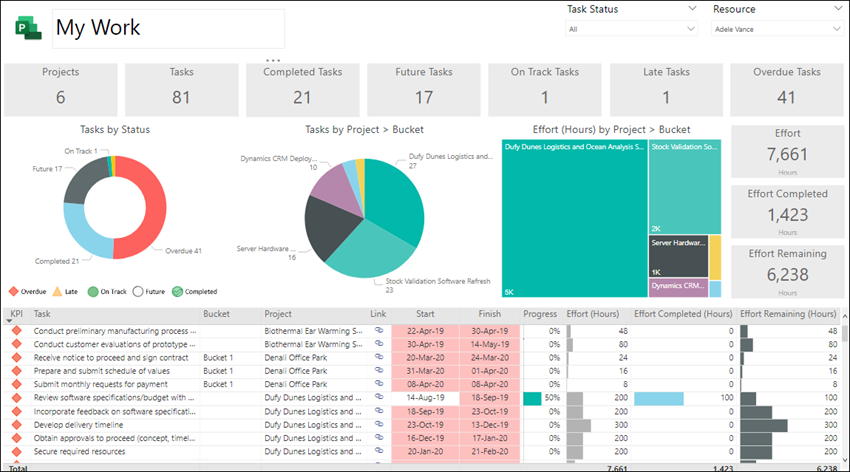
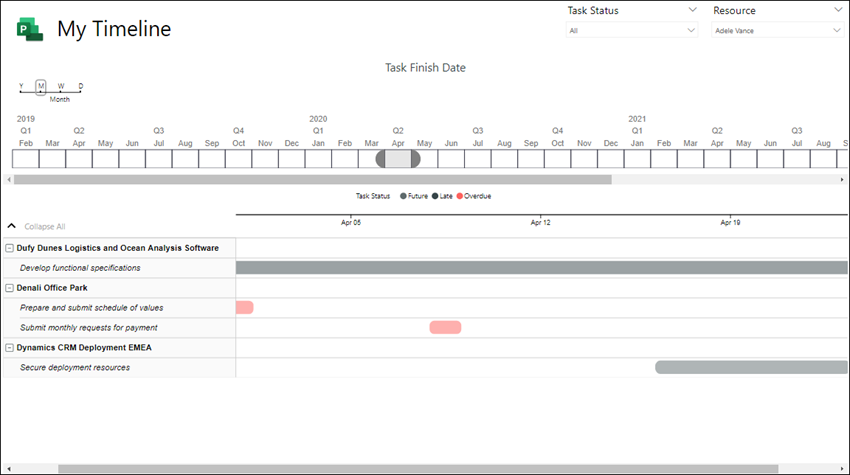
My Timeline
This lets each team member see their personal timeline of work across all projects, and within each project.
See also
Compose HTTP requests and handle errors
Connect to Project Web App with Power BI
Connect to Project Online data through Power BI Desktop


