Hybrid workforce experience dashboard
Important
This article is for the legacy Workplace Analytics app and does not reflect functionality available on the updated Viva Insights platform. Access current documentation for Viva Insights advanced insights here: advanced insights documentation.
Introduction
As leaders figure out their organization’s new working models, the Hybrid workforce experience Power BI dashboard helps them understand how hybrid work affects employees differently. The dashboard identifies opportunities to improve the experience of employees working in the following ways:
- Mostly onsite
- Mostly remote
- Onsite some days of the week and remote on others (hybrid)
This dashboard has six sections, which each address different facets of the employee experience that hybrid working models may impact. Key metrics provide a deep-dive into each topic, along with a Why it matters interpretation and recommended actions.
Interactive demonstration
Video walk-through
Prerequisites
Before you can run queries and populate the dashboard in Power BI, make sure you:
Are assigned the role of Analyst for Viva Insights
Have installed the latest version of Power BI Desktop
- Have the June 2022 or newer version of Power BI Desktop installed. If you have an earlier version of Power BI installed, uninstall it before installing the new version. Then go to Get Power BI Desktop to download and install the latest version.
Have the following attributes uploaded as part of your organizational data:
- OnsiteDays, an attribute identifying the number of days someone works onsite. This could be based on behavioral data such as badge data or Wi-Fi data, or other sources such as a tag in the HR system identifying the number of days an employee intends to work onsite. You might get this data in one of two ways—through a weekly update of onsite days or by using a monthly update of onsite days to calculate the weekly number:
- If an employee’s number of onsite days is available on a weekly basis (that is, values are between 0 and 5), make sure to include a row with an EffectiveDate and OnsiteDays value per person per week in your organizational data. You can choose the frequency with which you like to update this data—weekly or monthly.
- If you’re using an employee’s number of onsite days per month, you can upload the monthly number of onsite days in Viva Insights on a monthly basis.
- SupervisorIndicator, an attribute indicating whether someone is a manager.
- HireDate, an attribute indicating the person’s hire date is required to be able to load the New hire onboarding insights. Without this attribute, however, the rest of the report will still load.
- OnsiteDays, an attribute identifying the number of days someone works onsite. This could be based on behavioral data such as badge data or Wi-Fi data, or other sources such as a tag in the HR system identifying the number of days an employee intends to work onsite. You might get this data in one of two ways—through a weekly update of onsite days or by using a monthly update of onsite days to calculate the weekly number:
For further details on Organizational data preparation and upload, download our step-by-step guide.
You can add new attributes to your organizational data at any time. For more details on how to add new data for existing employees, review the documentation on subsequent uploads.
Set up the template
Note
This dashboard is currently only available in English and only works with data generated from the English version of the app. Before completing the following steps, confirm that the browser language contains en-us in the app's URL ("...office.com/en-us/...").
In the app(if that link doesn't work, try this link instead), select Analyze > Query designer.
In Create > Other templates, select Hybrid workforce experience, which takes you to required setup steps.
Screenshot that shows the "Other templates" window within Query designer. On the left-hand pane, "Query designer" is highlighted beneath "Analyze." Beneath "Other templates," there are nine templates presented as cards. The last template card, "Hybrid workforce experience," is highlighted.
In the second setup step, select Set up next to Hybrid workforce experience (if repeating this process per step 8 below, select Strong and diverse ties).
When prompted, select or confirm the options for Group by, Time period, and Meeting exclusions.
In Select metrics, keep the preselected metrics (these are required for the template to work).
In Select filters, select Active only for Which measured employees do you want to include in your query results? Optionally, you can further filter the employees in scope for the dashboard. For more details about filter and metric options, refer to Create a Person Query.
In Organizational data, add the attribute that specifies someone’s number of onsite work days (for example, OnsiteDays), the attribute that indicates whether someone is a manager (for example, SupervisorIndicator), and the HireDate. Add any other attributes you want to be able to use in the dashboard. For best performance, select no more than seven attributes.
Select Run (located in the upper right) to run the query, which can take between a few minutes and a few hours to complete.
When prompted, select to return to the Query designer. Repeat preceding steps 2-7, except this time, select the Strong and diverse ties query. Make the same selections that you did for the Hybrid workforce experience. Skip step 6; there's no need to include any organizational attributes in this Strong and diverse ties query.
When prompted, select to go to Results. After both queries successfully run, navigate to Query designer > Results. Select the download icon for the Hybrid workforce experience query results, select PBI template, and then select OK to download the template.
.png)
Open the downloaded Hybrid workforce experience template.
If prompted to select a program, select Power BI.
When prompted by Power BI:
- In Query designer > Results, select the link icon for each query, and select to copy the generated OData URL link.
- In Power BI, paste each copied link into its respective URL field.
- Map the attribute in your organizational data that specifies the number of days someone works onsite (for example, OnsiteDays).
- Map the attribute that identifies whether someone is a manager (for example, SupervisorIndicator).
- Map the HireDate attribute (if available).
- Set the Minimum group size for data aggregation within this dashboard's visualizations in accordance with your company's policy for viewing data.
- Select Load to import the query results into Power BI. Loading these large files might take between a few minutes and a few hours to complete.
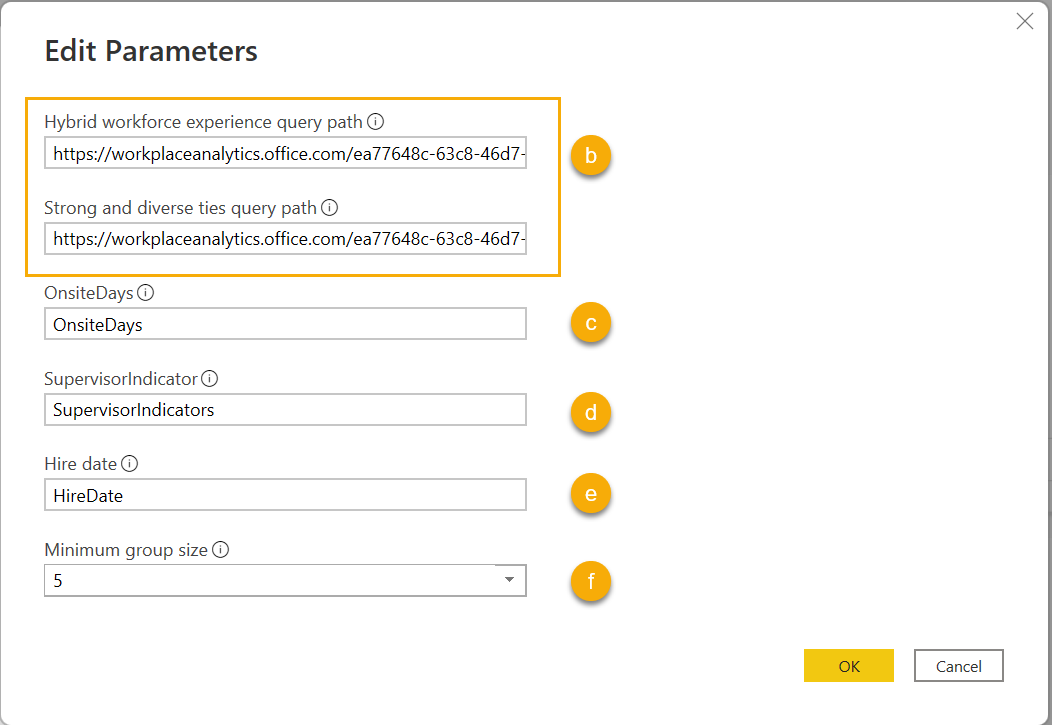
Screenshot that shows the "Edit Parameters" window within Power BI. Each part of the image is labeled with the sub-step above to which it corresponds, "b" - "f". The first two sections, "Hybrid workforce experience query path" and "Strong and diverse ties query path," are highlighted and labeled "b." Beneath each section header is an editable field that contains a file path. The next field is titled, "OnsiteDays," has a "c" label to its right, and its editable field contains the text, "OnsiteDays." The next field is titled, "SupervisorIndicator," has a "d" label to its right, and its editable field contains the text, "SupervisorIndicators." The second-to-last field is titled, "Hire date," has an "e" label to its right, and its editable field contains the text, "HireDate." The last field is titled, "Minimum group size," has an "f" label to its right, and its editable field contains "5" selected from a dropdown menu.
If you're already signed in to Power BI with your organizational account, the dashboard visualizations will populate with your data. At this point, you’ve completed the setup process and can skip to Customize the dashboard.
If you're not signed into Power BI, or if an error occurs when updating the data, sign in to your organizational account again. In the OData feed dialog box, select Organizational account, and then select Sign in. See Troubleshooting for more details.
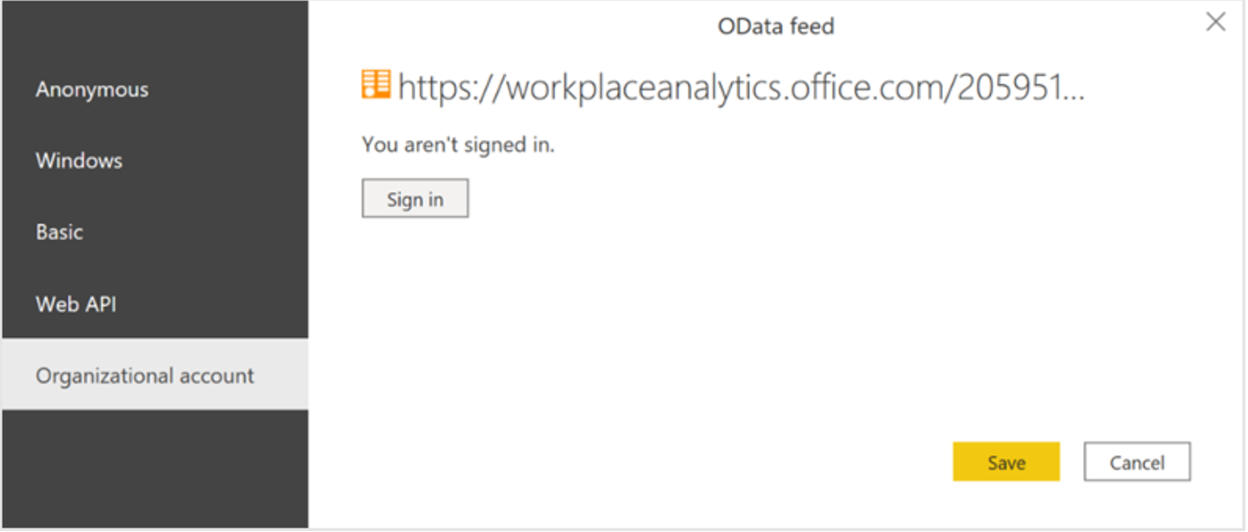
Screenshot that shows a pop-up window in Power BI, titled "OData feed." There is square icon beneath the window title; a URL to its right reads, "https://workplaceanalytics.office.com/205951...". In smaller font, a note underneath the URL reads, "You aren't signed in." Beneath the note, there is a Sign-in button. The left-hand sidebar contains five section titles arranged vertically; "Organizational account" is selected. Save and Cancel buttons are in the bottom right of the window.
Select and enter credentials for the organizational account that you use to sign in to the app, and then select Save.
Important
You'll need to sign in to Power BI with the same account you use to access the advanced insights app.
Select Connect to prepare and load the data, which can take a few minutes to complete. After the data loads, charts appear in Power BI with insights about the hybrid workforce’s experience.
Customize the dashboard
After the Workforce experience dashboard is set up and populated with Viva Insights data in Power BI, you’re prompted to map the following attribute values:
Mostly onsite – Select the number of onsite days that define the work mode of employees that work mostly onsite (that is, from the company’s main worksite).
Hybrid – Select the number of onsite days that define the work mode of employees that work onsite some days during the week and remote on others.
Mostly remote – Select the number of onsite days that define the work mode of employees that work mostly remote (that is, from home or some other location outside the company’s main worksite).
Individual contributor – Select the attribute values that identify employees as individual contributors who do not manage people within your organization.
Manager indicator – Select the attribute values that identify managers who manage people within your organization, like Mgr and Mgr+.
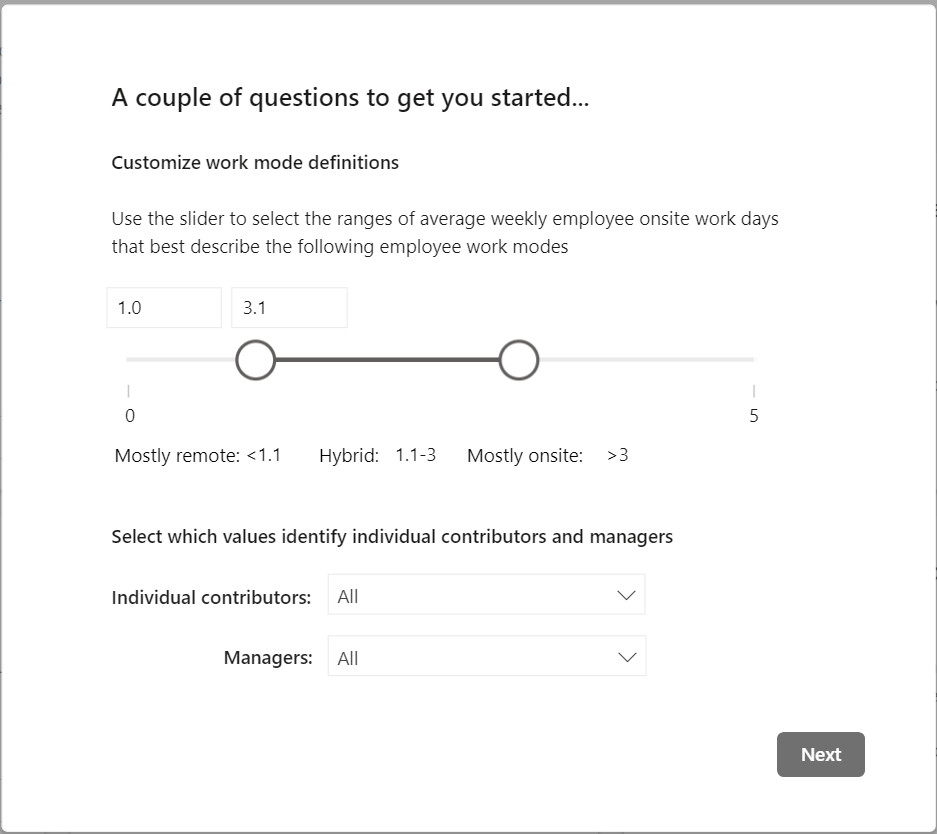
Screenshot that shows a pop-up window in Power BI, titled "A couple of questions to get you started..." There are two sections; the first section is titled, "Customize work mode definitions" and the second section is titled, "Select which values identify individual contributor and managers. In the first section, there is a slider with values 0 and 5. Beneath those values are a "Mostly remote: <1.1" label to the left, a "Hybrid: 1.1-3" label in the middle, and a "Mostly onsite: >3" label on the right. The slider is between "Mostly remote" and "Mostly onsite"; a value on its left is "3.1." In the second section, there are two fields, and each also contain a dropdown menu to their right: "Individual contributors," which shows "All" in the dropdown menu, and "Managers," which also shows "All" in the dropdown menu.
After this initial prompt, you can then select Settings in the upper right of any page to adjust the work mode mappings and view and change the following attribute values:
- Select the time period for the dashboard – Select the time period for which you want to view data in the dashboard.
- Select an attribute to group data by – Select the primary group-by attribute shown in all the report pages. You can change this attribute at any time and all reportages will show group values by the new attribute.
- Select optional report filter – Select the organizational attribute and values by which you want to filter employees in the dashboard.
- Exclusions – Use the check boxes to:
- Exclude employees who are likely non-knowledge workers (that is, those spending less than five hours per week in meetings, emails, and/or Teams calls and chats).
- Exclude weeks that are likely holiday weeks.
To adjust the individual contributors and managers mappings, navigate to View > Bookmarks in the ribbon. Underneath Summary page, select Intro_ON to reopen the initial prompt.
Power BI tips, troubleshooting, and FAQs
For details about how to share the dashboard and other Power BI tips, troubleshoot any issues, or review the FAQ, refer to Power BI tips, FAQ, and troubleshooting.