지도에 선 계층 추가(Android SDK)
참고 항목
Azure Maps Android SDK 사용 중지
이제 Android용 Azure Maps 네이티브 SDK는 더 이상 사용되지 않으며 2025년 3월 31일에 사용 중지됩니다. 서비스 중단을 방지하려면 2025년 3월 31일까지 Azure Maps 웹 SDK로 마이그레이션합니다. 자세한 내용은 Azure Maps Android SDK 마이그레이션 가이드를 참조하세요.
선 계층은 맵에서 LineString 및 MultiLineString 피처를 경로로 렌더링하는 데 사용할 수 있습니다. 선 계층을 사용하여 Polygon 및 MultiPolygon 기능의 개요를 렌더링할 수도 있습니다. 데이터 원본은 선 계층에 연결되어 렌더링할 데이터를 제공합니다.
팁
기본적으로 선 계층은 다각형의 좌표와 데이터 원본의 선을 렌더링합니다. LineString 지오메트리 기능만 렌더링하도록 계층을 제한하려면 계층의 filter 옵션을 eq(geometryType(), "LineString")로 설정합니다. MultiLineString 기능도 포함하려면 계층의 filter 옵션을 any(eq(geometryType(), "LineString"), eq(geometryType(), "MultiLineString"))(으)로 설정합니다.
필수 조건
빠른 시작: Android 앱 만들기 문서의 단계를 완료해야 합니다. 이 문서의 코드 블록은 맵 onReady 이벤트 처리기에 삽입할 수 있습니다.
선 계층 추가
다음 코드는 선을 만드는 방법을 보여 줍니다. 데이터 원본에 선을 추가한 다음 LineLayer 클래스를 사용하여 선 계층으로 렌더링합니다.
//Create a data source and add it to the map.
DataSource source = new DataSource();
map.sources.add(source);

//Create a list of points.
List<Point> points = Arrays.asList(
    Point.fromLngLat(-73.97234, 40.74327),
    Point.fromLngLat(-74.00442, 40.75680));

//Create a LineString geometry and add it to the data source.
source.add(LineString.fromLngLats(points));

//Create a line layer and add it to the map.
LineLayer layer = new LineLayer(source,
    strokeColor("blue"),
    strokeWidth(5f)
);

map.layers.add(layer);
//Create a data source and add it to the map.
val source = DataSource()
map.sources.add(source)

//Create a list of points.
val points = asList(
    Point.fromLngLat(-73.97234, 40.74327),
    Point.fromLngLat(-74.00442, 40.75680)
)

//Create a LineString geometry and add it to the data source.
source.add(LineString.fromLngLats(points))

//Create a line layer and add it to the map.
val layer = LineLayer(
    source,
    strokeColor("blue"),
    strokeWidth(5f)
)

map.layers.add(layer)
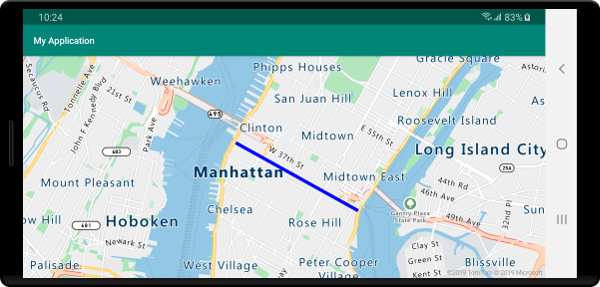
다음 스크린샷은 선 계층에서 선을 렌더링하는 위의 코드를 보여 줍니다.
데이터 기반 선 스타일
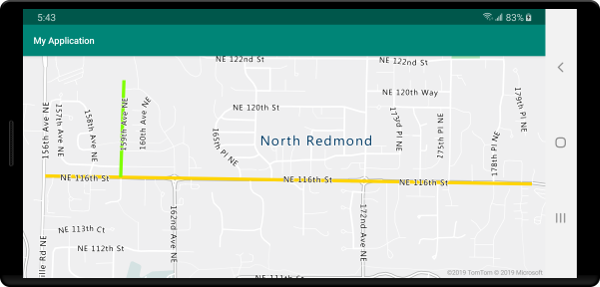
다음 코드는 두 선 기능을 만들고 속도 제한 값을 각 선에 속성으로 추가합니다. 선 계층은 속도 제한 값에 따라 선의 데이터 기반 스타일 식 색을 사용합니다. 선 데이터가 도로를 따라 오버레이되므로 다음 코드는 도로 레이블을 명확하게 읽을 수 있도록 레이블 계층 아래에 선 계층을 추가합니다.
//Create a data source and add it to the map.
DataSource source = new DataSource();
map.sources.add(source);

//Create a line feature.
Feature feature = Feature.fromGeometry(
    LineString.fromLngLats(Arrays.asList(
        Point.fromLngLat(-122.131821, 47.704033),
        Point.fromLngLat(-122.099919, 47.703678))));

//Add a property to the feature.
feature.addNumberProperty("speedLimitMph", 35);

//Add the feature to the data source.
source.add(feature);

//Create a second line feature.
Feature feature2 = Feature.fromGeometry(
    LineString.fromLngLats(Arrays.asList(
        Point.fromLngLat(-122.126662, 47.708265),
        Point.fromLngLat(-122.126877, 47.703980))));

//Add a property to the second feature.
feature2.addNumberProperty("speedLimitMph", 15);

//Add the second feature to the data source.
source.add(feature2);

//Create a line layer and add it to the map.
LineLayer layer = new LineLayer(source,
    strokeColor(
        interpolate(
            linear(),
            get("speedLimitMph"),
            stop(0, color(Color.GREEN)),
            stop(30, color(Color.YELLOW)),
            stop(60, color(Color.RED))
        )
    ),
    strokeWidth(5f)
);

map.layers.add(layer, "labels");
//Create a data source and add it to the map.
val source = DataSource()
map.sources.add(source)

//Create a line feature.
val feature = Feature.fromGeometry(
    LineString.fromLngLats(
        Arrays.asList(
            Point.fromLngLat(-122.131821, 47.704033),
            Point.fromLngLat(-122.099919, 47.703678)
        )
    )
)

//Add a property to the feature.
feature.addNumberProperty("speedLimitMph", 35)

//Add the feature to the data source.
source.add(feature)

//Create a second line feature.
val feature2 = Feature.fromGeometry(
    LineString.fromLngLats(
        Arrays.asList(
            Point.fromLngLat(-122.126662, 47.708265),
            Point.fromLngLat(-122.126877, 47.703980)
        )
    )
)

//Add a property to the second feature.
feature2.addNumberProperty("speedLimitMph", 15)

//Add the second feature to the data source.
source.add(feature2)

//Create a line layer and add it to the map.
val layer = LineLayer(
    source,
    strokeColor(
        interpolate(
            linear(),
            get("speedLimitMph"),
            stop(0, color(Color.GREEN)),
            stop(30, color(Color.YELLOW)),
            stop(60, color(Color.RED))
        )
    ),
    strokeWidth(5f)
)

map.layers.add(layer, "labels")
다음 스크린샷은 선 기능의 속성을 기반으로 데이터 기반 스타일 식에서 해당 색이 검색된 선 계층의 두 선을 렌더링하는 위의 코드를 보여 줍니다.
선에 스트로크 그라데이션 추가
선에 단일 스트로크 색을 적용할 수 있습니다. 색 그라데이션으로 선을 채워서 한 선분에서 다음 선분으로의 전환을 표시할 수도 있습니다. 예를 들어 선 그라데이션을 사용하여 시간 및 거리에 따른 변경이나 연결된 개체 선의 다른 온도를 나타낼 수 있습니다. 이 기능을 선에 적용하려면 데이터 원본에 lineMetrics 옵션이 true(으)로 설정된 다음 색 그라데이션 식을 선의 strokeColor 옵션에 전달할 수 있어야 합니다. 스트로크 그라데이션 식은 계산된 선 메트릭을 식에 노출하는 lineProgress 데이터 식을 참조해야 합니다.
//Create a data source and add it to the map.
DataSource source = new DataSource(
    //Enable line metrics on the data source. This is needed to enable support for strokeGradient.
    withLineMetrics(true)
);
map.sources.add(source);

//Create a line and add it to the data source.
source.add(LineString.fromLngLats(
    Arrays.asList(
        Point.fromLngLat(-122.18822, 47.63208),
        Point.fromLngLat(-122.18204, 47.63196),
        Point.fromLngLat(-122.17243, 47.62976),
        Point.fromLngLat(-122.16419, 47.63023),
        Point.fromLngLat(-122.15852, 47.62942),
        Point.fromLngLat(-122.15183, 47.62988),
        Point.fromLngLat(-122.14256, 47.63451),
        Point.fromLngLat(-122.13483, 47.64041),
        Point.fromLngLat(-122.13466, 47.64422),
        Point.fromLngLat(-122.13844, 47.65440),
        Point.fromLngLat(-122.13277, 47.66515),
        Point.fromLngLat(-122.12779, 47.66712),
        Point.fromLngLat(-122.11595, 47.66712),
        Point.fromLngLat(-122.11063, 47.66735),
        Point.fromLngLat(-122.10668, 47.67035),
        Point.fromLngLat(-122.10565, 47.67498)
    )
));

//Create a line layer and pass in a gradient expression for the strokeGradient property.
map.layers.add(new LineLayer(source,
    strokeWidth(6f),

    //Pass an interpolate or step expression that represents a gradient.
    strokeGradient(
        interpolate(
            linear(),
            lineProgress(),
            stop(0, color(Color.BLUE)),
            stop(0.1, color(Color.argb(255, 65, 105, 225))), //Royal Blue
            stop(0.3, color(Color.CYAN)),
            stop(0.5, color(Color.argb(255,0, 255, 0))), //Lime
            stop(0.7, color(Color.YELLOW)),
            stop(1, color(Color.RED))
        )
    )
));
//Create a data source and add it to the map.
val source = DataSource(
    //Enable line metrics on the data source. This is needed to enable support for strokeGradient.
    withLineMetrics(true)
)
map.sources.add(source)

//Create a line and add it to the data source.
source.add(
    LineString.fromLngLats(
        Arrays.asList(
            Point.fromLngLat(-122.18822, 47.63208),
            Point.fromLngLat(-122.18204, 47.63196),
            Point.fromLngLat(-122.17243, 47.62976),
            Point.fromLngLat(-122.16419, 47.63023),
            Point.fromLngLat(-122.15852, 47.62942),
            Point.fromLngLat(-122.15183, 47.62988),
            Point.fromLngLat(-122.14256, 47.63451),
            Point.fromLngLat(-122.13483, 47.64041),
            Point.fromLngLat(-122.13466, 47.64422),
            Point.fromLngLat(-122.13844, 47.65440),
            Point.fromLngLat(-122.13277, 47.66515),
            Point.fromLngLat(-122.12779, 47.66712),
            Point.fromLngLat(-122.11595, 47.66712),
            Point.fromLngLat(-122.11063, 47.66735),
            Point.fromLngLat(-122.10668, 47.67035),
            Point.fromLngLat(-122.10565, 47.67498)
        )
    )
)

//Create a line layer and pass in a gradient expression for the strokeGradient property.
map.layers.add(
    LineLayer(
        source,
        strokeWidth(6f),

        //Pass an interpolate or step expression that represents a gradient.
        strokeGradient(
            interpolate(
                linear(),
                lineProgress(),
                stop(0, color(Color.BLUE)),
                stop(0.1, color(Color.argb(255, 65, 105, 225))),  //Royal Blue
                stop(0.3, color(Color.CYAN)),
                stop(0.5, color(Color.argb(255, 0, 255, 0))),  //Lime
                stop(0.7, color(Color.YELLOW)),
                stop(1, color(Color.RED))
            )
        )
    )
)
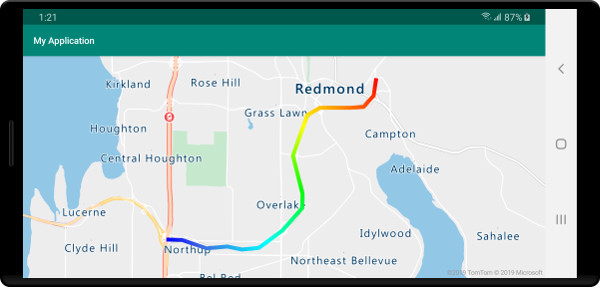
다음 스크린샷은 그라데이션 스트로크 색을 사용하여 렌더링된 선을 표시하는 위의 코드를 보여줍니다.
선을 따라 기호 추가
이 샘플에서는 맵의 선을 따라 화살표 아이콘을 추가하는 방법을 보여 줍니다. 기호 계층을 사용하는 경우 symbolPlacement 옵션을 SymbolPlacement.LINE(으)로 설정합니다. 이 옵션은 선을 따라 기호를 렌더링하고 아이콘(0도 = 오른쪽)을 회전합니다.
//Create a data source and add it to the map.
DataSource source = new DataSource();
map.sources.add(source);

//Load a image of an arrow into the map image sprite and call it "arrow-icon".
map.images.add("arrow-icon", R.drawable.purple_arrow_right);

//Create and add a line to the data source.
source.add(LineString.fromLngLats(Arrays.asList(
    Point.fromLngLat(-122.18822, 47.63208),
    Point.fromLngLat(-122.18204, 47.63196),
    Point.fromLngLat(-122.17243, 47.62976),
    Point.fromLngLat(-122.16419, 47.63023),
    Point.fromLngLat(-122.15852, 47.62942),
    Point.fromLngLat(-122.15183, 47.62988),
    Point.fromLngLat(-122.14256, 47.63451),
    Point.fromLngLat(-122.13483, 47.64041),
    Point.fromLngLat(-122.13466, 47.64422),
    Point.fromLngLat(-122.13844, 47.65440),
    Point.fromLngLat(-122.13277, 47.66515),
    Point.fromLngLat(-122.12779, 47.66712),
    Point.fromLngLat(-122.11595, 47.66712),
    Point.fromLngLat(-122.11063, 47.66735),
    Point.fromLngLat(-122.10668, 47.67035),
    Point.fromLngLat(-122.10565, 47.67498)))
);

//Create a line layer and add it to the map.
map.layers.add(new LineLayer(source,
    strokeColor("DarkOrchid"),
    strokeWidth(5f)
));

//Create a symbol layer and add it to the map.
map.layers.add(new SymbolLayer(source,
    //Space symbols out along line.
    symbolPlacement(SymbolPlacement.LINE),

    //Spread the symbols out 100 pixels apart.
    symbolSpacing(100f),

    //Use the arrow icon as the symbol.
    iconImage("arrow-icon"),

    //Allow icons to overlap so that they aren't hidden if they collide with other map elements.
    iconAllowOverlap(true),

    //Center the symbol icon.
    iconAnchor(AnchorType.CENTER),

    //Scale the icon size.
    iconSize(0.8f)
));
//Create a data source and add it to the map.
val source = DataSource()
map.sources.add(source)

//Load a image of an arrow into the map image sprite and call it "arrow-icon".
map.images.add("arrow-icon", R.drawable.purple_arrow_right)

//Create and add a line to the data source.
//Create and add a line to the data source.
source.add(
    LineString.fromLngLats(
        Arrays.asList(
            Point.fromLngLat(-122.18822, 47.63208),
            Point.fromLngLat(-122.18204, 47.63196),
            Point.fromLngLat(-122.17243, 47.62976),
            Point.fromLngLat(-122.16419, 47.63023),
            Point.fromLngLat(-122.15852, 47.62942),
            Point.fromLngLat(-122.15183, 47.62988),
            Point.fromLngLat(-122.14256, 47.63451),
            Point.fromLngLat(-122.13483, 47.64041),
            Point.fromLngLat(-122.13466, 47.64422),
            Point.fromLngLat(-122.13844, 47.65440),
            Point.fromLngLat(-122.13277, 47.66515),
            Point.fromLngLat(-122.12779, 47.66712),
            Point.fromLngLat(-122.11595, 47.66712),
            Point.fromLngLat(-122.11063, 47.66735),
            Point.fromLngLat(-122.10668, 47.67035),
            Point.fromLngLat(-122.10565, 47.67498)
        )
    )
)

//Create a line layer and add it to the map.
map.layers.add(
    LineLayer(
        source,
        strokeColor("DarkOrchid"),
        strokeWidth(5f)
    )
)

//Create a symbol layer and add it to the map.
map.layers.add(
    SymbolLayer(
        source,  //Space symbols out along line.
        symbolPlacement(SymbolPlacement.LINE),  //Spread the symbols out 100 pixels apart.
        symbolSpacing(100f),  //Use the arrow icon as the symbol.
        iconImage("arrow-icon"),  //Allow icons to overlap so that they aren't hidden if they collide with other map elements.
        iconAllowOverlap(true),  //Center the symbol icon.
        iconAnchor(AnchorType.CENTER),  //Scale the icon size.
        iconSize(0.8f)
    )
)
이 샘플의 경우 다음 이미지가 앱의 그리기 가능한 폴더에 로드되었습니다.
purple-arrow-right.png |
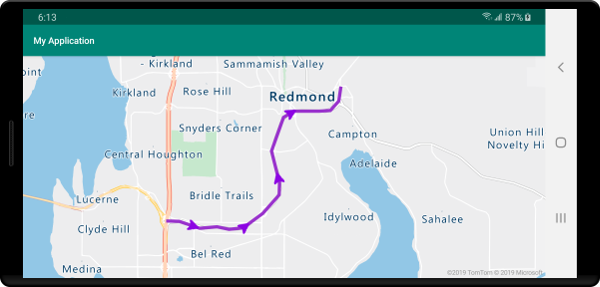
다음 스크린샷은 화살표 아이콘이 표시된 줄을 표시하는 위의 코드를 보여 줍니다.
다음 단계
맵에 추가할 더 많은 코드 예제를 보려면 다음 문서를 참조하세요.