자습서: Azure Maps를 사용하여 매장 로케이터 만들기
이 자습서에서는 Azure Maps를 사용하여 간단한 매장 로케이터를 만드는 과정을 안내합니다.
이 자습서에서는 다음 작업을 수행하는 방법을 알아봅니다.
- Azure Map Control API를 사용하여 새 웹 페이지를 만듭니다.
- 파일에서 사용자 지정 데이터를 로드하고 지도에 표시합니다.
- Azure Maps Search 서비스를 사용하여 주소를 찾거나 쿼리를 입력합니다.
- 브라우저에서 사용자의 위치를 가져온 후 지도에 표시합니다.
- 여러 계층을 조합하여 지도에 사용자 지정 기호를 만듭니다.
- 데이터 요소를 클러스터로 묶습니다.
- 지도에 확대/축소 컨트롤을 추가합니다.
필수 조건
- 이 자습서에서는 Visual Studio Code를 사용하는 것이 좋지만 적합한 IDE(통합 개발 환경)를 사용해도 됩니다.
- Azure Maps 계정
- 구독 키
참고 항목
Azure Maps의 인증에 대한 자세한 내용은 Azure Maps의 인증 관리를 참조하세요.
샘플 코드
이 자습서에서는 추가 기능으로 매장 로케이터를 확장하는 팁과 함께 Contoso Coffee라는 가상 회사에 대한 매장 로케이터를 만드는 방법을 설명합니다.
이 자습서에서 만들 항목의 라이브 샘플을 보려면 Azure Maps 코드 샘플 사이트에서 간단한 매장 로케이터를 참조하세요.
이 자습서를 좀 더 쉽게 수행하고 이에 참여하려면 다음 리소스를 다운로드하세요.
- 간단한 매장 로케이터 소스 코드
- 매장 로케이터 데이터 세트로 가져오는 데 사용되는 매장 위치 데이터
- 지도 이미지
매장 로케이터 기능
이 섹션에서는 이 자습서에서 만든 Contoso Coffee 매장 로케이터 애플리케이션에 설명된 Azure Maps 기능을 나열합니다.
사용자 인터페이스 기능
- 헤더의 매장 로고
- 이동 및 확대/축소를 지원하는 지도
- 사용자의 현재 위치를 검색하는 내 위치 단추
- 디바이스 화면의 너비에 따라 조정되는 페이지 레이아웃
- 검색 상자 및 검색 단추
기능 특징
- 사용자가 Enter 키를 누르면 검색 상자에 추가된
keypress이벤트가 트리거됩니다. - 지도를 이동하면 지도의 중심에서 각 위치까지의 거리가 다시 계산됩니다. 결과 목록이 업데이트되면 지도 위쪽에 가장 가까운 위치가 표시됩니다.
- 사용자가 결과 목록에서 결과를 선택하면 지도의 중심이 선택한 위치에 맞추어지며, 해당 위치에 대한 정보가 팝업 창에 표시됩니다.
- 사용자가 특정 위치를 선택하면 지도에서 팝업 창을 트리거합니다.
- 사용자가 축소하면 위치가 클러스터로 그룹화됩니다. 각 클러스터는 내부에 숫자가 있는 원으로 표시됩니다. 사용자가 확대/축소 수준을 변경하면 클러스터가 형성되고 분리됩니다.
- 클러스터를 선택하면 지도에서 두 수준이 확대되고 클러스터 위치가 중심이 됩니다.
매장 로케이터 디자인
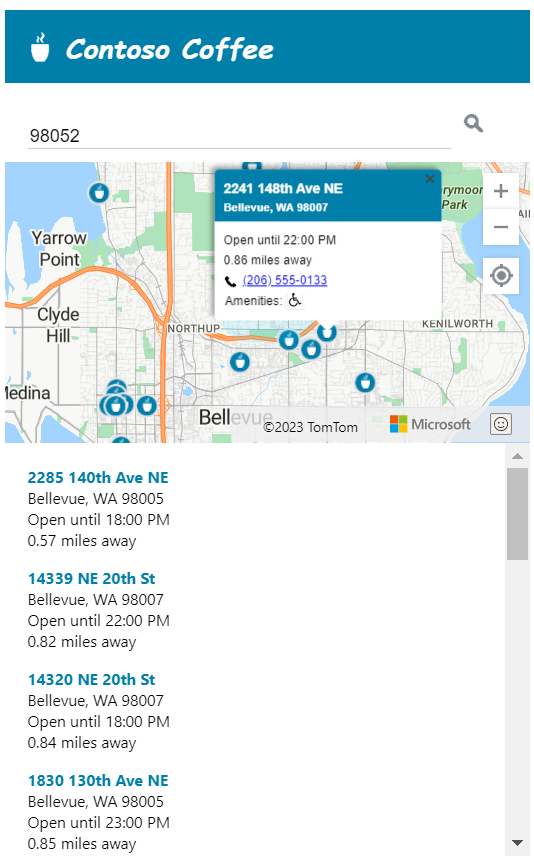
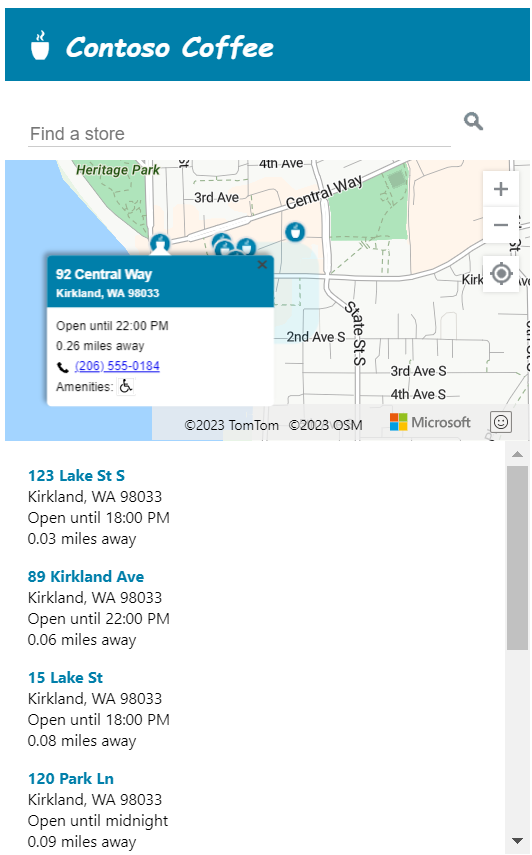
다음 스크린샷은 Contoso Coffee 매장 로케이터 애플리케이션의 일반 레이아웃을 보여줍니다. 라이브 샘플을 보고 상호 작용하려면 Azure Maps 코드 샘플 사이트에서 간단한 매장 로케이터 샘플 애플리케이션을 참조하세요.

이 매장 로케이터의 유용성을 최대화하기 위해 사용자의 화면 너비가 700픽셀보다 작은 경우 조정되는 반응형 레이아웃을 포함합니다. 반응형 레이아웃이 있으면 모바일 디바이스와 같은 작은 화면에서 매장 로케이터를 쉽게 사용할 수 있습니다. 다음은 작은 화면 레이아웃의 샘플을 보여주는 스크린샷입니다.
매장 위치 데이터 세트 만들기
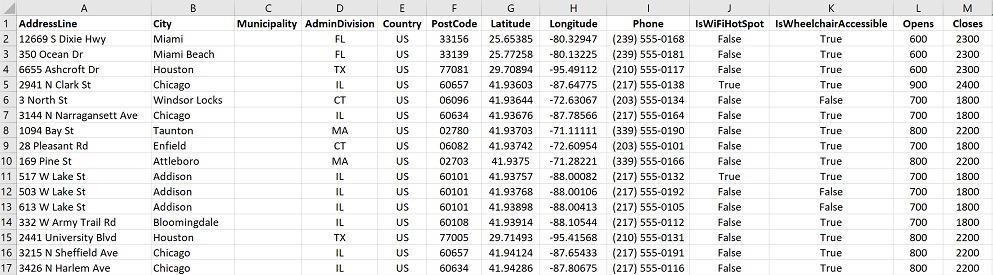
이 섹션에서는 지도에 표시하려는 매장의 데이터 세트를 만드는 방법에 대해 설명합니다. Contoso Coffee 로케이터에 대한 데이터 세트는 Excel 통합 문서 내에 만들어집니다. 데이터 세트에는 미국, 캐나다, 영국, 프랑스, 독일, 이탈리아, 네덜란드, 덴마크 및 스페인의 9개 국가/지역에 분산되어 있는 10,213개의 Contoso Coffee 커피숍 위치가 포함되어 있습니다. 다음은 이러한 데이터를 보여 주는 스크린샷입니다.
GitHub에 있는 Azure Maps 코드 샘플 리포지터리의 데이터 폴더에서 Contoso Coffee 로케이터 샘플 애플리케이션의 전체 데이터 세트가 포함된 Excel 파일을 다운로드합니다.
위의 데이터 스크린샷에서 다음을 확인할 수 있습니다.
- 위치 정보는 AddressLine, City, Municipality(카운티), AdminDivision(주/도), PostCode(우편 번호), Country라는 6개 열에 저장됩니다.
- Latitude 및 Longitude 열에는 각 Contoso Coffee 위치의 좌표가 포함됩니다. 좌표 정보가 없는 경우 Search Service를 사용하여 위치 좌표를 확인할 수 있습니다.
- 일부 다른 열에는 커피숍과 관련된 메타데이터(전화 번호, 부울 열 및 24시간 형식의 매장 개점 및 폐점 시간)가 포함되어 있습니다. 부울 열은 Wi-Fi 핫스폿 및 휠체어 이용 가능성을 위한 것입니다. 위치 데이터와 관련성이 좀 더 깊은 메타데이터를 포함하는 고유한 열을 만들 수 있습니다.
참고 항목
Azure Maps는 구형 Mercator 프로젝션 "EPSG:3857"의 데이터를 렌더링하지만 WGS84 데이텀을 사용하는 "EPSG:4326"의 데이터를 읽습니다.
Contoso Coffee 매장 로케이터 데이터 세트 로드
Contoso Coffee 매장 로케이터 데이터 세트는 작아서 애플리케이션이 로드될 때 브라우저에서 다운로드하는 탭으로 구분된 텍스트 파일로 변환할 수 있습니다.
팁
데이터 세트가 클라이언트 다운로드에 비해 너무 크거나 자주 업데이트되는 경우 데이터 세트를 데이터베이스에 저장하는 것이 좋습니다. 데이터가 데이터베이스에 로드되면 데이터에 대한 쿼리를 수락하는 웹 서비스를 설정한 다음, 결과를 사용자의 브라우저에 보낼 수 있습니다.
데이터를 탭으로 구분된 텍스트 파일로 변환
Contoso Coffee 매장 위치 데이터를 Excel 통합 문서에서 탭으로 구분된 텍스트 파일로 변환하려면 다음을 수행합니다.
Excel 통합 문서 ContosoCoffee.xlsx를 다운로드하여 Excel에서 엽니다.
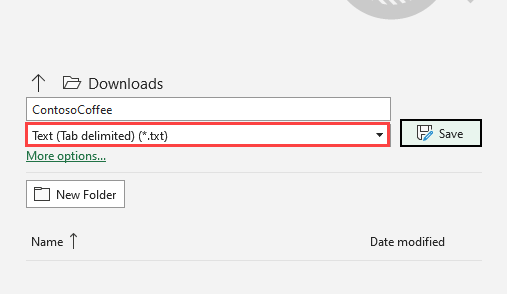
파일 > 다른 이름으로 저장...을 선택합니다.
저장 형식 드롭다운 목록에서 텍스트(탭 구분)(*.txt)를 선택합니다.
파일 이름을 ContosoCoffee로 지정합니다.
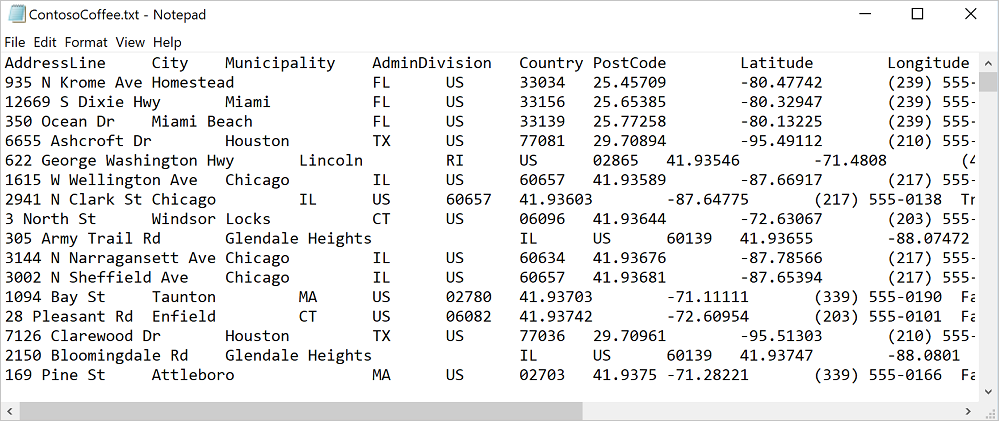
메모장에서 텍스트 파일을 열면 다음 텍스트와 비슷하게 표시됩니다.
프로젝트 설정
Visual Studio Code 또는 원하는 개발 환경을 엽니다.
파일 > 작업 영역 열기...를 선택합니다.
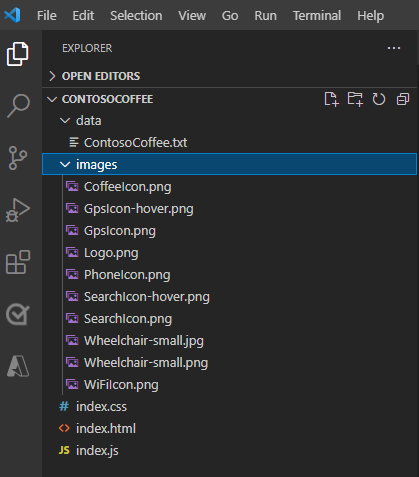
ContosoCoffee라는 새 폴더를 만듭니다.
탐색기에서 ContosoCoffee를 선택합니다.
애플리케이션에 대한 레이아웃, 스타일 및 논리를 정의하는 다음 세 개의 파일을 만듭니다.
- index.html
- index.css
- index.js
data라는 폴더를 만듭니다.
이전에 Excel 통합 문서 ContosoCoffee.xlsx에서 만든 ContosoCoffee.txt 파일을 data 폴더에 추가합니다.
images라는 다른 폴더를 만듭니다.
아직 다운로드하지 않았다면 GitHub 리포지토리의 images 디렉터리에서 10개의 지도 이미지를 다운로드하고 images 폴더에 추가합니다.
이제 작업 영역 폴더는 다음 스크린샷과 같습니다.
HTML 만들기
HTML을 만들려면 다음을 수행합니다.
다음
meta태그를 index.html의head에 추가합니다.<meta charset="utf-8"> <meta http-equiv="x-ua-compatible" content="IE=Edge"> <meta name="viewport" content="width=device-width, initial-scale=1, shrink-to-fit=no">Azure Maps 웹 컨트롤 JavaScript 및 CSS 파일에 대한 참조를 추가합니다.
<!-- Add references to the Azure Maps Map control JavaScript and CSS files. -->
<link rel="stylesheet" href="https://atlas.microsoft.com/sdk/javascript/mapcontrol/3/atlas.min.css" type="text/css">
<script src="https://atlas.microsoft.com/sdk/javascript/mapcontrol/3/atlas.min.js"></script>
다음으로 Azure Maps 서비스 모듈에 대한 참조를 추가합니다. 이 모듈은 Azure Maps REST 서비스를 래핑하여 JavaScript에서 쉽게 사용할 수 있도록 하는 JavaScript 라이브러리입니다. 서비스 모듈은 검색 기능을 강화하는 데 유용합니다.
<!-- Add a reference to the Azure Maps Services Module JavaScript file. -->
<script src="https://atlas.microsoft.com/sdk/javascript/service/2/atlas-service.min.js"></script>
index.js 및 index.css에 대한 참조를 추가합니다.
<!-- Add references to the store locator JavaScript and CSS files. -->
<link rel="stylesheet" href="index.css" type="text/css">
<script src="index.js"></script>
문서 본문에
header태그를 추가합니다.header태그 내부에 로고 및 회사 이름을 추가합니다.<header> <img src="images/Logo.png" /> <span>Contoso Coffee</span> </header>main태그를 추가하고, 텍스트 상자 및 검색 단추가 있는 검색 패널을 만듭니다. 또한 지도, 목록 패널 및 내 위치 GPS 단추에 대한div참조를 추가합니다.<main> <div class="searchPanel"> <div> <input id="searchTbx" type="search" placeholder="Find a store" /> <button id="searchBtn" title="Search"></button> </div> </div> <div id="listPanel"></div> <div id="myMap"></div> <button id="myLocationBtn" title="My Location"></button> </main>
완료되면 index.html이 자습서 샘플 코드에 Simple Store Locator.html과 같이 표시됩니다.
CSS 스타일 정의
다음 단계는 CSS 스타일을 정의하는 것입니다. CSS 스타일은 애플리케이션 구성 요소가 배치되는 방식과 애플리케이션 모양을 정의합니다.
index.css를 엽니다.
다음 css 코드를 추가합니다.
참고 항목
@media스타일은 화면 너비가 700픽셀보다 작을 때 사용할 대체 스타일 옵션을 정의합니다.html, body { padding: 0; margin: 0; font-family: Gotham, Helvetica, sans-serif; overflow-x: hidden; } header { width: calc(100vw - 10px); height: 30px; padding: 15px 0 20px 20px; font-size: 25px; font-style: italic; font-family: "Comic Sans MS", cursive, sans-serif; line-height: 30px; font-weight: bold; color: white; background-color: #007faa; } header span { vertical-align: middle; } header img { height: 30px; vertical-align: middle; } .searchPanel { position: relative; width: 350px; } .searchPanel div { padding: 20px; } .searchPanel input { width: calc(100% - 50px); font-size: 16px; border: 0; border-bottom: 1px solid #ccc; } #listPanel { position: absolute; top: 135px; left: 0px; width: 350px; height: calc(100vh - 135px); overflow-y: auto; } #myMap { position: absolute; top: 65px; left: 350px; width: calc(100vw - 350px); height: calc(100vh - 65px); } .statusMessage { margin: 10px; } #myLocationBtn, #searchBtn { margin: 0; padding: 0; border: none; border-collapse: collapse; width: 32px; height: 32px; text-align: center; cursor: pointer; line-height: 32px; background-repeat: no-repeat; background-size: 20px; background-position: center center; z-index: 200; } #myLocationBtn { position: absolute; top: 150px; right: 10px; box-shadow: 0px 0px 4px rgba(0,0,0,0.16); background-color: white; background-image: url("images/GpsIcon.png"); } #myLocationBtn:hover { background-image: url("images/GpsIcon-hover.png"); } #searchBtn { background-color: transparent; background-image: url("images/SearchIcon.png"); } #searchBtn:hover { background-image: url("images/SearchIcon-hover.png"); } .listItem { height: 50px; padding: 20px; font-size: 14px; } .listItem:hover { cursor: pointer; background-color: #f1f1f1; } .listItem-title { color: #007faa; font-weight: bold; } .storePopup { min-width: 150px; } .storePopup .popupTitle { border-top-left-radius: 4px; border-top-right-radius: 4px; padding: 8px; height: 30px; background-color: #007faa; color: white; font-weight: bold; } .storePopup .popupSubTitle { font-size: 10px; line-height: 12px; } .storePopup .popupContent { font-size: 11px; line-height: 18px; padding: 8px; } .storePopup img { vertical-align:middle; height: 12px; margin-right: 5px; } /* Adjust the layout of the page when the screen width is fewer than 700 pixels. */ @media screen and (max-width: 700px) { .searchPanel { width: 100vw; } #listPanel { top: 385px; width: 100%; height: calc(100vh - 385px); } #myMap { width: 100vw; height: 250px; top: 135px; left: 0px; } #myLocationBtn { top: 220px; } } .mapCenterIcon { display: block; width: 10px; height: 10px; border-radius: 50%; background: orange; border: 2px solid white; cursor: pointer; box-shadow: 0 0 0 rgba(0, 204, 255, 0.4); animation: pulse 3s infinite; } @keyframes pulse { 0% { box-shadow: 0 0 0 0 rgba(0, 204, 255, 0.4); } 70% { box-shadow: 0 0 0 50px rgba(0, 204, 255, 0); } 100% { box-shadow: 0 0 0 0 rgba(0, 204, 255, 0); } }
이때 애플리케이션을 실행하면 헤더, 검색 상자 및 검색 단추가 나타납니다. 그러나 지도는 아직 로드되지 않았으므로 표시되지 않습니다. 검색을 수행하려는 경우 아무 작업도 발생하지 않습니다. 다음 섹션에서는 매장 로케이터의 모든 기능에 액세스하는 데 필요한 JavaScript 논리 추가 방법을 설명합니다.
JavaScript 코드 추가
Contoso Coffee 매장 로케이터 앱의 JavaScript 코드를 사용하여 다음 프로세스를 수행할 수 있습니다.
페이지에서 로드 프로세스가 완료될 때까지 대기하는
ready라는 이벤트 수신기를 추가합니다. 페이지 로드가 완료되면 이벤트 처리기에서 지도 로드를 모니터링하고 기능을 검색 및 내 위치 단추에 제공하기 위해 더 많은 이벤트 수신기를 만듭니다.사용자가 검색 단추를 선택하거나 검색 상자에서 위치를 입력하고 Enter 키를 누르면 사용자의 쿼리에 대한 유사 항목 검색이 시작됩니다. 코드에서 국가/지역 ISO 2 값의 배열을
countrySet옵션에 전달하여 검색 결과를 해당 국가/지역으로 제한합니다. 검색할 국가/지역을 제한하면 반환되는 결과의 정확도를 높이는 데 도움이 됩니다.검색이 완료되면 첫 번째 위치 결과가 지도의 중심 초점으로 사용됩니다. 사용자가 [내 위치] 단추를 선택하면 코드에서 HTML5 지리적 위치 API를 사용하여 사용자의 위치를 검색합니다. 위치가 검색되면 코드가 사용자 위치 위에 지도의 중심을 배치합니다.
JavaScript를 추가하려면 다음을 수행합니다.
index.js를 엽니다.
설정을 보다 쉽게 업데이트할 수 있도록 하는 전역 옵션을 추가합니다. 지도, 팝업 창, 데이터 원본, 아이콘 계층 및 HTML 표식에 대한 변수를 정의합니다. 검색 영역의 중심을 나타내도록 HTML 표식을 설정합니다. 그리고 Azure Maps 검색 서비스 클라이언트의 인스턴스를 정의합니다.
//The maximum zoom level to cluster data point data on the map.
var maxClusterZoomLevel = 11;

//The URL to the store location data.
var storeLocationDataUrl = 'data/ContosoCoffee.txt';

//The URL to the icon image.
var iconImageUrl = 'images/CoffeeIcon.png';

//An array of country region ISO2 values to limit searches to.
var countrySet = ['US', 'CA', 'GB', 'FR','DE','IT','ES','NL','DK'];

//
var map, popup, datasource, iconLayer, centerMarker, searchURL;

// Used in function updateListItems
var listItemTemplate = '<div class="listItem" onclick="itemSelected(\'{id}\')"><div class="listItem-title">{title}</div>{city}<br />Open until {closes}<br />{distance} miles away</div>';
다음 초기화 코드를 추가합니다.
<Your Azure Maps Key>를 Azure Maps 구독 키로 바꿔야 합니다.팁
팝업 창을 사용할 경우 단일
Popup인스턴스를 만든 후 해당 콘텐츠 및 위치를 업데이트하여 인스턴스를 다시 사용하는 것이 좋습니다. 코드에 추가하는 모든Popup인스턴스에 대해 페이지에 여러 DOM 요소가 추가됩니다. 페이지에 더 많은 DOM 요소가 있을수록 브라우저가 추적할 내용이 더 많아집니다. 너무 많은 항목이 있는 경우 브라우저가 느려질 수 있습니다.function initialize() { //Initialize a map instance. map = new atlas.Map('myMap', { center: [-90, 40], zoom: 2, //Add your Azure Maps subscription key to the map SDK. authOptions: { authType: 'subscriptionKey', subscriptionKey: '<Your Azure Maps Key>' } }); //Create a pop-up window, but leave it closed so we can update it and display it later. popup = new atlas.Popup(); //Use MapControlCredential to share authentication between a map control and the service module. var pipeline = atlas.service.MapsURL.newPipeline(new atlas.service.MapControlCredential(map)); //Create an instance of the SearchURL client. searchURL = new atlas.service.SearchURL(pipeline); //If the user selects the search button, geocode the value the user passed in. document.getElementById('searchBtn').onclick = performSearch; //If the user presses Enter in the search box, perform a search. document.getElementById('searchTbx').onkeyup = function(e) { if (e.keyCode === 13) { performSearch(); } }; //If the user selects the My Location button, use the Geolocation API to get the user's location. Center and zoom the map on that location. document.getElementById('myLocationBtn').onclick = setMapToUserLocation; //Wait until the map resources are ready. map.events.add('ready', function() { //Add your maps post load functionality. }); } function performSearch() { var query = document.getElementById('searchTbx').value; //Perform a fuzzy search on the users query. searchURL.searchFuzzy(atlas.service.Aborter.timeout(3000), query, { //Pass in the array of country/region ISO2 for which we want to limit the search to. countrySet: countrySet, view: 'Auto' }).then(results => { //Parse the response into GeoJSON so that the map can understand. var data = results.geojson.getFeatures(); if (data.features.length > 0) { //Set the camera to the bounds of the results. map.setCamera({ bounds: data.features[0].bbox, padding: 40 }); } else { document.getElementById('listPanel').innerHTML = '<div class="statusMessage">Unable to find the location you searched for.</div>'; } }); } function setMapToUserLocation() { //Request the user's location. navigator.geolocation.getCurrentPosition(function(position) { //Convert the geolocation API position into a longitude/latitude position value the map can understand and center the map over it. map.setCamera({ center: [position.coords.longitude, position.coords.latitude], zoom: maxClusterZoomLevel + 1 }); }, function(error) { //If an error occurs when trying to access the users position information, display an error message. switch (error.code) { case error.PERMISSION_DENIED: alert('User denied the request for geolocation.'); break; case error.POSITION_UNAVAILABLE: alert('Position information is unavailable.'); break; case error.TIMEOUT: alert('The request to get user position timed out.'); break; case error.UNKNOWN_ERROR: alert('An unknown error occurred.'); break; } }); } //Initialize the application when the page is loaded. window.onload = initialize;지도의
ready이벤트 처리기에서 확대/축소 컨트롤과 검색 영역 중앙에 표시할 HTML 표식을 추가합니다.//Add a zoom control to the map. map.controls.add(new atlas.control.ZoomControl(), { position: 'top-right' }); //Add an HTML marker to the map to indicate the center to use for searching. centerMarker = new atlas.HtmlMarker({ htmlContent: '<div class="mapCenterIcon"></div>', position: map.getCamera().center }); map.markers.add(centerMarker);지도의
ready이벤트 처리기에서 데이터 원본을 추가합니다. 그런 후 데이터 세트를 로드한 후 구문 분석하기 위한 호출을 수행합니다. 데이터 원본에서 클러스터링을 사용하도록 설정합니다. 데이터 원본에 대해 클러스터링을 지정하면 겹치는 지점이 하나의 클러스터로 그룹화됩니다. 사용자가 확대하면 클러스터가 개별 요소로 분리됩니다. 이 동작은 더 나은 사용자 환경을 제공하고 성능을 향상시킵니다.//Create a data source, add it to the map, and then enable clustering. datasource = new atlas.source.DataSource(null, { cluster: true, clusterMaxZoom: maxClusterZoomLevel - 1 }); map.sources.add(datasource); //Load all the store data now that the data source has been defined. loadStoreData();데이터 세트가 지도의
ready이벤트 처리기에 로드되면 데이터를 렌더링할 계층 세트를 정의합니다. 거품형 레이어는 클러스터링된 데이터 요소를 렌더링합니다. 기호 계층은 각 클러스터의 요소 수를 거품형 레이어 위에 렌더링합니다. 두 번째 기호 계층은 지도의 개별 위치에 대한 사용자 지정 아이콘을 렌더링합니다.풍선 및 아이콘 계층에
mouseover및mouseout이벤트를 추가하여 사용자가 지도에서 클러스터 또는 아이콘 위로 마우스를 가져갈 때 마우스 커서가 변경되도록 합니다. 클러스터 풍선 계층에click이벤트를 추가합니다. 이click이벤트는 두 수준으로 지도를 확대하고 사용자가 클러스터를 선택하면 지도 중심을 해당 클러스터로 이동합니다. 아이콘 계층에click이벤트를 추가합니다. 이click이벤트는 사용자가 개별 위치 아이콘을 선택할 때 커피숍 세부 정보를 표시하는 팝업 창을 표시합니다. 지도 이동이 완료되면 모니터링할 지도에 이벤트를 추가합니다. 이 이벤트가 발생하면 목록 패널에서 항목이 업데이트됩니다.//Create a bubble layer to render clustered data points. var clusterBubbleLayer = new atlas.layer.BubbleLayer(datasource, null, { radius: 12, color: '#007faa', strokeColor: 'white', strokeWidth: 2, filter: ['has', 'point_count'] //Only render data points that have a point_count property; clusters have this property. }); //Create a symbol layer to render the count of locations in a cluster. var clusterLabelLayer = new atlas.layer.SymbolLayer(datasource, null, { iconOptions: { image: 'none' //Hide the icon image. }, textOptions: { textField: ['get', 'point_count_abbreviated'], size: 12, font: ['StandardFont-Bold'], offset: [0, 0.4], color: 'white' } }); map.layers.add([clusterBubbleLayer, clusterLabelLayer]); //Load a custom image icon into the map resources. map.imageSprite.add('myCustomIcon', iconImageUrl).then(function() { //Create a layer to render a coffee cup symbol above each bubble for an individual location. iconLayer = new atlas.layer.SymbolLayer(datasource, null, { iconOptions: { //Pass in the ID of the custom icon that was loaded into the map resources. image: 'myCustomIcon', //Optionally, scale the size of the icon. font: ['SegoeUi-Bold'], //Anchor the center of the icon image to the coordinate. anchor: 'center', //Allow the icons to overlap. allowOverlap: true }, filter: ['!', ['has', 'point_count']] //Filter out clustered points from this layer. }); map.layers.add(iconLayer); //When the mouse is over the cluster and icon layers, change the cursor to a pointer. map.events.add('mouseover', [clusterBubbleLayer, iconLayer], function() { map.getCanvasContainer().style.cursor = 'pointer'; }); //When the mouse leaves the item on the cluster and icon layers, change the cursor back to the default (grab). map.events.add('mouseout', [clusterBubbleLayer, iconLayer], function() { map.getCanvasContainer().style.cursor = 'grab'; }); //Add a click event to the cluster layer. When the user selects a cluster, zoom into it by two levels. map.events.add('click', clusterBubbleLayer, function(e) { map.setCamera({ center: e.position, zoom: map.getCamera().zoom + 2 }); }); //Add a click event to the icon layer and show the shape that was selected. map.events.add('click', iconLayer, function(e) { showPopup(e.shapes[0]); }); //Add an event to monitor when the map has finished rendering. map.events.add('render', function() { //Update the data in the list. updateListItems(); }); });커피숍 데이터 세트가 필요하면 목록 패널이 먼저 다운로드됩니다. 다운로드가 완료되면 파일이 여러 줄로 분할됩니다. 첫 번째 줄에는 헤더 정보가 포함됩니다. 코드를 보다 쉽게 따라가도록 하기 위해 헤더를 개체로 구문 분석합니다. 그러면 이러한 개체를 사용하여 각 속성의 셀 인덱스를 조회할 수 있습니다. 첫 번째 줄 이후에 나머지 줄을 반복하면서 지점 피쳐를 만듭니다. 데이터 원본에 지점 피쳐를 추가합니다. 마지막으로 목록 패널을 업데이트합니다.
function loadStoreData() {

//Download the store location data.
fetch(storeLocationDataUrl)
    .then(response => response.text())
    .then(function(text) {

        //Parse the tab-delimited file data into GeoJSON features.
        var features = [];

        //Split the lines of the file.
        var lines = text.split('\n');

        //Grab the header row.
        var row = lines[0].split('\t');

        //Parse the header row and index each column to make the code for parsing each row easier to follow.
        var header = {};
        var numColumns = row.length;
        for (var i = 0; i < row.length; i++) {
            header[row[i]] = i;
        }

        //Skip the header row and then parse each row into a GeoJSON feature.
        for (var i = 1; i < lines.length; i++) {
            row = lines[i].split('\t');

            //Ensure that the row has the correct number of columns.
            if (row.length >= numColumns) {

                features.push(new atlas.data.Feature(new atlas.data.Point([parseFloat(row[header['Longitude']]), parseFloat(row[header['Latitude']])]), {
                    AddressLine: row[header['AddressLine']],
                    City: row[header['City']],
                    Municipality: row[header['Municipality']],
                    AdminDivision: row[header['AdminDivision']],
                    Country: row[header['Country']],
                    PostCode: row[header['PostCode']],
                    Phone: row[header['Phone']],
                    StoreType: row[header['StoreType']],
                    IsWiFiHotSpot: (row[header['IsWiFiHotSpot']].toLowerCase() === 'true') ? true : false,
                    IsWheelchairAccessible: (row[header['IsWheelchairAccessible']].toLowerCase() === 'true') ? true : false,
                    Opens: parseInt(row[header['Opens']]),
                    Closes: parseInt(row[header['Closes']])
                }));
            }
        }

        //Add the features to the data source.
        datasource.add(new atlas.data.FeatureCollection(features));

        //Initially, update the list items.
        updateListItems();
    });
}
목록 패널이 업데이트되면 거리가 계산됩니다. 이 거리는 지도의 중심에서 현재 지도 보기의 모든 지점 기능까지 이르는 거리입니다. 그런 후 피쳐가 거리별로 정렬됩니다. 목록 패널에 각 위치를 표시하기 위해 HTML이 생성됩니다.
var listItemTemplate = '<div class="listItem" onclick="itemSelected(\'{id}\')"><div class="listItem-title">{title}</div>{city}<br />Open until {closes}<br />{distance} miles away</div>';

function updateListItems() {
    //Hide the center marker.
    centerMarker.setOptions({
        visible: false
    });

    //Get the current camera and view information for the map.
    var camera = map.getCamera();
    var listPanel = document.getElementById('listPanel');

    //Check to see if the user is zoomed out a substantial distance. If they are, tell them to zoom in and to perform a search or select the My Location button.
    if (camera.zoom < maxClusterZoomLevel) {
        //Close the pop-up window; clusters might be displayed on the map.
        popup.close();
        listPanel.innerHTML = '<div class="statusMessage">Search for a location, zoom the map, or select the My Location button to see individual locations.</div>';
    } else {
        //Update the location of the centerMarker property.
        centerMarker.setOptions({
            position: camera.center,
            visible: true
        });

        //List the ten closest locations in the side panel.
        var html = [], properties;

        /*
        Generating HTML for each item that looks like this:
        <div class="listItem" onclick="itemSelected('id')">
            <div class="listItem-title">1 Microsoft Way</div>
            Redmond, WA 98052<br />
            Open until 9:00 PM<br />
            0.7 miles away
        </div>
        */

        //Get all the shapes that have been rendered in the bubble layer.
        var data = map.layers.getRenderedShapes(map.getCamera().bounds, [iconLayer]);

        //Create an index of the distances of each shape.
        var distances = {};

        data.forEach(function (shape) {
            if (shape instanceof atlas.Shape) {

                //Calculate the distance from the center of the map to each shape and store in the index. Round to 2 decimals.
                distances[shape.getId()] = Math.round(atlas.math.getDistanceTo(camera.center, shape.getCoordinates(), 'miles') * 100) / 100;
            }
        });

        //Sort the data by distance.
        data.sort(function (x, y) {
            return distances[x.getId()] - distances[y.getId()];
        });

        data.forEach(function(shape) {
            properties = shape.getProperties();
            html.push('<div class="listItem" onclick="itemSelected(\'', shape.getId(), '\')"><div class="listItem-title">',
            properties['AddressLine'],
            '</div>',
            //Get a formatted addressLine2 value that consists of City, Municipality, AdminDivision, and PostCode.
            getAddressLine2(properties),
            '<br />',

            //Convert the closing time to a format that is easier to read.
            getOpenTillTime(properties),
            '<br />',

            //Get the distance of the shape.
            distances[shape.getId()],
            ' miles away</div>');
        });

        listPanel.innerHTML = html.join('');

        //Scroll to the top of the list panel in case the user has scrolled down.
        listPanel.scrollTop = 0;
    }
}

//This converts a time that's in a 24-hour format to an AM/PM time or noon/midnight string.
function getOpenTillTime(properties) {
    var time = properties['Closes'];
    var t = time / 100;
    var sTime;

    if (time === 1200) {
        sTime = 'noon';
    } else if (time === 0 || time === 2400) {
        sTime = 'midnight';
    } else {
        sTime = Math.round(t) + ':';

        //Get the minutes.
        t = (t - Math.round(t)) * 100;

        if (t === 0) {
            sTime += '00';
        } else if (t < 10) {
            sTime += '0' + t;
        } else {
            sTime += Math.round(t);
        }

        if (time < 1200) {
            sTime += ' AM';
        } else {
            sTime += ' PM';
        }
    }

    return 'Open until ' + sTime;
}

//Create an addressLine2 string that contains City, Municipality, AdminDivision, and PostCode.
function getAddressLine2(properties) {
    var html = [properties['City']];

    if (properties['Municipality']) {
        html.push(', ', properties['Municipality']);
    }

    if (properties['AdminDivision']) {
        html.push(', ', properties['AdminDivision']);
    }

    if (properties['PostCode']) {
        html.push(' ', properties['PostCode']);
    }

    return html.join('');
}
사용자가 목록 패널에서 항목을 선택하면 항목과 관련된 도형이 데이터 원본에서 검색됩니다. 도형에 저장된 속성 정보를 기준으로 하는 팝업 창이 생성됩니다. 지도는 도형의 가운데에 위치합니다. 지도 너비가 700픽셀 미만이면 팝업 창이 표시되도록 지도 보기가 오프셋됩니다.
//When a user selects a result in the side panel, look up the shape by its ID value and display the pop-up window.
function itemSelected(id) {
    //Get the shape from the data source by using its ID.
    var shape = datasource.getShapeById(id);
    showPopup(shape);

    //Center the map over the shape on the map.
    var center = shape.getCoordinates();
    var offset;

    //If the map is fewer than 700 pixels wide, then the layout is set for small screens.
    if (map.getCanvas().width < 700) {
        //When the map is small, offset the center of the map relative to the shape so that there is room for the popup to appear.
        offset = [0, -80];
    }

    map.setCamera({
        center: center,
        centerOffset: offset
    });
}

function showPopup(shape) {
    var properties = shape.getProperties();

    /* Generating HTML for the pop-up window that looks like this:

        <div class="storePopup">
            <div class="popupTitle">
                3159 Tongass Avenue
                <div class="popupSubTitle">Ketchikan, AK 99901</div>
            </div>
            <div class="popupContent">
                Open until 22:00 PM<br/>
                <img title="Phone Icon" src="images/PhoneIcon.png">
                <a href="tel:1-800-XXX-XXXX">1-800-XXX-XXXX</a>
                <br>Amenities:
                <img title="Wi-Fi Hotspot" src="images/WiFiIcon.png">
                <img title="Wheelchair Accessible" src="images/WheelChair-small.png">
            </div>
        </div>
    */

     //Calculate the distance from the center of the map to the shape in miles, round to 2 decimals.
    var distance = Math.round(atlas.math.getDistanceTo(map.getCamera().center, shape.getCoordinates(), 'miles') * 100)/100;

    var html = ['<div class="storePopup">'];
    html.push('<div class="popupTitle">',
        properties['AddressLine'],
        '<div class="popupSubTitle">',
        getAddressLine2(properties),
        '</div></div><div class="popupContent">',

        //Convert the closing time to a format that's easier to read.
        getOpenTillTime(properties),

        //Add the distance information.
        '<br/>', distance,
        ' miles away',
        '<br /><img src="images/PhoneIcon.png" title="Phone Icon"/><a href="tel:',
        properties['Phone'],
        '">',
        properties['Phone'],
        '</a>'
    );

    if (properties['IsWiFiHotSpot'] || properties['IsWheelchairAccessible']) {
        html.push('<br/>Amenities: ');

        if (properties['IsWiFiHotSpot']) {
            html.push('<img src="images/WiFiIcon.png" title="Wi-Fi Hotspot"/>');
        }

        if (properties['IsWheelchairAccessible']) {
            html.push('<img src="images/WheelChair-small.png" title="Wheelchair Accessible"/>');
        }
    }

    html.push('</div></div>');

    //Update the content and position of the pop-up window for the specified shape information.
    popup.setOptions({

        //Create a table from the properties in the feature.
        content:  html.join(''),
        position: shape.getCoordinates()
    });

    //Open the pop-up window.
    popup.open(map);
}
이제 모든 기능을 갖춘 매장 로케이터가 구현되었습니다. 웹 브라우저에서 index.html 파일을 엽니다. 클러스터가 맵에 표시되면 다음 방법 중 원하는 방법을 사용하여 위치를 검색할 수 있습니다.
- 검색 상자
- 내 위치 단추 선택
- 클러스터 선택
- 맵을 확대하여 개별 위치 보기
사용자가 내 위치 단추를 처음 선택하면 브라우저에 사용자 위치에 액세스하기 위한 권한을 요구하는 보안 경고가 표시됩니다. 사용자가 해당 위치를 공유하는 데 동의하면 지도가 사용자 위치에서 확대되고 근처의 커피숍이 표시됩니다.

커피숍 위치가 포함된 영역에서 충분히 가깝게 확대하면 클러스터가 개별 위치로 분리됩니다. 지도에서 아이콘 중 하나를 선택하거나 측면 패널에서 항목을 선택하여 팝업 창을 표시합니다. 선택한 위치에 대한 정보가 팝업에 표시됩니다.

브라우저 창의 너비를 700픽셀 미만으로 조정하거나 모바일 디바이스에서 애플리케이션을 여는 경우 레이아웃이 작은 화면에 더 적합하도록 변경됩니다.
이 자습서에서는 Azure Maps를 사용하여 기본 매장 로케이터를 만드는 방법을 알아보았습니다. 이 자습서에서 만드는 매장 로케이터에는 필요한 모든 기능이 있을 수 있습니다. 매장 로케이터에 기능을 추가하거나 더 많은 사용자 지정 사용자 환경을 위해 더 많은 고급 기능을 사용할 수 있습니다.
- 검색 상자에서 입력할 때 제안 사항이 표시되도록 설정합니다.
- 여러 언어 지원을 추가합니다.
- 경로를 따라 위치를 필터링하도록 합니다.
- 필터를 설정하는 기능을 추가합니다.
- 쿼리 문자열을 사용하여 초기 검색 값을 지정하는 지원을 추가합니다. 이 옵션이 매장 로케이터에 포함되면 사용자가 검색을 책갈피로 지정하고 공유할 수 있습니다. 또한 다른 페이지에서 이 페이지로 검색을 전달하는 쉬운 방법도 제공됩니다.
- 매장 로케이터를 Azure App Service Web App으로 배포합니다.
- 데이터를 데이터베이스에 저장하고 근처 위치를 검색합니다. 자세한 내용은 SQL Server 공간 데이터 형식 개요 및 공간 데이터에서 가장 인접한 항목 쿼리를 참조하세요.
추가 정보
- 완성된 코드는 GitHub의 간단한 매장 로케이터 자습서를 참조하세요.
- 이 샘플을 라이브로 보려면 Azure Maps 코드 샘플 사이트에서 Simple Store Locator를 참조하세요.
- 확대/축소 수준 및 타일 그리드를 사용하여 Azure Maps의 적용 범위와 기능에 대해 자세히 알아보세요.
- 데이터 기반 스타일 식을 사용하여 비즈니스 논리에 적용할 수도 있습니다.
다음 단계
더 많은 코드 예제와 대화형 코딩 환경을 살펴보려면 다음을 참조하세요.