자습서: Azure Notebooks를 사용하여 전기 차량 라우팅(Python)
Azure Maps는 기본적으로 Azure에 통합된 지리 공간적 서비스 API의 포트폴리오입니다. 이러한 API를 통해 개발자, 엔터프라이즈 및 ISV는 위치 인식 앱, IoT, 이동성, 물류 및 자산 추적 솔루션을 개발할 수 있습니다.
Python 및 R과 같은 언어에서 Azure Maps REST API를 호출하여 지리 공간적 데이터 분석 및 기계 학습 시나리오를 사용할 수 있습니다. Azure Maps는 사용자가 여러 데이터 포인트 간의 경로를 계산할 수 있는 강력한 라우팅 API 세트를 제공합니다. 계산은 차량 유형 또는 도달 가능한 영역과 같은 다양한 조건을 기반으로 합니다.
이 자습서에서는 전기 차량 배터리가 부족한 드라이버를 지원합니다. 드라이버는 차량 위치에서 가능한 가장 가까운 충전소를 찾아야 합니다.
이 자습서에서는 다음을 수행합니다.
- 클라우드의 Azure Notebooks에서 Jupyter Notebook 파일을 만들고 실행합니다.
- Python에서 Azure Maps REST API를 호출합니다.
- 전기 차량의 소비 모델에 따라 도달 가능한 범위를 검색합니다.
- 도달 가능한 범위 또는 등시선 내에서 전기 차량 충전소를 검색합니다.
- 지도에서 도달 가능한 범위 경계와 충전소를 렌더링합니다.
- 주행 시간을 기준으로 가장 가까운 전기 차량 충전소까지의 경로를 찾아 시각화합니다.
필수 조건
참고 항목
Azure Maps의 인증에 대한 자세한 내용은 Azure Maps의 인증 관리를 참조하세요.
Azure Notebooks 프로젝트 만들기
이 자습서를 수행하려면 Azure Notebooks 프로젝트를 만들고 Jupyter Notebook 파일을 다운로드하여 실행해야 합니다. Jupyter Notebook 파일에는 이 자습서의 시나리오를 구현하는 Python 코드가 포함되어 있습니다. Azure Notebooks 프로젝트를 만들고 Jupyter Notebook 문서를 이 프로젝트에 업로드하려면 다음 단계를 수행합니다.
Azure Notebooks로 가서 로그인합니다. 자세한 내용은 빠른 시작: 로그인 및 사용자 ID 설정을 참조하세요.
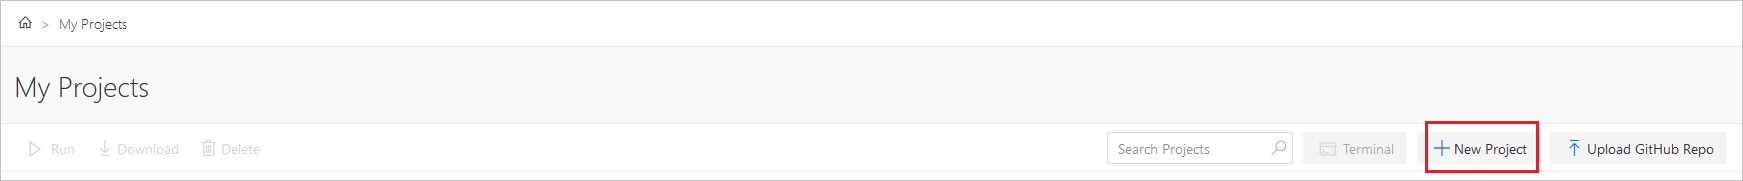
퍼블릭 프로필 페이지의 위쪽에서 내 프로젝트를 선택합니다.

내 프로젝트 페이지에서 새 프로젝트를 선택합니다.
새 프로젝트 만들기 창에서 프로젝트 이름과 프로젝트 ID를 입력합니다.
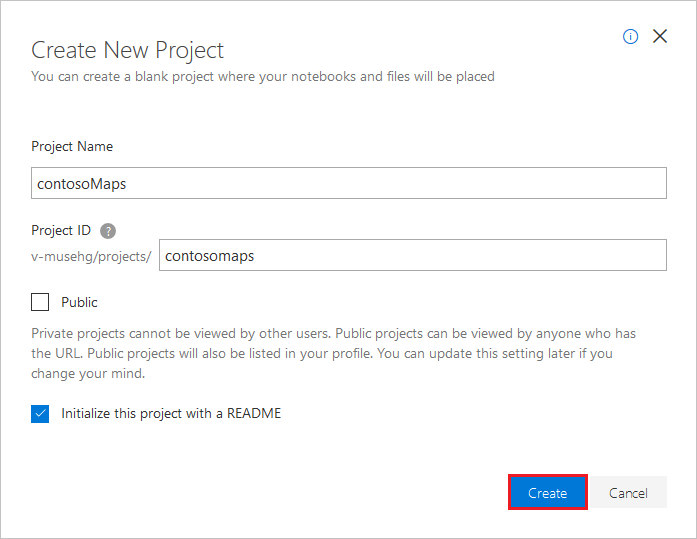
만들기를 실행합니다.
프로젝트가 생성된 후 Azure Maps Jupyter Notebook 리포지토리에서 이 Jupyter Notebook 문서 파일을 다운로드합니다.
내 프로젝트 페이지의 프로젝트 목록에서 프로젝트를 선택한 다음, 업로드를 선택하여 Jupyter Notebook 문서 파일을 업로드합니다.
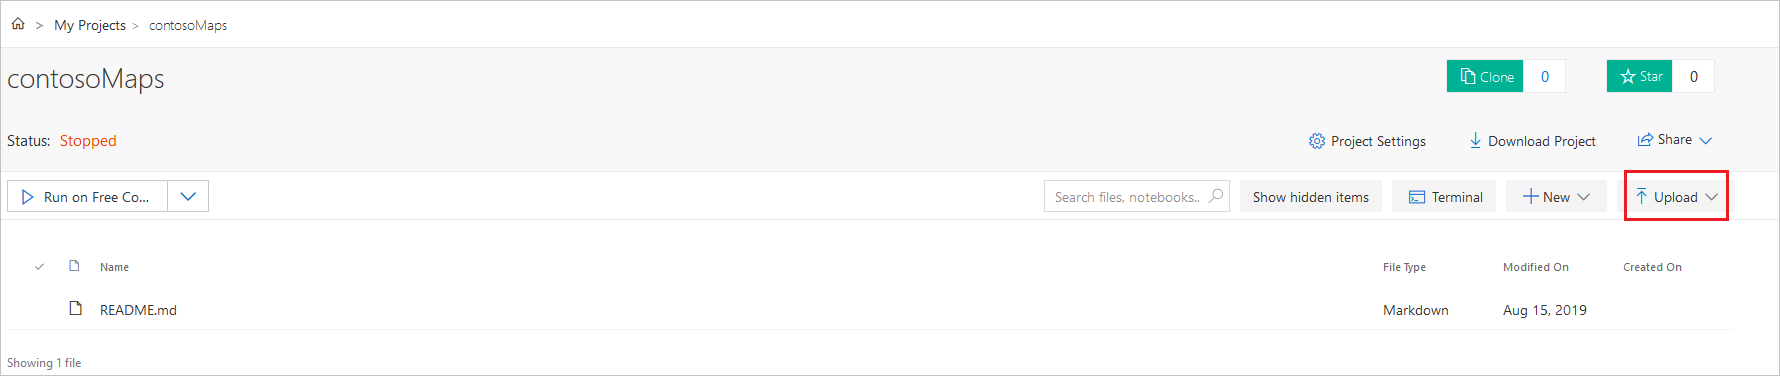
컴퓨터에서 파일을 업로드한 다음, 완료를 선택합니다.
업로드가 성공적으로 완료되면, 프로젝트 페이지에 파일이 표시됩니다. 파일을 두 번 클릭하여 Jupyter Notebook으로 엽니다.
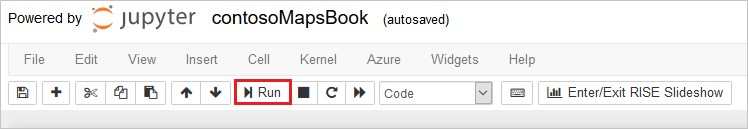
Jupyter Notebook 파일에 구현된 기능을 이해해 보세요. Jupyter Notebook 파일에서 한 번에 하나의 셀로 코드를 실행합니다. Jupyter Notebook 앱의 위쪽에서 실행 단추를 선택하여 각 셀의 코드를 실행할 수 있습니다.
프로젝트 수준 패키지 설치
Jupyter Notebook에서 코드를 실행하려면 다음 단계를 수행하여 프로젝트 수준에서 패키지를 설치해야 합니다.
Azure Maps Jupyter Notebook 리포지토리에서 requirements.txt 파일을 다운로드한 다음, 프로젝트에 업로드합니다.
프로젝트 대시보드에서 프로젝트 설정을 선택합니다.
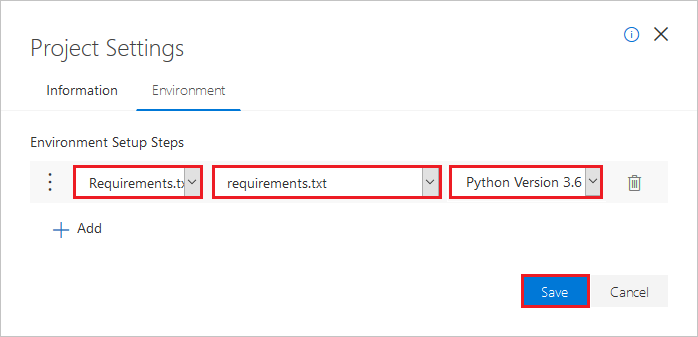
프로젝트 설정 창에서 환경 탭을 선택한 다음, 추가를 선택합니다.
환경 설정 단계 아래에서 다음(a)을 수행합니다. 첫 번째 드롭다운 목록에서 Requirements.txt를 선택합니다.
b. 두 번째 드롭다운 목록에서 requirements.txt 파일을 선택합니다.
c. 세 번째 드롭다운 목록에서 버전으로 Python 버전 3.6을 선택합니다.저장을 선택합니다.
필요한 모듈 및 프레임워크 로드
필요한 모든 모듈과 프레임워크를 로드하려면 다음 스크립트를 실행합니다.
import time
import aiohttp
import urllib.parse
from IPython.display import Image, display
도달 가능한 범위 경계 요청
패키지 제공 회사의 차량 선단에는 몇 가지 전기 차량이 있습니다. 낮에는 창고로 돌아올 필요 없이 전기 차량을 재충전해야 합니다. 잔여 충전량이 1시간 미만으로 떨어질 때마다 도달 가능한 범위 내에 있는 충전소 세트를 검색합니다. 기본적으로 배터리가 부족하면 충전소를 검색합니다. 그리고 해당 청구소 범위에 대한 경계 정보를 얻을 수 있습니다.
회사에서는 경제와 속도의 균형이 필요한 경로를 사용하려고 하므로 요청되는 routeType은 eco입니다. 다음 스크립트는 Azure Maps 라우팅 서비스의 경로 범위 가져오기 API를 호출합니다. 차량의 소비 모델에 대한 매개 변수를 사용합니다. 그런 다음, 이 스크립트는 응답을 구문 분석하여 차량의 최대 도달 가능한 범위를 나타내는 geojson 형식의 다각형 개체를 만듭니다.
전기 차량의 도달 가능한 범위에 대한 경계를 확인하려면 다음 셀의 스크립트를 실행합니다.
subscriptionKey = "Your Azure Maps key"
currentLocation = [34.028115,-118.5184279]
session = aiohttp.ClientSession()
# Parameters for the vehicle consumption model
travelMode = "car"
vehicleEngineType = "electric"
currentChargeInkWh=45
maxChargeInkWh=80
timeBudgetInSec=550
routeType="eco"
constantSpeedConsumptionInkWhPerHundredkm="50,8.2:130,21.3"
# Get boundaries for the electric vehicle's reachable range.
routeRangeResponse = await (await session.get("https://atlas.microsoft.com/route/range/json?subscription-key={}&api-version=1.0&query={}&travelMode={}&vehicleEngineType={}¤tChargeInkWh={}&maxChargeInkWh={}&timeBudgetInSec={}&routeType={}&constantSpeedConsumptionInkWhPerHundredkm={}"
.format(subscriptionKey,str(currentLocation[0])+","+str(currentLocation[1]),travelMode, vehicleEngineType, currentChargeInkWh, maxChargeInkWh, timeBudgetInSec, routeType, constantSpeedConsumptionInkWhPerHundredkm))).json()
polyBounds = routeRangeResponse["reachableRange"]["boundary"]
for i in range(len(polyBounds)):
coordList = list(polyBounds[i].values())
coordList[0], coordList[1] = coordList[1], coordList[0]
polyBounds[i] = coordList
polyBounds.pop()
polyBounds.append(polyBounds[0])
boundsData = {
"geometry": {
"type": "Polygon",
"coordinates":
[
polyBounds
]
}
}
도달 가능한 범위 내에서 전기 차량 충전소 검색
전기 차량의 도달 가능한 범위(등시선)가 결정되면 해당 범위 내에서 충전소를 검색할 수 있습니다.
다음 스크립트는 Azure Maps 기하 도형 내 사후 검색 API를 호출합니다. 자동차의 최대 도달 가능 범위 내에서 전기 차량의 충전소를 검색합니다. 그런 다음, 스크립트는 도달 가능한 위치의 배열로 응답을 구문 분석합니다.
도달 가능한 범위 내에서 전기 차량 충전소를 검색하려면 다음 스크립트를 실행합니다.
# Search for electric vehicle stations within reachable range.
searchPolyResponse = await (await session.post(url = "https://atlas.microsoft.com/search/geometry/json?subscription-key={}&api-version=1.0&query=electric vehicle station&idxSet=POI&limit=50".format(subscriptionKey), json = boundsData)).json()

reachableLocations = []
for loc in range(len(searchPolyResponse["results"])):
                location = list(searchPolyResponse["results"][loc]["position"].values())
                location[0], location[1] = location[1], location[0]
                reachableLocations.append(location)
도달 가능 범위 및 충전 지점 업로드
충전소와 전기차가 도달할 수 있는 최대 범위의 경계를 맵에 시각화하면 도움이 됩니다. 데이터 레지스트리를 만드는 방법 문서에 설명된 단계에 따라 경계 데이터와 충전소 데이터를 geojson 개체로 Azure Storage 계정에 업로드한 다음 Azure Maps 계정에 등록합니다. 고유 식별자(udid) 값이 필요하므로 기록해 둡니다. udid는 소스 코드에서 Azure 스토리지 계정에 업로드한 geojson 개체를 참조하는 방법입니다.
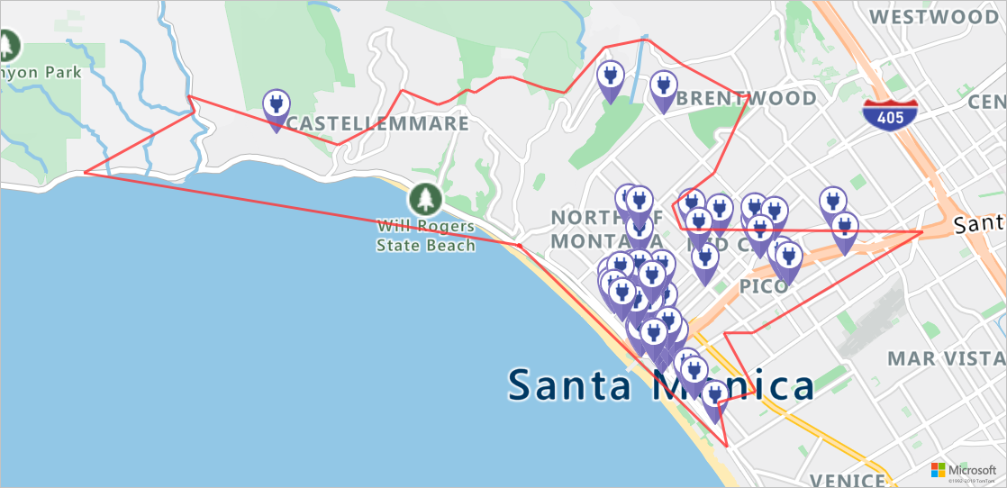
지도에서 충전소 및 도달 가능한 범위 렌더링
Azure Storage 계정에 데이터를 업로드한 후 Azure Maps 맵 이미지 가져오기 서비스를 호출합니다. 이 서비스는 다음 스크립트를 실행하여 정적 지도 이미지에서 충전 지점과 최대 도달 가능한 경계를 렌더링하는 데 사용됩니다.
# Get boundaries for the bounding box.
def getBounds(polyBounds):
    maxLon = max(map(lambda x: x[0], polyBounds))
    minLon = min(map(lambda x: x[0], polyBounds))

    maxLat = max(map(lambda x: x[1], polyBounds))
    minLat = min(map(lambda x: x[1], polyBounds))

    # Buffer the bounding box by 10 percent to account for the pixel size of pins at the ends of the route.
    lonBuffer = (maxLon-minLon)*0.1
    minLon -= lonBuffer
    maxLon += lonBuffer

    latBuffer = (maxLat-minLat)*0.1
    minLat -= latBuffer
    maxLat += latBuffer

    return [minLon, maxLon, minLat, maxLat]

minLon, maxLon, minLat, maxLat = getBounds(polyBounds)

path = "lcff3333|lw3|la0.80|fa0.35||udid-{}".format(rangeUdid)
pins = "custom|an15 53||udid-{}||https://raw.githubusercontent.com/Azure-Samples/AzureMapsCodeSamples/master/AzureMapsCodeSamples/Common/images/icons/ev_pin.png".format(poiUdid)

encodedPins = urllib.parse.quote(pins, safe='')

# Render the range and electric vehicle charging points on the map.
staticMapResponse =  await session.get("https://atlas.microsoft.com/map/static/png?api-version=2022-08-01&subscription-key={}&pins={}&path={}&bbox={}&zoom=12".format(subscriptionKey,encodedPins,path,str(minLon)+", "+str(minLat)+", "+str(maxLon)+", "+str(maxLat)))

poiRangeMap = await staticMapResponse.content.read()

display(Image(poiRangeMap))
최적의 충전소 찾기
먼저 도달 가능한 범위 내의 모든 잠재적 충전소를 확인하려고 합니다. 그런 다음, 최소 시간 내에 도달할 수 있는 곳을 파악하려고 합니다.
다음 스크립트는 Azure Maps Matrix 라우팅 API를 호출합니다. 지정된 차량 위치, 이동 시간 및 각 충전소까지의 거리를 반환합니다. 다음 셀의 스크립트는 응답을 구문 분석하여 시간을 기준으로 가장 가까운 도달 가능한 충전소를 찾습니다.
가장 짧은 시간 내에 도달할 수 있는 가장 가까운 충전소를 찾으려면 다음 셀의 스크립트를 실행합니다.
locationData = {
            "origins": {
              "type": "MultiPoint",
              "coordinates": [[currentLocation[1],currentLocation[0]]]
            },
            "destinations": {
              "type": "MultiPoint",
              "coordinates": reachableLocations
            }
         }

# Get the travel time and distance to each specified charging station.
searchPolyRes = await (await session.post(url = "https://atlas.microsoft.com/route/matrix/json?subscription-key={}&api-version=1.0&routeType=shortest&waitForResults=true".format(subscriptionKey), json = locationData)).json()

distances = []
for dist in range(len(reachableLocations)):
    distances.append(searchPolyRes["matrix"][0][dist]["response"]["routeSummary"]["travelTimeInSeconds"])

minDistLoc = []
minDistIndex = distances.index(min(distances))
minDistLoc.extend([reachableLocations[minDistIndex][1], reachableLocations[minDistIndex][0]])
closestChargeLoc = ",".join(str(i) for i in minDistLoc)
가장 가까운 충전소까지의 경로 계산
이제 가장 가까운 충전소를 찾았으므로 경로 방향 가져오기 API를 호출하여 전기 차량의 현재 위치에서 충전소까지의 자세한 경로를 요청할 수 있습니다.
충전소까지의 경로를 가져오고 응답을 구문 분석하여 해당 경로를 나타내는 geojson 개체를 만들려면 다음 셀의 스크립트를 실행합니다.
# Get the route from the electric vehicle's current location to the closest charging station.
routeResponse = await (await session.get("https://atlas.microsoft.com/route/directions/json?subscription-key={}&api-version=1.0&query={}:{}".format(subscriptionKey, str(currentLocation[0])+","+str(currentLocation[1]), closestChargeLoc))).json()

route = []
for loc in range(len(routeResponse["routes"][0]["legs"][0]["points"])):
                location = list(routeResponse["routes"][0]["legs"][0]["points"][loc].values())
                location[0], location[1] = location[1], location[0]
                route.append(location)

routeData = {
         "type": "LineString",
         "coordinates": route
     }
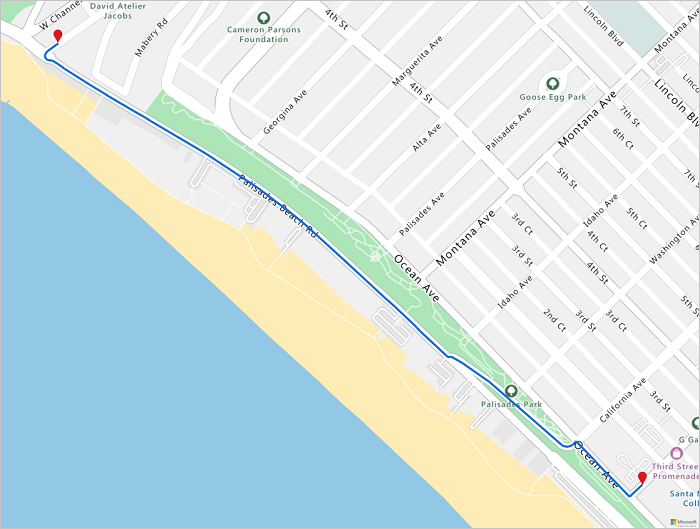
경로 시각화
경로를 시각화하려면 데이터 레지스트리를 만드는 방법 문서에 설명된 단계에 따라 경로 데이터를 geojson 개체로 Azure 스토리지 계정에 업로드한 다음 Azure Maps 계정에 등록합니다. 고유 식별자(udid) 값이 필요하므로 기록해 둡니다. udid는 소스 코드에서 Azure 스토리지 계정에 업로드한 geojson 개체를 참조하는 방법입니다. 그런 다음, 렌더링 서비스인 Map Image 가져오기 API를 호출하여 경로를 지도에 렌더링하고 시각화합니다.
지도에서 렌더링된 경로 이미지를 가져오려면 다음 스크립트를 실행합니다.
# Upload the route data to Azure Maps Data service .
routeUploadRequest = await session.post("https://atlas.microsoft.com/mapData?subscription-key={}&api-version=2.0&dataFormat=geojson".format(subscriptionKey), json = routeData)

udidRequestURI = routeUploadRequest.headers["Location"]+"&subscription-key={}".format(subscriptionKey)

while True:
    udidRequest = await (await session.get(udidRequestURI)).json()
    if 'udid' in udidRequest:
        break
    else:
        time.sleep(0.2)

udid = udidRequest["udid"]

destination = route[-1]

destination[1], destination[0] = destination[0], destination[1]

path = "lc0f6dd9|lw6||udid-{}".format(udid)
pins = "default|codb1818||{} {}|{} {}".format(str(currentLocation[1]),str(currentLocation[0]),destination[1],destination[0])


# Get boundaries for the bounding box.
minLat, maxLat = (float(destination[0]),currentLocation[0]) if float(destination[0])<currentLocation[0] else (currentLocation[0], float(destination[0]))
minLon, maxLon = (float(destination[1]),currentLocation[1]) if float(destination[1])<currentLocation[1] else (currentLocation[1], float(destination[1]))

# Buffer the bounding box by 10 percent to account for the pixel size of pins at the ends of the route.
lonBuffer = (maxLon-minLon)*0.1
minLon -= lonBuffer
maxLon += lonBuffer

latBuffer = (maxLat-minLat)*0.1
minLat -= latBuffer
maxLat += latBuffer

# Render the route on the map.
staticMapResponse = await session.get("https://atlas.microsoft.com/map/static/png?api-version=2022-08-01&subscription-key={}&&path={}&pins={}&bbox={}&zoom=16".format(subscriptionKey,path,pins,str(minLon)+", "+str(minLat)+", "+str(maxLon)+", "+str(maxLat)))

staticMapImage = await staticMapResponse.content.read()

await session.close()
display(Image(staticMapImage))
이 자습서에서는 Python을 사용하여 Azure Maps REST API를 직접 호출하고 Azure Maps 데이터를 시각화하는 방법을 알아보았습니다.
이 자습서에서 사용되는 Azure Maps API를 살펴보려면 다음을 참조하세요.
리소스 정리
정리가 필요한 리소스가 없습니다.
다음 단계
Azure Notebooks에 대한 자세한 내용은 다음을 참조하세요.