Migrate legacy line charts
Learn about line charts in Azure Databricks and how to migrate from the legacy Line charts. Azure Databricks has three types of line charts: Line and legacy charts Line (v2) and Line (v1).
Comparison: Line chart types with time-series data
Line has custom plot options: setting a Y-axis range, showing or hiding markers, and applying log scale to the Y-axis and a built-in toolbar that supports a rich set of client-side interactions.
In addition, Line, Line (v2), and Line (v1) charts treat time-series data in different ways:
| Line and Line (v2) | Line (v1) |
|---|---|
| Date and timestamp are supported. Line (v2) formats a date to local time. |
Date and timestamp are treated as text. |
| Key can only be date, timestamp, or number. | Key can be of any type. |
| X-axis is ordered: * Natural, linear ordering of date, timestamp, and number. * Gaps in time appear as gaps on the chart. |
X-axis is categorical: * Not ordered unless the data is ordered. * Gaps in time do not appear on the chart. |
Notebook example: Migrate to Line from legacy line charts
The notebook in this example converts the date as string into timestamp (including time zone) using unix_timestamp.
To migrate to Line from Line (v1) or Line (v2):
Click
 next to the bar chart
  and select Line.
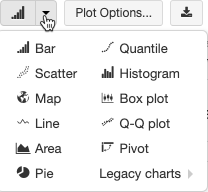
For a Line (v1) chart, if the key column is not a date, timestamp, or number, you must parse the column to a date, timestamp, or number explicitly as demonstrated in the following notebook.
Timestamp conversion notebook
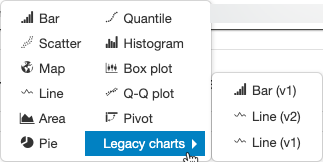
Use legacy line charts
To use legacy line charts, select them from the Legacy Charts drop-down menu.
피드백
출시 예정: 2024년 내내 콘텐츠에 대한 피드백 메커니즘으로 GitHub 문제를 단계적으로 폐지하고 이를 새로운 피드백 시스템으로 바꿀 예정입니다. 자세한 내용은 다음을 참조하세요. https://aka.ms/ContentUserFeedback
다음에 대한 사용자 의견 제출 및 보기