ML 웹 서비스 엔드포인트에서 데이터 모니터링 및 수집
적용 대상: Python SDK azureml v1
이 문서에서는 AKS(Azure Kubernetes Service) 또는 ACI(Azure Container Instances)에서 웹 서비스 엔드포인트에 배포된 모델의 데이터를 수집하는 방법을 알아봅니다. Azure Application Insights를 사용하여 엔드포인트에서 다음 데이터를 수집합니다.
- 출력 데이터
- 응답
- 요청 속도, 응답 시간 및 실패율
- 종속성 비율, 응답 시간 및 실패율
- 예외
enable-app-insights-in-production-service.ipynb Notebook은 이 문서의 개념을 보여줍니다.
Jupyter 노트북을 사용하여 이 서비스 검색 문서를 따라 노트북을 실행하는 방법을 알아봅니다.
Important
이 문서의 정보는 작업 영역으로 만든 Azure Application Insights 인스턴스를 사용합니다. 이 Application Insights 인스턴스를 삭제한 경우 작업 영역을 삭제하고 다시 만드는 것 외에는 다시 만들 수 없습니다.
팁
대신 온라인 엔드포인트를 사용하는 경우 온라인 엔드포인트 모니터링 문서의 정보를 대신 사용합니다.
필수 조건
Azure 구독 - Azure Machine Learning 평가판 또는 유료 버전을 사용해 보세요.
Azure Machine Learning 작업 영역, 스크립트가 포함된 로컬 디렉터리 및 Python용 Azure Machine Learning SDK가 설치되어 있어야 합니다. 자세히 알아보려면 개발 환경을 구성하는 방법을 참조하세요.
학습된 Machine Learning 모델. 자세히 알아보려면 이미지 분류 모델 학습 자습서를 참조하세요.
Python SDK를 사용하여 로깅 구성
이 섹션에서는 Python SDK를 사용하여 Application Insight 로깅을 사용하도록 설정하는 방법에 대해 알아봅니다.
배포된 서비스 업데이트
다음 단계를 사용하여 기존 웹 서비스를 업데이트합니다.
작업 영역에서 서비스를 식별합니다.
ws값은 작업 영역의 이름입니다.from azureml.core.webservice import Webservice aks_service= Webservice(ws, "my-service-name")서비스를 업데이트하고 Azure Application Insights를 사용하도록 설정합니다.
aks_service.update(enable_app_insights=True)
서비스에서 사용자 지정 추적 로그
Important
Azure Application Insights는 최대 64kb의 페이로드를 기록합니다. 이 제한에 도달하면 메모리 부족 등의 오류가 표시되거나 정보가 기록되지 않을 수 있습니다. 기록하려는 데이터가 64kb를 초과하는 경우에는 프로덕션 환경에서 모델용 데이터 수집의 정보를 사용하여 Blob Storage에 저장해야 합니다.
AKS 배포 내 모델 추적과 같은 더 복잡한 상황의 경우 OpenCensus와 같은 타사 라이브러리를 사용하는 것이 좋습니다.
사용자 지정 추적을 기록하려면 배포 방법 및 위치 문서에서 AKS 또는 ACI에 대한 표준 배포 프로세스를 수행합니다. 그런 후 다음 단계를 사용하세요.
유추하는 동안 Application Insights에 데이터를 보내는 print 문을 추가하여 채점 파일을 업데이트합니다. 더 복잡한 정보(예: 요청 데이터 및 응답)의 경우 JSON 구조를 사용합니다.
다음 예제
score.py파일은 모델이 초기화된 시간, 유추 중 입력 및 출력, 오류가 발생한 시간을 기록합니다.import pickle import json import numpy from sklearn.externals import joblib from sklearn.linear_model import Ridge from azureml.core.model import Model import time def init(): global model #Print statement for appinsights custom traces: print ("model initialized" + time.strftime("%H:%M:%S")) # note here "sklearn_regression_model.pkl" is the name of the model registered under the workspace # this call should return the path to the model.pkl file on the local disk. model_path = Model.get_model_path(model_name = 'sklearn_regression_model.pkl') # deserialize the model file back into a sklearn model model = joblib.load(model_path) # note you can pass in multiple rows for scoring def run(raw_data): try: data = json.loads(raw_data)['data'] data = numpy.array(data) result = model.predict(data) # Log the input and output data to appinsights: info = { "input": raw_data, "output": result.tolist() } print(json.dumps(info)) # you can return any datatype as long as it is JSON-serializable return result.tolist() except Exception as e: error = str(e) print (error + time.strftime("%H:%M:%S")) return error서비스 구성을 업데이트하고 Application Insights를 사용하도록 설정해야 합니다.
config = Webservice.deploy_configuration(enable_app_insights=True)이미지를 빌드하고 AKS 또는 ACI에 배포합니다. 자세한 내용은 배포 방법 및 위치를 참조하세요.
Python에서 추적을 사용하지 않도록 설정
Azure Application Insights를 사용하지 않도록 설정하려면 다음 코드를 사용합니다.
## replace <service_name> with the name of the web service
<service_name>.update(enable_app_insights=False)
Azure Machine Learning 스튜디오를 사용하여 로깅 구성
Azure Machine Learning 스튜디오에서 Azure Application Insights를 사용하도록 설정할 수도 있습니다. 모델을 웹 서비스로 배포할 준비가 되면 다음 단계를 사용하여 Application Insights를 사용하도록 설정합니다.
https://ml.azure.com에서 스튜디오에 로그인합니다.
모델로 이동하여 배포할 모델을 선택합니다.
+배포를 선택합니다.
모델 배포 양식을 채웁니다.
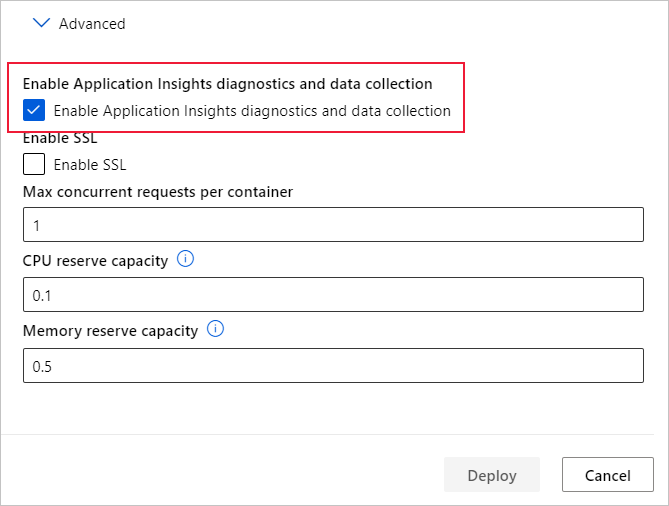
고급 메뉴를 펼칩니다.
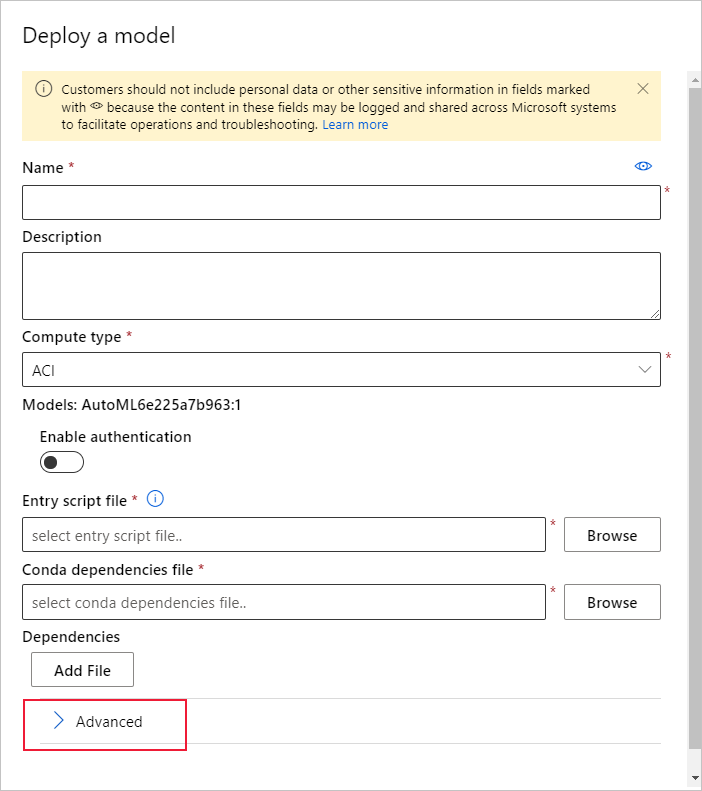
Application Insights 진단 및 데이터 수집 사용을 선택합니다.
메트릭 및 로그 보기
배포된 모델에 대한 쿼리 로그
온라인 엔드포인트의 로그는 고객 데이터입니다. get_logs() 함수를 사용하여 이전에 배포된 웹 서비스에서 로그를 검색할 수 있습니다. 로그에는 배포 중에 발생한 오류에 대한 자세한 정보가 포함되어 있을 수 있습니다.
from azureml.core import Workspace
from azureml.core.webservice import Webservice

ws = Workspace.from_config()

# load existing web service
service = Webservice(name="service-name", workspace=ws)
logs = service.get_logs()
테넌트가 여러 개인 경우 ws = Workspace.from_config() 전에 다음 인증 코드를 추가해야 할 수 있습니다.
from azureml.core.authentication import InteractiveLoginAuthentication
interactive_auth = InteractiveLoginAuthentication(tenant_id="the tenant_id in which your workspace resides")
스튜디오에서 로그 보기
Azure Application Insights는 Azure Machine Learning 작업 영역과 동일한 리소스 그룹에 서비스 로그를 저장합니다. 스튜디오를 사용하여 데이터를 보려면 다음 단계를 수행합니다.
스튜디오에서 Azure Machine Learning 작업 영역으로 이동합니다.
끝점을 선택합니다.
배포된 서비스를 선택합니다.
Application Insights URL 링크를 선택합니다.

Application Insights의 개요 탭 또는 모니터링 섹션에서 로그를 선택합니다.

score.py 파일에서 기록된 정보를 보려면 추적 테이블을 확인합니다. 다음 쿼리는 입력 값이 기록된 로그를 검색합니다.
traces
| where customDimensions contains "input"
| limit 10


Azure Application Insights를 사용하는 방법에 대한 자세한 내용은 Application Insights란?을 참조하세요.
웹 서비스 메타데이터 및 응답 데이터
Important
Azure Application Insights는 최대 64kb의 페이로드를 기록합니다. 이 제한에 도달하면 메모리 부족 등의 오류가 표시되거나 정보가 기록되지 않을 수 있습니다.
웹 서비스 요청 정보를 기록하려면 score.py 파일에 print 문을 추가합니다. 각 print 문은 STDOUT 메시지 아래 Application Insights 추적 테이블에 하나의 항목을 생성합니다. Application Insights는 print 문 출력을 customDimensions 및 Contents 추적 테이블에 저장합니다. JSON 문자열을 인쇄하면 Contents 아래의 추적 출력에 계층적 데이터 구조가 생성됩니다.
보존 및 처리를 위해 데이터 내보내기
Important
Azure Application Insights는 Blob Storage로 내보내기만 지원합니다. 이 구현의 한계에 대한 자세한 내용은 App Insights에서 원격 분석 내보내기를 참조하세요.
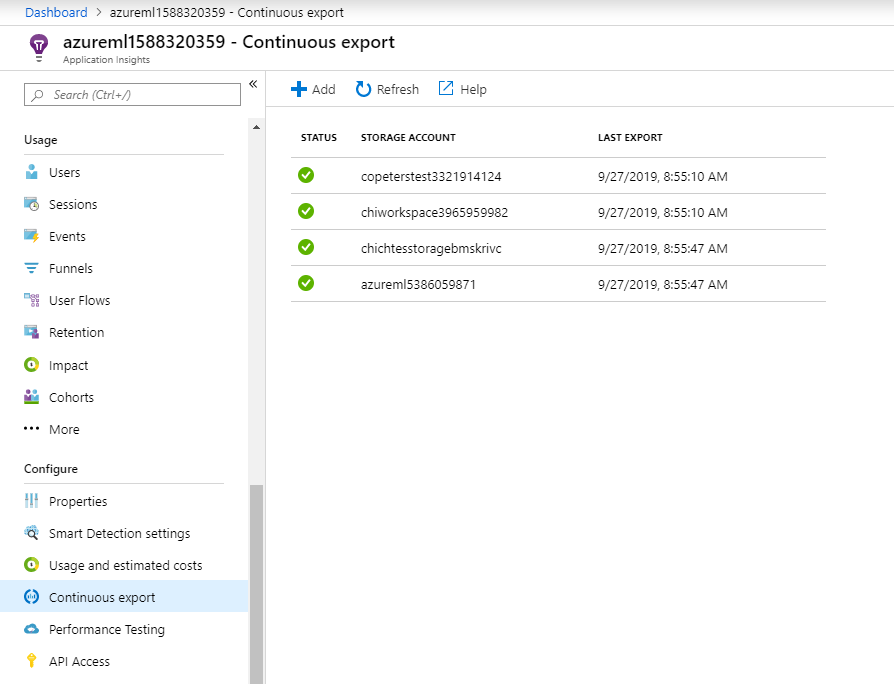
Application Insights의 연속 내보내기를 사용하여 보존 설정을 정의할 수 있는 Blob Storage 계정으로 데이터를 내보냅니다. Application Insights는 데이터를 JSON 형식으로 내보냅니다.
다음 단계
이 문서에서는 웹 서비스 엔드포인트에 대한 로깅을 사용하도록 설정하고 로그를 보는 방법을 알아보았습니다. 다음 단계에는 아래 문서를 살펴보세요.
MLOps: Azure Machine Learning을 사용하여 모델 관리, 배포 및 모니터링에서 프로덕션 환경의 모델에서 수집한 데이터를 활용하는 방법을 알아보세요. 이러한 데이터는 기계 학습 프로세스를 지속적으로 개선하는 데 도움이 될 수 있습니다.