Service Worker improvements
This article explains improvements to developer tools for working with service workers and the network requests that pass through each service worker. The service worker improvements are in the Network, Application, and Sources tools.
The improvements to service workers simplify the following tasks:
- Debug based on Service Worker timelines.
- The start of a request and duration of the bootstrap.
- Update to Service worker registration.
- The runtime of a request using the fetch event handler.
- The runtime of all fetch events for loading a client.
- Explore the runtime details of fetch event handlers, install event handlers, and activate event handlers.
- Step into and out of fetch event handler with page script information.
The improved experiences span three different developer tools:
The Network tool. Select a network request that runs through a service worker and access the corresponding timeline of the service worker in the Timing tool.
The Application tool. To debug the service workers, go to the Service Workers tool.
The Sources tool. Access page script information when stepping into fetch event handlers.
Network
You can access the service worker debugging features in the Network tool in either of the following ways:
- Directly in the Network tool.
- Started in the Application tool.
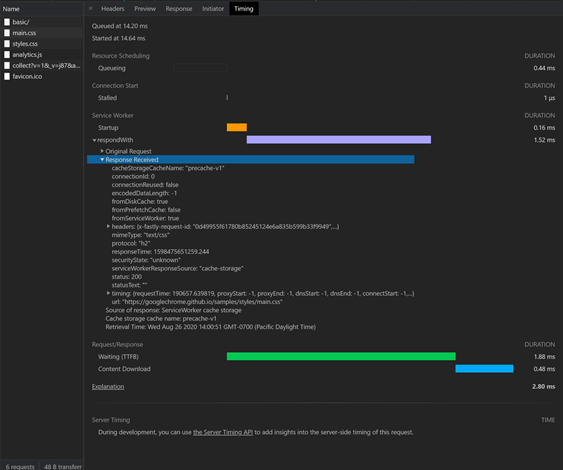
Request routing
To make request routing easier to visualize, timelines now display the service worker start-up and the respondWith fetch events. To debug and visualize a network request that passed through a service worker:
- Select the network request that went through a service worker.
- Open the Timing tool.
Fetch events
To learn more about the respondWith fetch events, click the dropdown arrow to the left of the respondWith. To find more details about the Original Request and Response Received, click the corresponding dropdown arrows.
Application
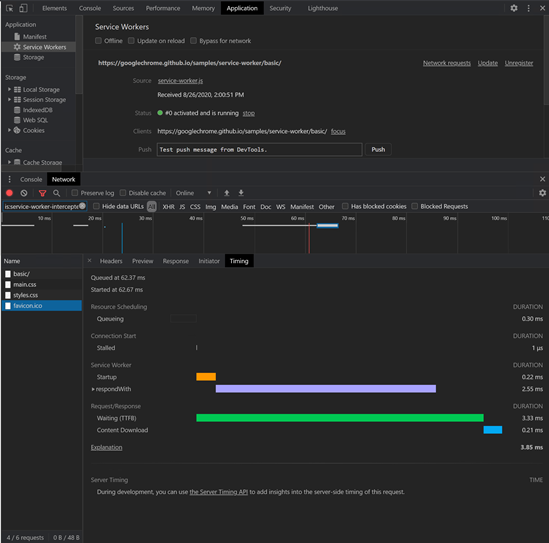
Service worker update timeline
The Microsoft Edge DevTools team added a timeline in the Application tool to reflect the update lifecycle of the service worker. This timeline displays the installation and activation events. Each of the events have a corresponding dropdown arrow to give you more details.
Request routing and fetch events
You can now access the service worker timelines through the Network tool in the console drawer. This feature benefits performance, minimizes UI duplication, and creates a more comprehensive debugging experience.
Open the service worker that you're debugging.
Click the Network button to open the request routing experience.
Use the respondWith dropdown arrows for fetch event request and response information.
The Network tool displays the network requests that went through the service worker you are debugging. The automatic filter is a way to narrow down your exploration.
See also Application tool, to manage storage.
Sources
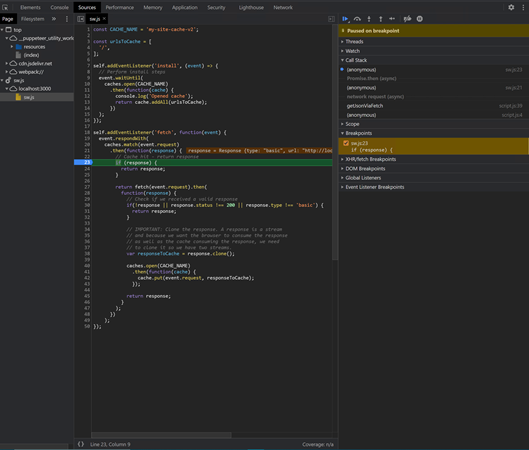
To find more stack information, set a break point in the fetch handler. The details lead to where the resource is requested in the page script.
When the debugger pauses inside a fetch handler, a combined stack information is displayed in the panel to the right. After that, you can move around in the stack frames.
Future work
The Microsoft Edge DevTools team plans to further develop the cache detail, and are investigating more ways to improve the service worker debugging experience for Progressive Web Application (PWA) developers.
Feedback
Coming soon: Throughout 2024 we will be phasing out GitHub Issues as the feedback mechanism for content and replacing it with a new feedback system. For more information see: https://aka.ms/ContentUserFeedback.
Submit and view feedback for