Preparing for support calls for browser crashes
Warning
The retired, out-of-support Internet Explorer 11 desktop application has been permanently disabled through a Microsoft Edge update on certain versions of Windows 10. For more information, see Internet Explorer 11 desktop app retirement FAQ.
This article describes how to generate and gather crash dumps and event logs that are used by Microsoft Customer Service and Support to troubleshoot browser crashes. Gathering these logs and uploading them during case creation can help diagnose the cause and solve the problem.
Applies to: Browser
Original KB number: 4520151
Background
To solve a process crash, we always require the same data. If an application's code encounters an exception that is not handled, the process crashes because the code can no longer run. Windows detects this problem when it occurs, and it saves bits (or all) of the process memory to a file that's known as a dump file. This file lets us see what was occurring at the time of the crash.
Of particular importance is the call stack of the crash. A call stack is primarily used to run functions within a thread. However, when we examine crashes, the call stack works like a problem fingerprint that lets us match related issues and dig deeper into the process memory to understand what occurred.
Windows automatically captures mini dumps every time that it encounters a process crash. These small files can help us compare this crash event to previous events. However, mini dumps typically aren't detailed enough for troubleshooting. Therefore, we require full process memory dumps.
Collecting data
Important
By following the procedures in this article, you may capture sensitive Personal Data. If sharing this data is a concern for you, you should work with Microsoft Support to explore alternative ways to troubleshoot the issue. Microsoft is committed to protecting your privacy. See the Microsoft Privacy Statement for more information.
The quickest way to collect a full process dump is by using Windows Error Reporting (WER). (See Collecting dumps through WER)
Occasionally, WER can't collect a dump. In such cases, we may have to use other tools to troubleshoot. (See Collecting dumps through ProcDump)
If the issue is intermittent and will take some time to reproduce, we can examine the event logs for clues about the problem while we wait for the dump collection to finish. (See Collecting event log information)
Collecting dumps through WER
Important
Follow the steps in this section carefully. Serious problems might occur if you modify the registry incorrectly. Before you modify it, back up the registry for restoration in case problems occur.
The following terms apply to using WER:
- DumpFolder: Defines the folder where crash dumps are saved.
- DumpType: Defines the type of dump that we want to create (a value of 2 means a full memory dump).
For more information about WER registry configurations, see WER Settings.
To use WER, follow these steps:
On the computer on which the crash occurred, create a folder on the root drive to which to save the dump files that will be created. For example, create C:\Dumps.
Open an administrative Command Prompt window, and enter the following commands at the command prompt:
reg add "HKEY_LOCAL_MACHINE\SOFTWARE\Microsoft\Windows\Windows Error Reporting\LocalDumps" /v DumpFolder /t REG_EXPAND_SZ /d "C:\Dumps" /f

reg add "HKEY_LOCAL_MACHINE\SOFTWARE\Microsoft\Windows\Windows Error Reporting\LocalDumps" /v DumpType /t REG_DWORD /d "2" /f
Note
- In these commands, C:/Dumps is the folder that you created in step 1.
- If the WER service (WerSvc) is already started, you may have to stop and restart it so that the new registry configurations can be read correctly.
Do the necessary steps to reproduce the crash.
After the crash occurs, navigate to the C:\Dumps folder, and upload the dump (.dmp) files. To do this, either use the upload option during the case creation or upload the files manually to a workspace that's provided by the Support agent, per the agent's request.
Collecting dumps through ProcDump
If a dump is not created by using WER when the process crashes, the next step is to use ProcDump, one of the tools from the Windows Sysinternals suite.
Occasionally, a dump isn't created because the application does not technically crash but, instead, stops by itself. You can use event viewer to check whether a crash event was recorded. To do this, follow these steps:
- Press Windows logo key+R, enter eventvwr, and then press Enter.
- In the navigation pane, expand Windows Logs.
- Select Application.
- Examine the event IDs to locate the time that the crash occurred
Check whether there's an entry for a 1000 error event that corresponds to the time of the crash. If there is, follow these steps:
On the computer on which the crash occurred, create a folder that's named Dumps on the root drive. For example, create C:\Dumps.
Download ProcDump from the following location, and expand the compressed file:
ProcDumpOpen an administrative Command Prompt window, and navigate to the location where you expanded ProcDump.
Determine the How to find the PID of a process of the process that you have to monitor.
Note
To provide a cleaner environment for the tool to run in, close any other open browser windows and running processes.
A t the command prompt, enter the following command, depending on the behavior of the system when the crash occurs:
If the process crashes and an entry are written to the event log:
Procdump -ma -e C:\Dumps <pid of the process>If the process terminates and there's no evidence of a crash in the event log:
Procdump -ma -t C:\Dumps <pid of the process>Note
In this command, C:\Dumps is the folder to which the dump files will be saved.
Do the necessary steps to reproduce the crash.
After the crash occurs, navigate to the C:\Dumps folder, and upload the dump (.dmp) files. To do this, either use the upload option during the case creation or upload the files manually to a workspace that's provided by the Support agent, per the agent's request.
Collecting event log information
To save the event data to send to Microsoft, follow these steps:
- Press Windows logo key+R, enter eventvwr, and then press Enter.
- In the navigation pane, expand Windows Logs.
- Right-click Application, and select Save All Events As.
- Enter a file name, and save the information as an .evtx file.
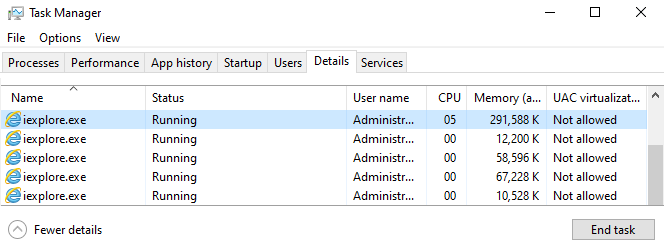
How to find the PID of a process
When a process is created, it's assigned an identification number. You may run multiple processes that have the same name, but the process identifier (PID) is unique to that process for its lifetime.
Some tools that we use require the process PID. To find this number, follow these steps:
Open Task Manager. To do this, open Search, enter task manager into the search box, and then select Task Manager in the results.
In Task Manager, select the Details tab.
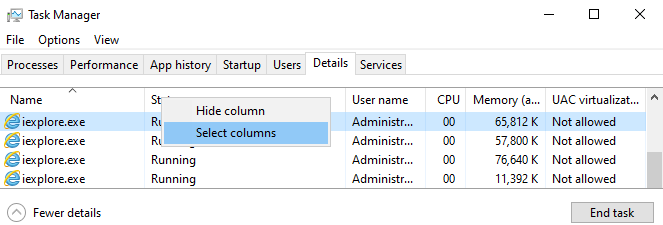
By default, the PID column is not visible. To display it if it's hidden, right-click any column header, and select Select columns.
Select the PID check box, and then select OK.
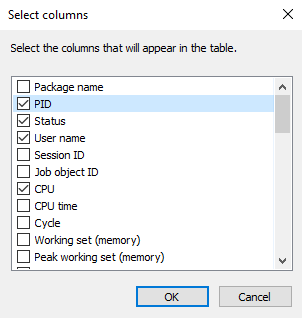
The PID column is now visible.

Tilbakemeldinger
Kommer snart: Gjennom 2024 faser vi ut GitHub Issues som tilbakemeldingsmekanisme for innhold, og erstatter det med et nytt system for tilbakemeldinger. Hvis du vil ha mer informasjon, kan du se: https://aka.ms/ContentUserFeedback.
Send inn og vis tilbakemelding for