Troubleshoot SQL Insights (preview)
Applies to: ![]() Azure SQL Database
Azure SQL Database ![]() Azure SQL Managed Instance
Azure SQL Managed Instance
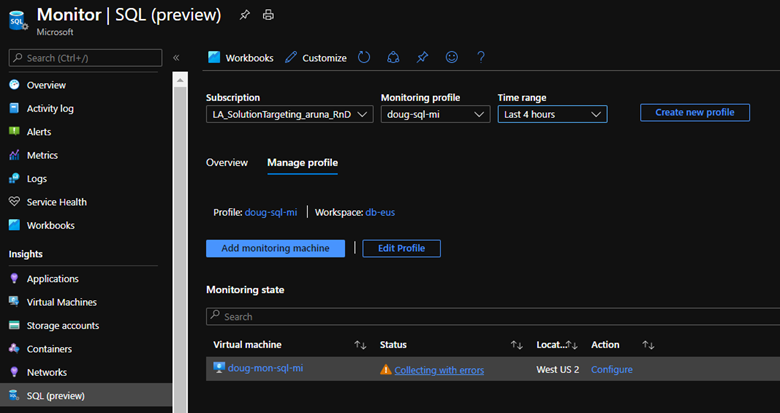
To troubleshoot data collection issues in SQL Insights (preview), check the status of the monitoring machine on the Manage profile tab. The statuses are:
- Collecting
- Not collecting
- Collecting with errors
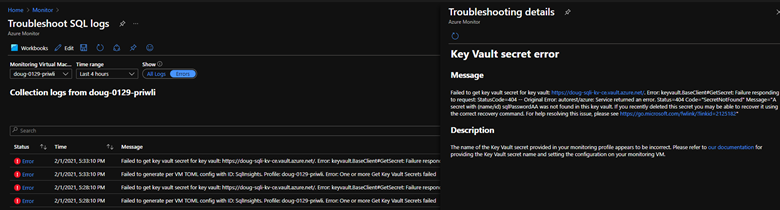
Select the status to see logs and more details that might help you resolve the problem.
Status: Not collecting
The monitoring machine has a status of Not collecting if there's no data in InsightsMetrics for SQL in the last 10 minutes.
Note
Make sure that you're trying to collect data from a supported version of SQL. For example, trying to collect data with a valid profile and connection string but from an unsupported version of Azure SQL Database will result in a Not collecting status.
SQL Insights (preview) uses the following query to retrieve this information:
InsightsMetrics
    | extend Tags = todynamic(Tags)
    | extend SqlInstance = tostring(Tags.sql_instance)
    | where TimeGenerated > ago(10m) and isnotempty(SqlInstance) and Namespace == 'sqlserver_server_properties' and Name == 'uptime'
Check if any logs from Telegraf help identify the root cause the problem. If there are log entries, you can select Not collecting and check the logs and troubleshooting info for common problems.
If there are no log entries, check the logs on the monitoring virtual machine for the following services installed by two virtual machine extensions:
Microsoft.Azure.Monitor.AzureMonitorLinuxAgent- Service: mdsd
Microsoft.Azure.Monitor.Workloads.Workload.WLILinuxExtension- Service: wli
- Service: telegraf
- Service: fluent-bit
- Extension log to check installation failures:
/var/log/azure/Microsoft.Azure.Monitor.Workloads.Workload.WLILinuxExtension/wlilogs.log
wli service logs
Service logs: /var/log/wli.log
To see recent logs: tail -n 100 -f /var/log/wli.log
If you see the following error log, there's a problem with the mdsd service: 2021-01-27T06:09:28Z [Error] Failed to get config data. Error message: dial unix /var/run/mdsd/default_fluent.socket: connect: no such file or directory .
Telegraf service logs
Service logs: /var/log/telegraf/telegraf.log
To see recent logs: tail -n 100 -f /var/log/ms-telegraf/telegraf.log
To see recent error and warning logs: tail -n 1000 /var/log/ms-telegraf/telegraf.log | grep "E\!\|W!"
The configuration that telegraf uses is generated by the wli service and placed in: /etc/ms-telegraf/telegraf.d/wli
If a bad configuration is generated, the ms-telegraf service might fail to start. Check if the ms-telegraf service is running by using this command: service ms-telegraf status
To see error messages from the telegraf service, run it manually by using the following command:
/usr/bin/ms-telegraf --config /etc/ms-telegraf/telegraf.conf --config-directory /etc/ms-telegraf/telegraf.d/wli --test
mdsd service logs
Check prerequisites for the Azure Monitor agent.
Prior to Azure Monitoring Agent v1.12, mdsd service logs were located in:
/var/log/mdsd.err/var/log/mdsd.warn/var/log/mdsd.info
From v1.12 onward, service logs are located in:
/var/opt/microsoft/azuremonitoragent/log//etc/opt/microsoft/azuremonitoragent/
To see recent errors: tail -n 100 -f /var/log/mdsd.err
If you need to contact support, collect the following information:
- Logs in
/var/log/azure/Microsoft.Azure.Monitor.AzureMonitorLinuxAgent/ - Log in
/var/log/waagent.log - Logs in
/var/log/mdsd*, or logs in/var/opt/microsoft/azuremonitoragent/log/and/etc/opt/microsoft/azuremonitoragent/. - Files in
/etc/mdsd.d/ - File
/etc/default/mdsd
Invalid monitoring virtual machine configuration
One cause of the Not collecting status is an invalid configuration for the monitoring virtual machine. Here's the simplest form of configuration:
{
    "version": 1,
    "secrets": {
        "telegrafPassword": {
            "keyvault": "https://mykeyvault.vault.azure.net/",
            "name": "sqlPassword"
        }
    },
    "parameters": {
        "sqlAzureConnections": [
            "Server=mysqlserver.database.windows.net;Port=1433;Database=mydatabase;User Id=telegraf;Password=$telegrafPassword;"
        ],
        "sqlVmConnections": [
        ],
        "sqlManagedInstanceConnections": [
        ]
    }
}
This configuration specifies the replacement tokens to be used in the profile configuration on your monitoring virtual machine. It also allows you to reference secrets from Azure Key Vault, so you don't have to keep secret values in any configuration (which we strongly recommend).
In this configuration, the database connection string includes a $telegrafPassword replacement token. SQL Insights replaces this token by the SQL authentication password retrieved from Key Vault. The Key Vault URI is specified in the telegrafPassword configuration section under secrets.
Secrets
Secrets are tokens whose values are retrieved at runtime from an Azure key vault. A secret is defined by a value pair that includes key vault URI and a secret name. This definition allows SQL Insights to get the value of the secret at runtime and use it in downstream configuration.
You can define as many secrets as needed, including secrets stored in multiple key vaults.
   "secrets": {
        "<secret-token-name-1>": {
            "keyvault": "<key-vault-uri>",
            "name": "<key-vault-secret-name>"
        },
        "<secret-token-name-2>": {
            "keyvault": "<key-vault-uri-2>",
            "name": "<key-vault-secret-name-2>"
        }
    }
The permission to access the key vault is provided to a managed identity on the monitoring virtual machine. This managed identity must be granted the Get permission on all Key Vault secrets referenced in the monitoring profile configuration. This can be done from the Azure portal, PowerShell, the Azure CLI, or an Azure Resource Manager template.
Parameters
Parameters are tokens that can be referenced in the profile configuration via JSON templates. Parameters have a name and a value. Values can be any JSON type, including objects and arrays. A parameter is referenced in the profile configuration by its name, using this convention: .Parameters.<name>.
Parameters can reference secrets in Key Vault by using the same convention. For example, sqlAzureConnections references the secret telegrafPassword by using the convention $telegrafPassword.
At runtime, all parameters and secrets will be resolved and merged with the profile configuration to construct the actual configuration to be used on the machine.
Note
The parameter names of sqlAzureConnections, sqlVmConnections, and sqlManagedInstanceConnections are all required in configuration, even if you don't provide connection strings for some of them.
Status: Collecting with errors
The monitoring machine will have the status Collecting with errors if there's at least one recent InsightsMetrics log but there are also errors in the Operation table.
SQL Insights uses the following queries to retrieve this information:
InsightsMetrics
    | extend Tags = todynamic(Tags)
    | extend SqlInstance = tostring(Tags.sql_instance)
    | where TimeGenerated > ago(240m) and isnotempty(SqlInstance) and Namespace == 'sqlserver_server_properties' and Name == 'uptime'
WorkloadDiagnosticLogs
| summarize Errors = countif(Status == 'Error')
Note
If you don't see any data in WorkloadDiagnosticLogs, you might need to update your monitoring profile. From within SQL Insights in Azure portal, select Manage profile > Edit profile > Update monitoring profile.
For common cases, we provide troubleshooting tips in our logs view:
Known issues
During preview of SQL Insights, you may encounter the following known issues.
'Login failed' error connecting to server or database
Using certain special characters in SQL authentication passwords saved in the monitoring VM configuration or in Key Vault may prevent the monitoring VM from connecting to a SQL server or database. This set of characters includes parentheses, square and curly brackets, the dollar sign, forward and back slashes, and dot (
[ { ( ) } ] $ \ / .).Spaces in the database connection string attributes may be replaced with special characters, leading to database connection failures. For example, if the space in the
User Idattribute is replaced with a special character, connections will fail with the Login failed for user '' error. To resolve, edit the monitoring profile configuration, and delete every special character appearing in place of a space. Some special characters may look indistinguishable from a space, thus you may want to delete every space character, type it again, and save the configuration.Data collection and visualization may not work if the OS computer name of the monitoring VM is different from the monitoring VM name.
A message "WLI extension on this machine is below the recommended version [...]" may incorrectly appear even when the WLI extension is up to date.
Best practices
Ensure access to Key Vault from the monitoring VM. If you use Key Vault to store SQL authentication passwords (strongly recommended), you need to ensure that network and security configuration allows the monitoring VM to access Key Vault. For more information, see Access Azure Key Vault behind a firewall and Configure Azure Key Vault networking settings. To verify that the monitoring VM can access Key Vault, you can execute the following commands from an SSH session connected to the VM. You should be able to successfully retrieve the access token and the secret. Replace
[YOUR-KEY-VAULT-URL],[YOUR-KEY-VAULT-SECRET], and[YOUR-KEY-VAULT-ACCESS-TOKEN]with actual values.# Get an access token for accessing Key Vault secrets curl 'http://[YOUR-KEY-VAULT-URL]/metadata/identity/oauth2/token?api-version=2018-02-01&resource=https%3A%2F%2Fvault.azure.net' -H Metadata:true # Get Key Vault secret curl 'https://[YOUR-KEY-VAULT-URL]/secrets/[YOUR-KEY-VAULT-SECRET]?api-version=2016-10-01' -H "Authorization: Bearer [YOUR-KEY-VAULT-ACCESS-TOKEN]"Update software on the monitoring VM. We strongly recommend periodically updating the operating system and extensions on the monitoring VM. If an extension supports automatic upgrade, enable that option.
Save previous configurations. If you want to make changes to either monitoring profile or monitoring VM configuration, we recommend saving a working copy of your configuration data first. From the SQL Insights page in Azure portal, select Manage profile > Edit profile, and copy the text from Current Monitoring Profile Config to a file. Similarly, select Manage profile > Configure for the monitoring VM, and copy the text from Current monitoring configuration to a file. If data collection errors occur after configuration changes, you can compare the new configuration to the known working configuration using a text diff tool to help you find any changes that might have impacted collection.
Next steps
- Get details on enabling SQL Insights (preview).
Tilbakemeldinger
Kommer snart: Gjennom 2024 faser vi ut GitHub Issues som tilbakemeldingsmekanisme for innhold, og erstatter det med et nytt system for tilbakemeldinger. Hvis du vil ha mer informasjon, kan du se: https://aka.ms/ContentUserFeedback.
Send inn og vis tilbakemelding for