Microsoft Edge (EdgeHTML) Developer Tools
Note
The new Microsoft Edge is built using Chromium, and starts at version 75. For more information, download the new Microsoft Edge, and try out the new Microsoft Edge (Chromium) Developer Tools.
The Microsoft Edge (EdgeHTML) DevTools are built with TypeScript, powered by open source, optimized for modern front-end workflows, and now available as a standalone Windows 10 app in the Microsoft Store!
For more on the latest features, check out DevTools in the latest update of Windows 10 (EdgeHTML 18).
Core tools

Microsoft Edge (EdgeHTML) DevTools
The Microsoft Edge (EdgeHTML) DevTools include:
- An Elements panel to edit HTML and CSS, inspect accessibility properties, view event listeners, and set DOM mutation breakpoints
- A Console to view and filter log messages, inspect JavaScript objects and DOM nodes, and run JavaScript in the context of the selected window or frame
- A Debugger to step through code, set watches and breakpoints, live edit your code, and inspect your web storage and cookie caches
- A Network panel to monitor and inspect requests and responses from the network and browser cache
- A Performance panel to profile the time and system resources required by your site
- A Memory panel to measure your use of memory resources and compare heap snapshots at different states of code runtime
- A Storage panel for inspecting and managing your web storage, IndexedDB, cookies and cache data
- A Service Workers panel for managing and debugging your service workers
- An Emulation panel to test your site with different browser profiles, screen resolutions, and GPS location coordinates
Please keep sending your feedback and feature requests!
Tip
Test on Microsoft Edge (EdgeHTML) free from any browser.
The Microsoft Edge team partnered with BrowserStack to provide free live and automated testing on Microsoft Edge (EdgeHTML).
Microsoft Store app
The Microsoft Edge (EdgeHTML) DevTools are now available as a standalone Windows 10 app from the Microsoft Store, in addition to the in-browser (F12) tooling experience. With the store version comes a chooser panel for attaching to open local and remote page targets and a tabbed layout for easy switching between DevTools instances.
Local debugging
To debug a page locally, simply launch the Microsoft Edge DevTools app. The Local panel of the chooser displays all of the active EdgeHTML content processes, including open Edge browser tabs, running PWAs (WWAHost.exe processes), and webview controls. Select your desired target to attach and open a new tab instance of the DevTools.
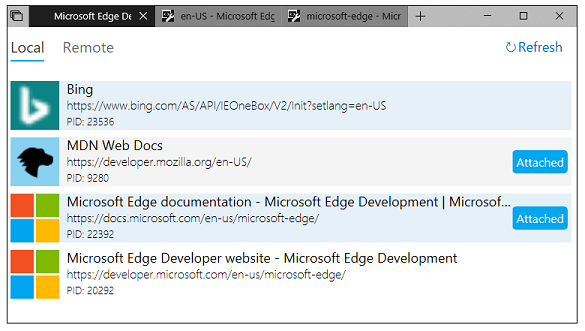
DevTools app Local panel
Remote debugging
The Microsoft Edge DevTools app introduces basic support for debugging pages on a remote machine via our newly released DevTools Protocol. With the latest release comes remote access to core functionality in the Debugger, Elements (for read-only operations), and Console panels. Remote debugging is limited to Microsoft Edge (EdgeHTML) running desktop hosts, with support for other EdgeHTML hosts and Windows 10 devices coming in future releases.
To get started, check out the Microsoft Edge DevTools section of the DevTools Protocol docs.
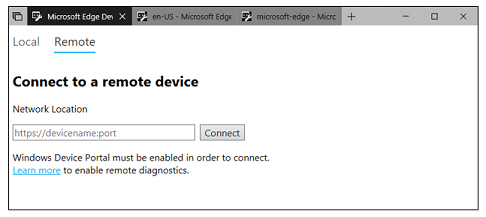
DevTools app Remote panel
General Shortcuts
Important
All shortcuts have been verified in the most recent version of Windows.
If you are unable to use a shortcut, please update your copy of Windows.
These shortcuts control the main DevTools window and should work across all tools.
| Action | Shortcut |
|---|---|
| Show/Hide DevTools (opens to last viewed panel) | F12, Ctrl+Shift+I |
| Toggle docking (Undock/Bottom/Right) | Ctrl+Shift+D |
| Open file | Ctrl+P, Ctrl+O |
| Show non-editable HTML source code in Debugger | Ctrl+U |
| Show/hide Console at the bottom of any other tool | Ctrl+` |
| Switch to Elements (DOM Explorer) | Ctrl+1 |
| Switch to Console | Ctrl+2 |
| Switch to Debugger | Ctrl+3 |
| Switch to Network | Ctrl+4 |
| Switch to Performance | Ctrl+5 |
| Switch to Memory | Ctrl+6 |
| Switch to Emulation | Ctrl+7 |
| Help Document | F1 |
| Next tool | Ctrl+F6 |
| Previous tool | Ctrl+Shift+F6 |
| Previous tool (from history) | Ctrl+Shift+[ |
| Next tool (from history) | Ctrl+Shift+] |
| Next Subframe | F6 |
| Previous Subframe | Shift+F6 |
| Next match in Search box | F3 |
| Previous match in Search box | Shift+F3 |
| Find in search box | Ctrl+F |
| Give focus to console at the bottom | Alt+Shift+I |
| Launch DevTools to Console | Ctrl+Shift+J |
| Refresh the page | Ctrl+Shift+F5, Ctrl+R |
Note
If you are debugging and paused at a breakpoint, the Refresh the page action resumes the runtime first.
Getting in touch with the Microsoft Edge DevTools team
Please send your feedback to help improve the Microsoft Edge (EdgeHTML) DevTools for you! Simply open the tools (F12) and select the Send feedback button.
Become a Windows Insider to preview the latest features coming to the DevTools. Use the Windows Feedback Hub app to post, up-vote, track and get support for general Windows suggestions and problems.