Debugging extensions
Note
This documentation is for extensions for the legacy version of Microsoft Edge. For information on the new Microsoft Edge, see Microsoft Edge (Chromium) Extensions.
Important
The new Microsoft Edge program is now open to accept chromium-based extensions for the new Microsoft Edge (v77 or later). If you want to submit a new extension, visit Publish to Microsoft Edge (Chromium) Add-ons Store to learn about the submission process.
With this announcement, Microsoft is no longer accepting new extensions for the legacy version of Microsoft Edge. If you own an Extension for the legacy version, you should begin the process of porting your Extension to the new Microsoft Edge. The new Microsoft Edge is based on Chromium, so Extensions designed for the legacy version of Microsoft Edge do not work with the new version.
You can debug your extensions in Microsoft Edge by using F12 Developer Tools.
The following video goes through a buggy Microsoft Edge extension, walking though each debugging scenario and fixing it up along the way. See the step-by-step instructions below for more info.
Note
In order to take advantage of extension debugging with F12, you must first turn on developer features in about:flags. See Adding and removing extensions for details on how to do this.
Background script debugging
To start debugging the background script of your extension:
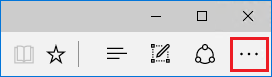
Click on More (...) followed by Extensions to go into the extension pane.
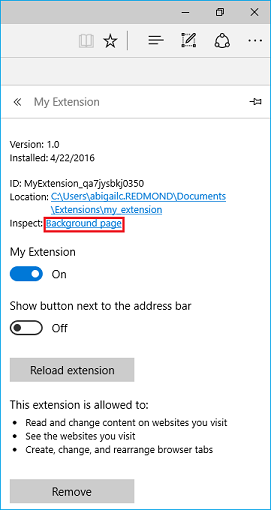
Click on the extension that you want to debug.
Click on the Background page link to bring up F12 for the background process.
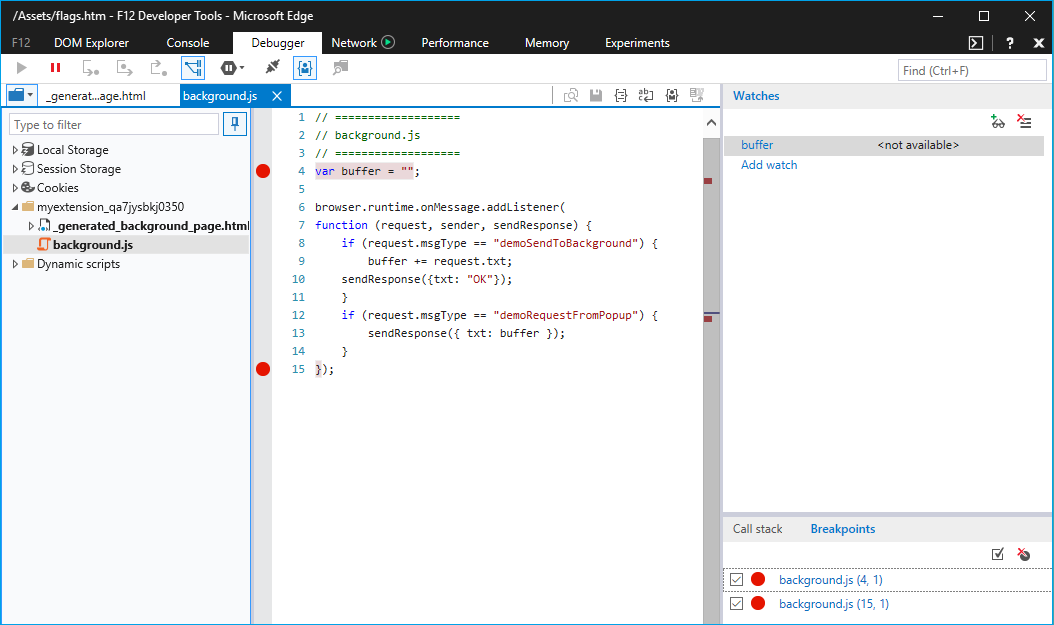
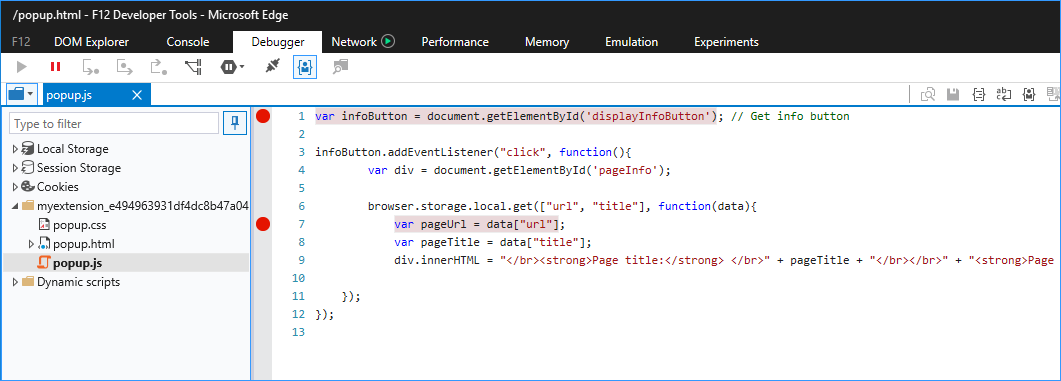
Select the Debugger tab in F12.
Navigate to and select your extension's background script.
Place breakpoints for debugging by clicking to the left of the source code line number.
Select the Console tab and execute the
location.reload()command. This will re-execute the background script, allowing you to step through your code.
Content script debugging
To start debugging the content script of your extension:
Launch F12 by either navigating to the More (...) button and selecting F12 Developer Tools or by pressing
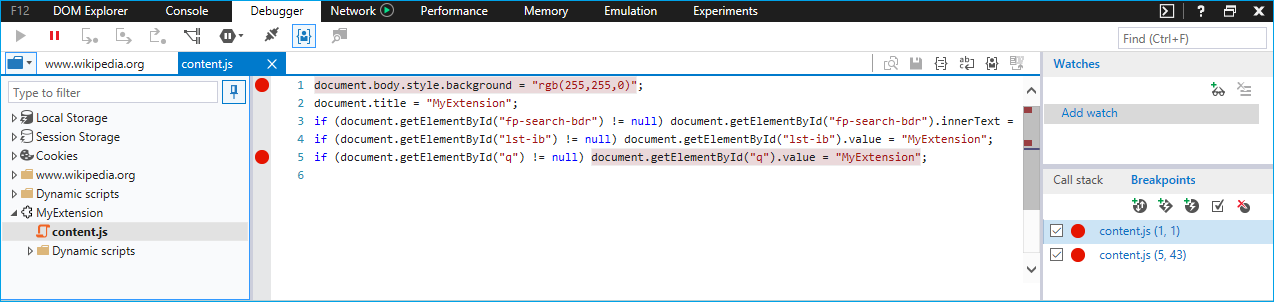
F12on your keyboard.Navigate to and select your extension's content script. Content scripts for extensions currently running will be depicted by a different folder for each extension.
Note
Only running content scripts will appear.
Place breakpoints for debugging by clicking to the left of the source code line number.
Refresh the browser tab to begin stepping though your code.
Extension page debugging
There are two methods that can be used for accessing the source code of your extension page for debugging. One method applies to a variety of pages while the other only works for popup pages.
Debugging any extension page
The following method works for all extension pages like the options page and popups:
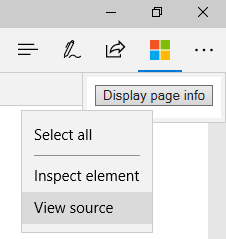
Right-click on the background of your page.
Select View source.
Once F12 opens, place breakpoints within the file you want to debug.
Select the Console tab and execute the command
location.reload(). This will re-execute the page script, allowing you to step through your code.
Debugging a popup extension page
While the method for debugging extension pages also applies to popup extension pages, the following steps outline another way to debug your popup:
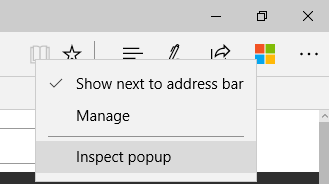
Right-click your extension's icon.
Select Inspect popup.
Follow steps 3 and 4 above for placing breakpoints and reloading the popup.