Realçar pontos de dados em visuais do Power BI
Este artigo descreve como realçar dados em visuais do Power BI.
Por padrão, sempre que um elemento é selecionado, a matriz values no objetodataView será filtrada apenas para os valores selecionados. Quando a matriz values é filtrada, todos os outros visuais na página mostram apenas os dados selecionados.
Se você definir a propriedade supportsHighlight em seu arquivo capabilities.json como true, receberá a matriz values completa sem filtro junto com uma matriz highlights. A matriz highlights terá o mesmo comprimento que a matriz de valores e quaisquer valores não selecionados serão definidos como null. Com essa propriedade habilitada, os dados apropriados no visual são realçados por meio da comparação da matriz values com a matriz highlights.


No exemplo, observe que:
- Sem o suporte a realce, a seleção é o único valor na matriz
valuese a única barra apresentada na exibição de dados. - Com o suporte a realce, todos os valores estão na matriz
values. A matrizhighlightscontém um valornullpara elementos não realçados. Todas as barras aparecem na exibição de dados e a barra realçada tem uma cor diferente.
Também pode haver várias seleções e realces parciais. Os valores realçados são apresentados na exibição de dados.
Observação
O mapeamento da exibição de dados de tabela não dá suporte ao recurso de destaques.
Realçar pontos de dados com mapeamento categórico de exibição de dados
Para os visuais com mapeamento categórico de exibição de dados, adicione "supportsHighlight": true ao arquivo capabilities.json. Por exemplo:
{
    "dataRoles": [
        {
            "displayName": "Category",
            "name": "category",
            "kind": "Grouping"
        },
        {
            "displayName": "Value",
            "name": "value",
            "kind": "Measure"
        }
    ],
    "dataViewMappings": [
        {
            "categorical": {
                "categories": {
                    "for": {
                        "in": "category"
                    }
                },
                "values": {
                    "for": {
                        "in": "value"
                    }
                }
            }
        }
    ],
    "supportsHighlight": true
}
Depois de remover o código desnecessário, o código-fonte visual padrão se parecerá com o seguinte exemplo:
"use strict";

// ... default imports list

import { FormattingSettingsService } from "powerbi-visuals-utils-formattingmodel";

import DataViewCategorical = powerbi.DataViewCategorical;
import DataViewCategoryColumn = powerbi.DataViewCategoryColumn;
import PrimitiveValue = powerbi.PrimitiveValue;
import DataViewValueColumn = powerbi.DataViewValueColumn;

import { VisualFormattingSettingsModel } from "./settings";

export class Visual implements IVisual {
    private target: HTMLElement;
    private formattingSettings: VisualFormattingSettingsModel;
    private formattingSettingsService: FormattingSettingsService;

    constructor(options: VisualConstructorOptions) {
        console.log('Visual constructor', options);
        this.formattingSettingsService = new FormattingSettingsService();
        this.target = options.element;
        this.host = options.host;
    }

    public update(options: VisualUpdateOptions) {
        this.formattingSettings = this.formattingSettingsService.populateFormattingSettingsModel(VisualFormattingSettingsModel, options.dataViews);
        console.log('Visual update', options);

    }

    // Returns properties pane formatting model content hierarchies, properties and latest formatting values, Then populate properties pane.
    // This method is called once every time we open properties pane or when the user edit any format property.
    public getFormattingModel(): powerbi.visuals.FormattingModel {
        return this.formattingSettingsService.buildFormattingModel(this.formattingSettings);
    }
}
Importe as interfaces necessárias para processar dados do Power BI:
import DataViewCategorical = powerbi.DataViewCategorical;
import DataViewCategoryColumn = powerbi.DataViewCategoryColumn;
import PrimitiveValue = powerbi.PrimitiveValue;
import DataViewValueColumn = powerbi.DataViewValueColumn;
Crie o elemento div raiz para valores de categoria:
export class Visual implements IVisual {
    private target: HTMLElement;
    private formattingSettings: VisualFormattingSettingsModel;
    private formattingSettingsService: FormattingSettingsService;

    private div: HTMLDivElement; // new property

    constructor(options: VisualConstructorOptions) {
        console.log('Visual constructor', options);
        this.formattingSettingsService = new FormattingSettingsService();
        this.target = options.element;
        this.host = options.host;

        // create div element
        this.div = document.createElement("div");
        this.div.classList.add("vertical");
        this.target.appendChild(this.div);

    }
    // ...
}
Limpe o conteúdo dos elementos div antes de renderizar novos dados:
// ...
public update(options: VisualUpdateOptions) {
    this.formattingSettings = this.formattingSettingsService.populateFormattingSettingsModel(VisualFormattingSettingsModel, options.dataViews);
    console.log('Visual update', options);

    while (this.div.firstChild) {
        this.div.removeChild(this.div.firstChild);
    }
    // ...
}
Obtenha categorias e valores de medida do objeto dataView:
public update(options: VisualUpdateOptions) {
    this.formattingSettings = this.formattingSettingsService.populateFormattingSettingsModel(VisualFormattingSettingsModel, options.dataViews);
    console.log('Visual update', options);

    while (this.div.firstChild) {
        this.div.removeChild(this.div.firstChild);
    }

    const dataView: DataView = options.dataViews[0];
    const categoricalDataView: DataViewCategorical = dataView.categorical;
    const categories: DataViewCategoryColumn = categoricalDataView.categories[0];
    const categoryValues = categories.values;

    const measures: DataViewValueColumn = categoricalDataView.values[0];
    const measureValues = measures.values;
    const measureHighlights = measures.highlights;
    // ...
}
Em que categoryValues é uma matriz de valores de categoria, measureValues é uma matriz de medidas e measureHighlights é composto das partes realçadas de valores.
Observação
Se os valores da propriedade measureHighlights forem menores que os valores da propriedade categoryValues, o valor será parcialmente realçado.
Enumere a matriz categoryValues e obtenha os valores e os destaques correspondentes:
// ...
const measureHighlights = measures.highlights;

categoryValues.forEach((category: PrimitiveValue, index: number) => {
    const measureValue = measureValues[index];
    const measureHighlight = measureHighlights && measureHighlights[index] ? measureHighlights[index] : null;
    console.log(category, measureValue, measureHighlight);

});
Crie os elementos div e p para exibir e visualizar valores de exibição de dados no DOM do visual:
categoryValues.forEach((category: PrimitiveValue, index: number) => {
    const measureValue = measureValues[index];
    const measureHighlight = measureHighlights && measureHighlights[index] ? measureHighlights[index] : null;
    console.log(category, measureValue, measureHighlight);

    // div element. it contains elements to display values and visualize value as progress bar
    let div = document.createElement("div");
    div.classList.add("horizontal");
    this.div.appendChild(div);

    // div element to visualize value of measure
    let barValue = document.createElement("div");
    barValue.style.width = +measureValue * 10 + "px";
    barValue.style.display = "flex";
    barValue.classList.add("value");

    // element to display category value
    let bp = document.createElement("p");
    bp.innerText = category.toString();

    // div element to visualize highlight of measure
    let barHighlight = document.createElement("div");
    barHighlight.classList.add("highlight")
    barHighlight.style.backgroundColor = "blue";
    barHighlight.style.width = +measureHighlight * 10 + "px";

    // element to display highlighted value of measure
    let p = document.createElement("p");
    p.innerText = `${measureHighlight}/${measureValue}`;
    barHighlight.appendChild(bp);

    div.appendChild(barValue);

    barValue.appendChild(barHighlight);
    div.appendChild(p);
});
Aplique os estilos necessários para que os elementos usem flexbox e defina as cores para elementos div:
div.vertical {
    display: flex;
    flex-direction: column;
}

div.horizontal {
    display: flex;
    flex-direction: row;
}

div.highlight {
    background-color: blue
}

div.value {
    background-color: red;
    display: flex;
}
A seguinte exibição do visual é o resultado:
Realçar pontos de dados com mapeamento de exibição de dados de matriz
Para visuais com mapeamento de exibição de dados de matriz, adicione "supportsHighlight": true ao arquivo capabilities.json. Por exemplo:
{
    "dataRoles": [
        {
            "displayName": "Columns",
            "name": "columns",
            "kind": "Grouping"
        },
        {
            "displayName": "Rows",
            "name": "rows",
            "kind": "Grouping"
        },
        {
            "displayName": "Value",
            "name": "value",
            "kind": "Measure"
        }
    ],
    "dataViewMappings": [
        {
            "matrix": {
                "columns": {
                    "for": {
                        "in": "columns"
                    }
                },
                "rows": {
                    "for": {
                        "in": "rows"
                    }
                },
                "values": {
                    "for": {
                        "in": "value"
                    }
                }
            }
        }
    ],
    "supportsHighlight": true
}
Os dados de exemplo para criar a hierarquia para o mapeamento de exibição de dados de matriz:
| Row1 | Row2 | Row3 | Column1 | Column2 | Column3 | Valores |
|---|---|---|---|---|---|---|
| R1 | R11 | R111 | C1 | C11 | C111 | 1 |
| R1 | R11 | R112 | C1 | C11 | C112 | 2 |
| R1 | R11 | R113 | C1 | C11 | C113 | 3 |
| R1 | R12 | R121 | C1 | C12 | C121 | 4 |
| R1 | R12 | R122 | C1 | C12 | C122 | 5 |
| R1 | R12 | R123 | C1 | C12 | C123 | 6 |
| R1 | R13 | R131 | C1 | C13 | C131 | 7 |
| R1 | R13 | R132 | C1 | C13 | C132 | 8 |
| R1 | R13 | R133 | C1 | C13 | C133 | 9 |
| R2 | R21 | R211 | C2 | C21 | C211 | 10 |
| R2 | R21 | R212 | C2 | C21 | C212 | 11 |
| R2 | R21 | R213 | C2 | C21 | C213 | 12 |
| R2 | R22 | R221 | C2 | C22 | C221 | 13 |
| R2 | R22 | R222 | C2 | C22 | C222 | 14 |
| R2 | R22 | R223 | C2 | C22 | C223 | 16 |
| R2 | R23 | R231 | C2 | C23 | C231 | 17 |
| R2 | R23 | R232 | C2 | C23 | C232 | 18 |
| R2 | R23 | R233 | C2 | C23 | C233 | 19 |
Crie o projeto visual padrão e aplique o exemplo do arquivo capabilities.json.
Depois de remover o código desnecessário, o código-fonte visual padrão se parece com o seguinte exemplo:
"use strict";

// ... default imports

import { FormattingSettingsService } from "powerbi-visuals-utils-formattingmodel";
import { VisualFormattingSettingsModel } from "./settings";

export class Visual implements IVisual {
    private target: HTMLElement;
    private formattingSettings: VisualFormattingSettingsModel;
    private formattingSettingsService: FormattingSettingsService;

    constructor(options: VisualConstructorOptions) {
        console.log('Visual constructor', options);
        this.formattingSettingsService = new FormattingSettingsService();
        this.target = options.element;
        this.host = options.host;
    }

    public update(options: VisualUpdateOptions) {
        this.formattingSettings = this.formattingSettingsService.populateFormattingSettingsModel(VisualFormattingSettingsModel, options.dataViews);
        console.log('Visual update', options);

    }

   /**
     * Returns properties pane formatting model content hierarchies, properties and latest formatting values, Then populate properties pane.
     * This method is called once every time we open properties pane or when the user edit any format property.
     */
    public getFormattingModel(): powerbi.visuals.FormattingModel {
        return this.formattingSettingsService.buildFormattingModel(this.formattingSettings);
    }
}
Importe as interfaces necessárias para processar dados do Power BI:
import DataViewMatrix = powerbi.DataViewMatrix;
import DataViewMatrixNode = powerbi.DataViewMatrixNode;
import DataViewHierarchyLevel = powerbi.DataViewHierarchyLevel;
Crie dois elementos div para o layout visual:
constructor(options: VisualConstructorOptions) {
    // ...
    this.rowsDiv = document.createElement("div");
    this.target.appendChild(this.rowsDiv);

    this.colsDiv = document.createElement("div");
    this.target.appendChild(this.colsDiv);
    this.target.style.overflowY = "auto";
}
Verifique os dados no método update para garantir que o visual obtenha os dados:
public update(options: VisualUpdateOptions) {
    this.formattingSettings = this.formattingSettingsService.populateFormattingSettingsModel(VisualFormattingSettingsModel, options.dataViews);
    console.log('Visual update', options);

    const dataView: DataView = options.dataViews[0];
    const matrixDataView: DataViewMatrix = dataView.matrix;

    if (!matrixDataView ||
        !matrixDataView.columns ||
        !matrixDataView.rows ) {
        return
    }
    // ...
}
Limpe o conteúdo dos elementos div antes de renderizar novos dados:
public update(options: VisualUpdateOptions) {
    // ...

    // remove old elements
    // to better performance use D3js pattern:
    // https://d3js.org/#enter-exit
    while (this.rowsDiv.firstChild) {
        this.rowsDiv.removeChild(this.rowsDiv.firstChild);
    }
    const prow = document.createElement("p");
    prow.innerText = "Rows";
    this.rowsDiv.appendChild(prow);

    while (this.colsDiv.firstChild) {
        this.colsDiv.removeChild(this.colsDiv.firstChild);
    }
    const pcol = document.createElement("p");
    pcol.innerText = "Columns";
    this.colsDiv.appendChild(pcol);
    // ...
}
Crie a função treeWalker para percorrer a estrutura de dados da matriz:
public update(options: VisualUpdateOptions) {
    // ...
    const treeWalker = (matrixNode: DataViewMatrixNode, index: number, levels: DataViewHierarchyLevel[], div: HTMLDivElement)  => {

    }
    // ...
}
Em que matrixNode é o nó atual, levels são colunas de metadados desse nível de hierarquia, div – elemento pai para elementos HTML filho.
A treeWalker é a função recursiva, é necessário criar o elemento div e p para o texto como um cabeçalho e chamar a função para elementos filho do nó:
public update(options: VisualUpdateOptions) {
    // ...
    const treeWalker = (matrixNode: DataViewMatrixNode, index: number, levels: DataViewHierarchyLevel[], div: HTMLDivElement)  => {
        // ...

        if (matrixNode.children) {
            const childDiv = document.createElement("div");
            childDiv.classList.add("vertical");
            div.appendChild(childDiv);

            const p = document.createElement("p");
            const level = levels[matrixNode.level]; // get current level column metadata from current node
            p.innerText = level.sources[level.sources.length - 1].displayName; // get column name from metadata

            childDiv.appendChild(p); // add paragraph element to div element
            matrixNode.children.forEach((node, index) => treeWalker(node, levels, childDiv, ++levelIndex));
        }
    }
    // ...
}
Chame a função para elementos raiz da coluna e linha da estrutura da exibição de dados de matriz:
public update(options: VisualUpdateOptions) {
    // ...
    const treeWalker = (matrixNode: DataViewMatrixNode, index: number, levels: DataViewHierarchyLevel[], div: HTMLDivElement)  => {
        // ...
    }
    // ...
    // remove old elements
    // ...

    // ...
    const rowRoot: DataViewMatrixNode = matrixDataView.rows.root;
    rowRoot.children.forEach((node) => treeWalker(node, matrixDataView.rows.levels, this.rowsDiv));

    const colRoot = matrixDataView.columns.root;
    colRoot.children.forEach((node) => treeWalker(node, matrixDataView.columns.levels, this.colsDiv));
}
Gere selectionID para os nós e crie botões para exibir os nós:
public update(options: VisualUpdateOptions) {
    // ...
    const treeWalker = (matrixNode: DataViewMatrixNode, index: number, levels: DataViewHierarchyLevel[], div: HTMLDivElement)  => {
        const selectionID: ISelectionID = this.host.createSelectionIdBuilder()
            .withMatrixNode(matrixNode, levels)
            .createSelectionId();

        let nodeBlock = document.createElement("button");
        nodeBlock.innerText = matrixNode.value.toString();

        nodeBlock.addEventListener("click", (event) => {
            // call select method in the selection manager
            this.selectionManager.select(selectionID);
        });

        nodeBlock.addEventListener("contextmenu", (event) => {
            // call showContextMenu method to display context menu on the visual
            this.selectionManager.showContextMenu(selectionID, {
                x: event.clientX,
                y: event.clientY
            });
            event.preventDefault();
        });
        // ...
    }
    // ...
}
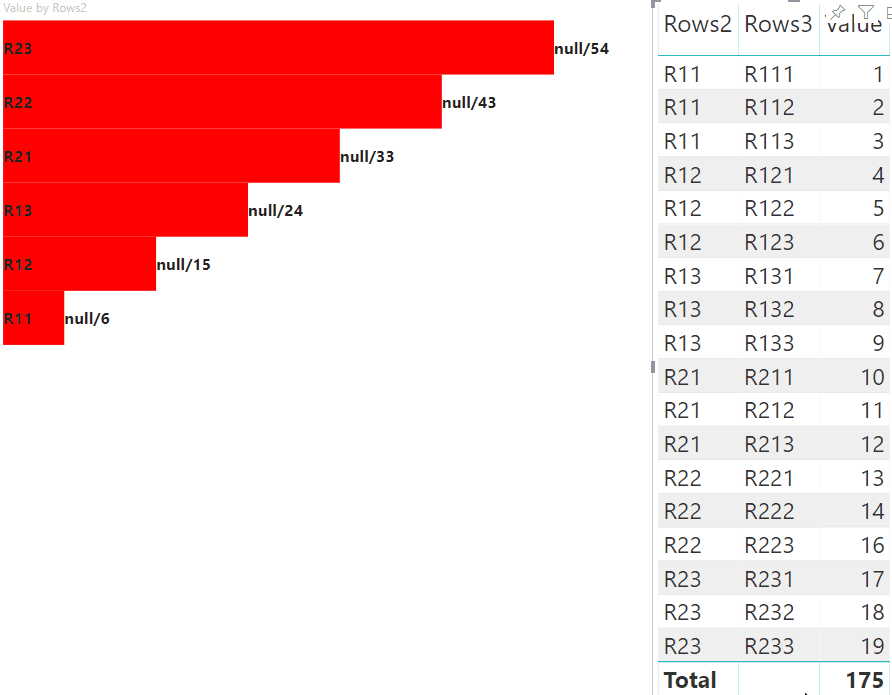
A etapa principal de usar o realce é processar uma matriz adicional de valores.
O objeto do nó de terminal tem duas propriedades para a matriz de valores, valor e realce:
JSON.stringify(options.dataViews[0].matrix.rows.root.children[0].children[0].children[0], null, " ");
{
 "level": 2,
 "levelValues": [
  {
   "value": "R233",
   "levelSourceIndex": 0
  }
 ],
 "value": "R233",
 "identity": {
  "identityIndex": 2
 },
 "values": {
  "0": {
   "value": null,
   "highlight": null
  },
  "1": {
   "value": 19,
   "highlight": 19
  }
 }
}
Em que value representa o valor do nó sem aplicar uma seleção de outro visual, highlight indica qual parte dos dados foi realçada.
Observação
Se o valor de highlight for menor do que o valor de value, isso significa que value foi realçado parcialmente.
Adicione o código para processar a matriz values do nó se ela for apresentada:
public update(options: VisualUpdateOptions) {
    // ...
    const treeWalker = (matrixNode: DataViewMatrixNode, index: number, levels: DataViewHierarchyLevel[], div: HTMLDivElement)  => {
        // ...

        if (matrixNode.values) {
            const sumOfValues = Object.keys(matrixNode.values) // get key property of object (value are 0 to N)
                .map(key => +matrixNode.values[key].value) // convert key property to number
                .reduce((prev, curr) => prev + curr) // sum of values

            let sumOfHighlights = sumOfValues;
            sumOfHighlights = Object.keys(matrixNode.values) // get key property of object (value are 0 to N)
                .map(key => matrixNode.values[key].highlight ? +matrixNode.values[key].highlight : null ) // convert key property to number if it exists
                .reduce((prev, curr) => curr ? prev + curr : null) // convert key property to number

            // create div container for value and highlighted value
            const vals = document.createElement("div");
            vals.classList.add("vertical")
            vals.classList.replace("vertical", "horizontal");
            // create paragraph element for label
            const highlighted = document.createElement("p");
            // Display complete value and highlighted value
            highlighted.innerText = `${sumOfHighlights}/${sumOfValues}`;

            // create div container for value
            const valueDiv = document.createElement("div");
            valueDiv.style.width = sumOfValues * 10 + "px";
            valueDiv.classList.add("value");

            // create div container for highlighted values
            const highlightsDiv = document.createElement("div");
            highlightsDiv.style.width = sumOfHighlights * 10 + "px";
            highlightsDiv.classList.add("highlight");
            valueDiv.appendChild(highlightsDiv);

            // append button and paragraph to div containers to parent div
            vals.appendChild(nodeBlock);
            vals.appendChild(valueDiv);
            vals.appendChild(highlighted);
            div.appendChild(vals);
        } else {
            div.appendChild(nodeBlock);
        }

        if (matrixNode.children) {
            // ...
        }
    }
    // ...
}
O resultado é um visual com botões e valores, como highlighted value/default value.

Próximas etapas
Comentários
Em breve: Ao longo de 2024, eliminaremos os problemas do GitHub como o mecanismo de comentários para conteúdo e o substituiremos por um novo sistema de comentários. Para obter mais informações, consulte https://aka.ms/ContentUserFeedback.
Enviar e exibir comentários de