How to: Add and Delete Counters on Graphs in Load Test Results
Applies to: ![]() Visual Studio
Visual Studio ![]() Visual Studio for Mac
Visual Studio for Mac
Note
This article applies to Visual Studio 2017. If you're looking for the latest Visual Studio documentation, see Visual Studio documentation. We recommend upgrading to the latest version of Visual Studio. Download it here
You can use the Counters panel to add performance counters to a graph.
Note
Web performance and load test functionality is deprecated. Visual Studio 2019 is the last version where web performance and load testing will be fully available. For more information, see the Cloud-based load testing service end of life blog post. To reduce the impact on users some minimum support is still available in Visual Studio 2022 Preview 3 or later. Users should also note web performance and load test functionality only supports Internet Explorer which is not available on Windows 11 and some versions of Windows 10. Read more on Internet Explorer Lifecycle policy.
Performance Counter Sampling Interval Considerations
Choose a value for the Sample Rate property in the load test run settings based on the length of your load test. A smaller sample rate, such as the default value of five seconds, requires more space in the load test results database. For longer load tests, increasing the sample rate reduces the amount of data that you collect. For more information, see How to: Specify the sample rate.
Here are some guidelines for sample rates:
| Load Test Duration | Recommended Sample Rate |
|---|---|
| < 1 Hour | 5 seconds |
| 1 - 8 Hours | 15 seconds |
| 8 - 24 Hours | 30 seconds |
| > 24 Hours | 60 seconds |
Considerations for including Timing Details to Collect Percentile Data
There is a property in the run settings in the Load Test Editor named Timing Details Storage. If the Timing Details Storage property is enabled, then the time to execute each individual test, transaction, and page during the load test will be stored in the load test results repository. This allows for 90th and 95th percentile data to be shown in the Load Test Analyzer in the Tests, Transactions, and Pages tables.
There are two choices for enabling the Timing Details Storage property in the run settings properties named StatisticsOnly and AllIndividualDetails. With either option, all the individual tests, pages, and transactions are timed, and percentile data is calculated from the individual timing data. The difference is that with the StatisticsOnly option, as soon as the percentile data has been calculated, the individual timing data is deleted from the repository. This reduces the amount of space that is required in the repository when you use timing details. However, advanced users might want to process the timing detail data in other ways, by using SQL tools. If this is the case, the AllIndividualDetails option should be used so that the timing detail data is available for that processing. Additionally, if you set the property to AllIndividualDetails, then you can analyze the virtual user activity using the Virtual User Activity chart in the Load Test Analyzer after the load test completes running. For more information, see Analyze virtual user activity in the Details view.
The amount of space that is required in the load test results repository to store the timing details data could be very large, especially for longer running load tests. Also, the time to store this data in the load test results repository at the end of the load test is longer because this data is stored on the load test agents until the load test has finished executing. When the load test finishes, the data is stored into the repository. By default, the Timing Details Storage property is enabled. If this is an issue for your testing environment, you might want to set the Timing Details Storage to None.
For more information, see How to: Specify the timing details storage property.
To display a particular performance counter on a load test graph
After a load test is finished, or after you load a test result, in the Load Test Analyzer's toolbar, choose Graphs.
The Counters panel is displayed in the Graphs view.
Note
If the Counters panel is not visible, choose Show Counters Panel on the toolbar.
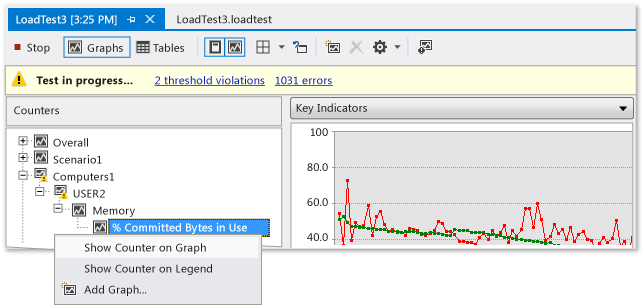
In the Counters panel, expand nodes in the hierarchy until you find the performance counter that you want to see displayed graphically.
For example, to display the available memory on a computer where tests are running, expand Computers, expand the node for the computer, and then expand Memory. You will see the Available MBytes counter.
Choose the graph on which you want to display the performance counter.
Right-click the performance counter in the Counters panel and select Show Counter on Graph.
Tip
To temporarily stop displaying the performance counter's data on the graph, clear the check box for the performance counter in the Legend. This allows the min, max and average statistics to still be analyzed without viewing the trend line on the graph. This can be useful if the graph contains several overlapping performance counter plots while you are analyzing issues. For more information, see Use the Graphs view legend to analyze load tests.
To remove the performance counter data from the graph, right-click the performance counter in the Counter column of the legend and select Delete.
- or -
Right-click the data line in the graph and select Delete.
- or -
Choose the performance counter in the Counter column of the legend or the data line in the graph, and then press the Delete key.
Note
You can also choose to place a performance counter on the legend but not on the graph by using the Add Counter on Legend command.