Tutorial: Debug a .NET console application using Visual Studio Code
This tutorial introduces the debugging tools available in Visual Studio Code for working with .NET apps.
Prerequisites
- This tutorial works with the console app that you create in Create a .NET console application using Visual Studio Code.
Use Debug build configuration
Debug and Release are .NET's built-in build configurations. You use the Debug build configuration for debugging and the Release configuration for the final release distribution.
In the Debug configuration, a program compiles with full symbolic debug information and no optimization. Optimization complicates debugging, because the relationship between source code and generated instructions is more complex. The release configuration of a program has no symbolic debug information and is fully optimized.
By default, Visual Studio Code launch settings use the Debug build configuration, so you don't need to change it before debugging.
Start Visual Studio Code.
Open the folder of the project that you created in Create a .NET console application using Visual Studio Code.
Set a breakpoint
A breakpoint temporarily interrupts the execution of the application before the line with the breakpoint is run.
Open the Program.cs file.
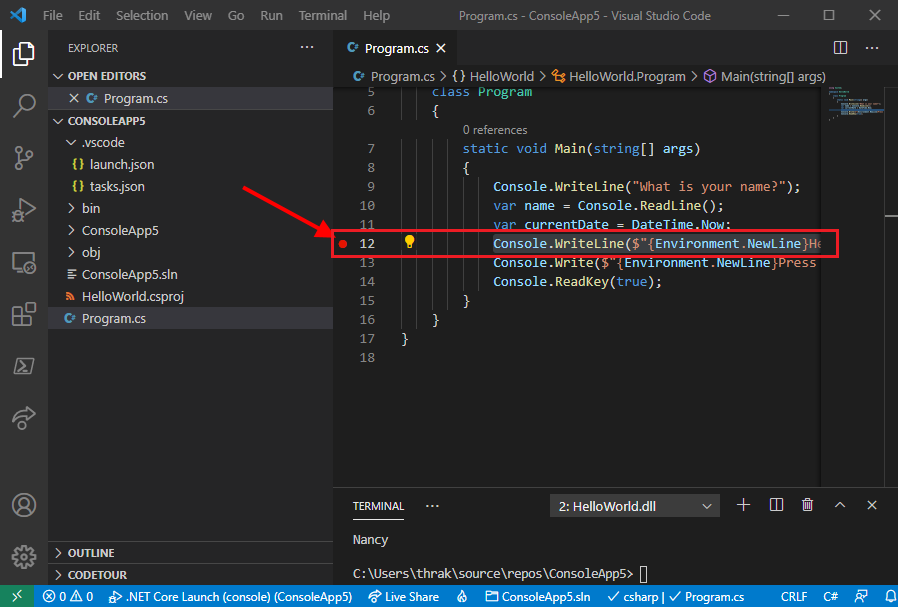
Set a breakpoint on the line that displays the name, date, and time, by clicking in the left margin of the code window. The left margin is to the left of the line numbers. Other ways to set a breakpoint are by pressing F9 or choosing Run > Toggle Breakpoint from the menu while the line of code is selected.
Visual Studio Code indicates the line on which the breakpoint is set by displaying a red dot in the left margin.
Set up for terminal input
The breakpoint is located after a Console.ReadLine method call. The Debug Console doesn't accept terminal input for a running program. To handle terminal input while debugging, you can use the integrated terminal (one of the Visual Studio Code windows) or an external terminal. For this tutorial, you use the integrated terminal.
The project folder contains a .vscode folder. Open the launch.json file that's in the .vscode folder.
In launch.json, change the
consolesetting frominternalConsoletointegratedTerminal:"console": "integratedTerminal",Save your changes.
Start debugging
Open the Debug view by selecting the Debugging icon on the left side menu.
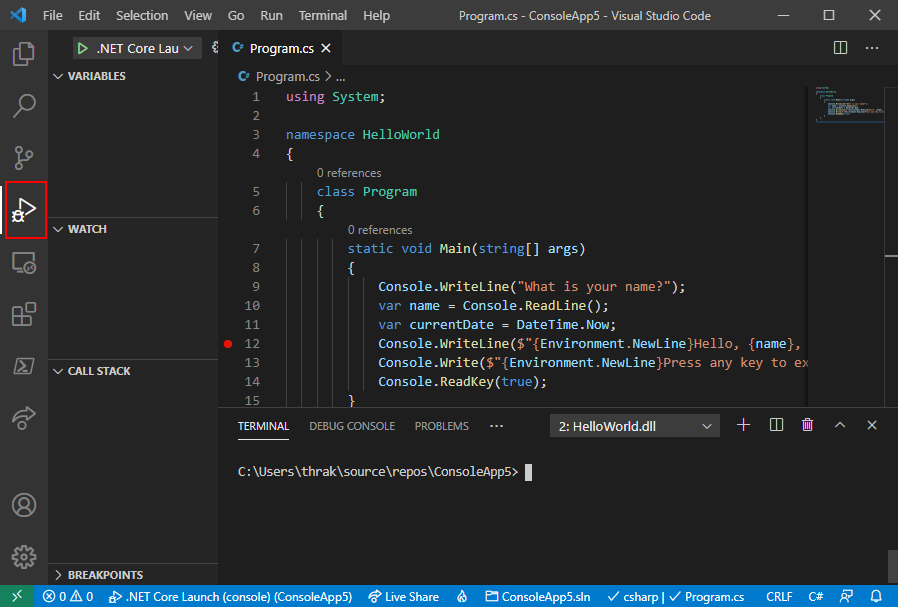
Select the green arrow at the top of the pane, next to .NET Core Launch (console). Other ways to start the program in debugging mode are by pressing F5 or choosing Run > Start Debugging from the menu.

Select the Terminal tab to see the "What is your name?" prompt that the program displays before waiting for a response.
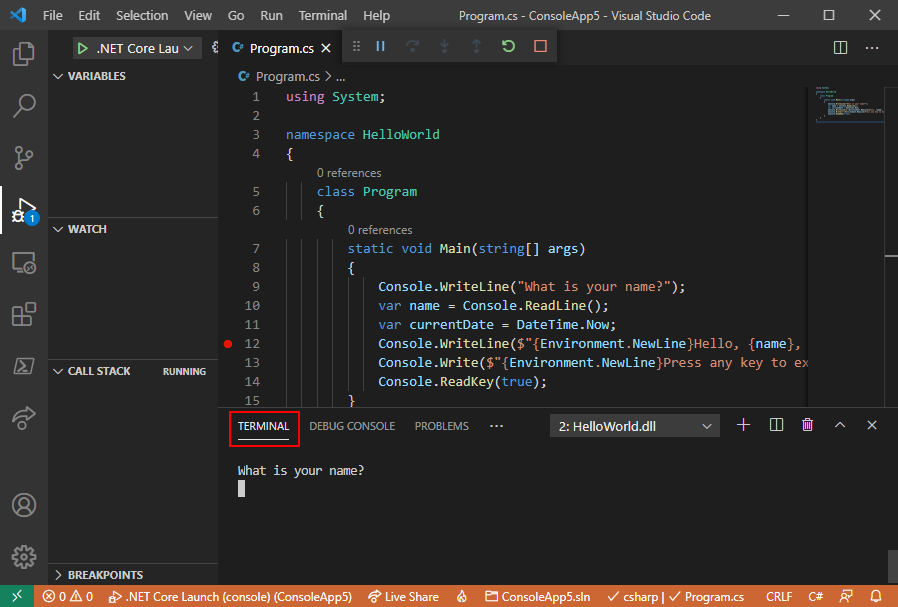
Enter a string in the Terminal window in response to the prompt for a name, and then press Enter.
Program execution stops when it reaches the breakpoint and before the
Console.WriteLinemethod runs. The Locals section of the Variables window displays the values of variables that are defined in the currently running method.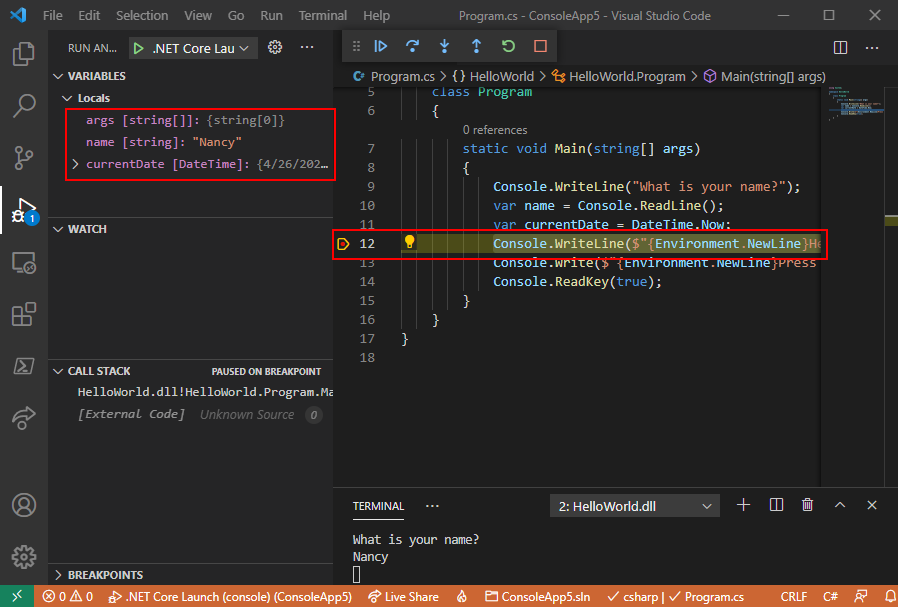
Use the Debug Console
The Debug Console window lets you interact with the application you're debugging. You can change the value of variables to see how it affects your program.
Select the Debug Console tab.
Enter
name = "Gracie"at the prompt at the bottom of the Debug Console window and press the Enter key.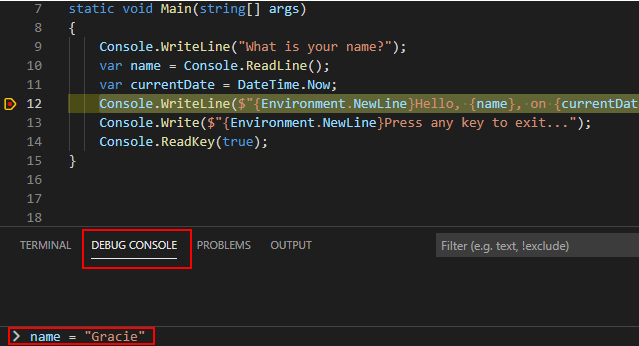
Enter
currentDate = DateTime.Parse("2019-11-16T17:25:00Z").ToUniversalTime()at the bottom of the Debug Console window and press the Enter key.The Variables window displays the new values of the
nameandcurrentDatevariables.Continue program execution by selecting the Continue button in the toolbar. Another way to continue is by pressing F5.

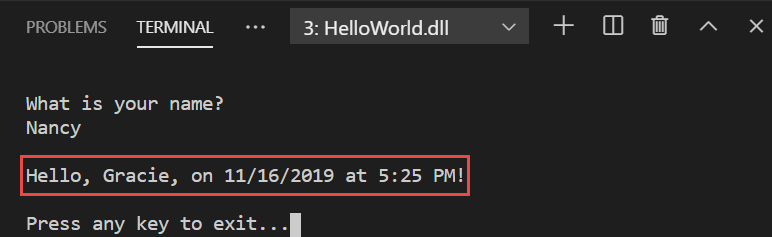
Select the Terminal tab again.
The values displayed in the console window correspond to the changes you made in the Debug Console.
Press any key to exit the application and stop debugging.
Set a conditional breakpoint
The program displays the string that the user enters. What happens if the user doesn't enter anything? You can test this with a useful debugging feature called a conditional breakpoint.
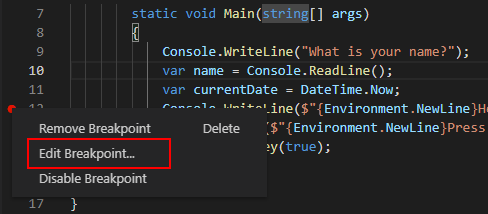
Right-click (Ctrl-click on macOS) on the red dot that represents the breakpoint. In the context menu, select Edit Breakpoint to open a dialog that lets you enter a conditional expression.
Select
Expressionin the drop-down, enter the following conditional expression, and press Enter.String.IsNullOrEmpty(name)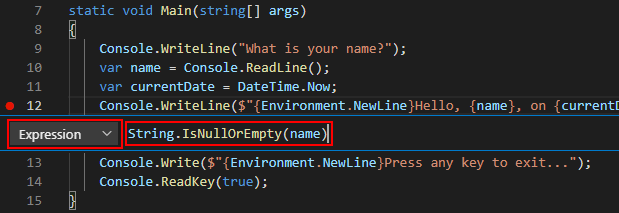
Each time the breakpoint is hit, the debugger calls the
String.IsNullOrEmpty(name)method, and it breaks on this line only if the method call returnstrue.Instead of a conditional expression, you can specify a hit count, which interrupts program execution before a statement is run a specified number of times. Another option is to specify a filter condition, which interrupts program execution based on such attributes as a thread identifier, process name, or thread name.
Start the program with debugging by pressing F5.
In the Terminal tab, press the Enter key when prompted to enter your name.
Because the condition you specified (
nameis eithernullor String.Empty) has been satisfied, program execution stops when it reaches the breakpoint and before theConsole.WriteLinemethod runs.The Variables window shows that the value of the
namevariable is"", or String.Empty.Confirm the value is an empty string by entering the following statement at the Debug Console prompt and pressing Enter. The result is
true.name == String.EmptySelect the Continue button on the toolbar to continue program execution.
Select the Terminal tab, and press any key to exit the program and stop debugging.
Clear the breakpoint by clicking on the dot in the left margin of the code window. Other ways to clear a breakpoint are by pressing F9 or choosing Run > Toggle Breakpoint from the menu while the line of code is selected.
If you get a warning that the breakpoint condition will be lost, select Remove Breakpoint.
Step through a program
Visual Studio Code also allows you to step line by line through a program and monitor its execution. Ordinarily, you'd set a breakpoint and follow program flow through a small part of your program code. Since this program is small, you can step through the entire program.
Set a breakpoint on the opening curly brace of the
Mainmethod.Press F5 to start debugging.
Visual Studio Code highlights the breakpoint line.
At this point, the Variables window shows that the
argsarray is empty, andnameandcurrentDatehave default values.Select Run > Step Into or press F11.

Visual Studio Code highlights the next line.
Select Run > Step Into or press F11.
Visual Studio Code runs the
Console.WriteLinefor the name prompt and highlights the next line of execution. The next line is theConsole.ReadLinefor thename. The Variables window is unchanged, and the Terminal tab shows the "What is your name?" prompt.Select Run > Step Into or press F11.
Visual Studio highlights the
namevariable assignment. The Variables window shows thatnameis stillnull.Respond to the prompt by entering a string in the Terminal tab and pressing Enter.
The Terminal tab might not display the string you enter while you're entering it, but the Console.ReadLine method will capture your input.
Select Run > Step Into or press F11.
Visual Studio Code highlights the
currentDatevariable assignment. The Variables window shows the value returned by the call to the Console.ReadLine method. The Terminal tab displays the string you entered at the prompt.Select Run > Step Into or press F11.
The Variables window shows the value of the
currentDatevariable after the assignment from the DateTime.Now property.Select Run > Step Into or press F11.
Visual Studio Code calls the Console.WriteLine(String, Object, Object) method. The console window displays the formatted string.
Select Run > Step Out or press Shift+F11.

Select the Terminal tab.
The terminal displays "Press any key to exit..."
Press any key to exit the program.
Use Release build configuration
Once you've tested the Debug version of your application, you should also compile and test the Release version. The Release version incorporates compiler optimizations that can affect the behavior of an application. For example, compiler optimizations that are designed to improve performance can create race conditions in multithreaded applications.
To build and test the Release version of your console application, open the Terminal and run the following command:
dotnet run --configuration Release
Additional resources
Next steps
In this tutorial, you used Visual Studio Code debugging tools. In the next tutorial, you publish a deployable version of the app.
This tutorial introduces the debugging tools available in Visual Studio Code for working with .NET apps.
Prerequisites
- This tutorial works with the console app that you create in Create a .NET console application using Visual Studio Code.
Use Debug build configuration
Debug and Release are .NET's built-in build configurations. You use the Debug build configuration for debugging and the Release configuration for the final release distribution.
In the Debug configuration, a program compiles with full symbolic debug information and no optimization. Optimization complicates debugging, because the relationship between source code and generated instructions is more complex. The release configuration of a program has no symbolic debug information and is fully optimized.
By default, Visual Studio Code launch settings use the Debug build configuration, so you don't need to change it before debugging.
Start Visual Studio Code.
Open the folder of the project that you created in Create a .NET console application using Visual Studio Code.
Set a breakpoint
A breakpoint temporarily interrupts the execution of the application before the line with the breakpoint is run.
Open the Program.cs file.
Set a breakpoint on the line that displays the name, date, and time, by clicking in the left margin of the code window. The left margin is to the left of the line numbers. Other ways to set a breakpoint are by pressing F9 or choosing Run > Toggle Breakpoint from the menu while the line of code is selected.
Visual Studio Code indicates the line on which the breakpoint is set by displaying a red dot in the left margin.
Set up for terminal input
The breakpoint is located after a Console.ReadLine method call. The Debug Console doesn't accept terminal input for a running program. To handle terminal input while debugging, you can use the integrated terminal (one of the Visual Studio Code windows) or an external terminal. For this tutorial, you use the integrated terminal.
The project folder contains a .vscode folder. Open the launch.json file that's in the .vscode folder.
In launch.json, change the
consolesetting frominternalConsoletointegratedTerminal:"console": "integratedTerminal",Save your changes.
Start debugging
Open the Debug view by selecting the Debugging icon on the left side menu.
Select the green arrow at the top of the pane, next to .NET Core Launch (console). Other ways to start the program in debugging mode are by pressing F5 or choosing Run > Start Debugging from the menu.
Select the Terminal tab to see the "What is your name?" prompt that the program displays before waiting for a response.
Enter a string in the Terminal window in response to the prompt for a name, and then press Enter.
Program execution stops when it reaches the breakpoint and before the
Console.WriteLinemethod runs. The Locals section of the Variables window displays the values of variables that are defined in the currently running method.
Use the Debug Console
The Debug Console window lets you interact with the application you're debugging. You can change the value of variables to see how it affects your program.
Select the Debug Console tab.
Enter
name = "Gracie"at the prompt at the bottom of the Debug Console window and press the Enter key.
Enter
currentDate = DateTime.Parse("2019-11-16T17:25:00Z").ToUniversalTime()at the bottom of the Debug Console window and press the Enter key.The Variables window displays the new values of the
nameandcurrentDatevariables.Continue program execution by selecting the Continue button in the toolbar. Another way to continue is by pressing F5.
Select the Terminal tab again.
The values displayed in the console window correspond to the changes you made in the Debug Console.
Press any key to exit the application and stop debugging.
Set a conditional breakpoint
The program displays the string that the user enters. What happens if the user doesn't enter anything? You can test this with a useful debugging feature called a conditional breakpoint.
Right-click (Ctrl-click on macOS) on the red dot that represents the breakpoint. In the context menu, select Edit Breakpoint to open a dialog that lets you enter a conditional expression.
Select
Expressionin the drop-down, enter the following conditional expression, and press Enter.String.IsNullOrEmpty(name)
Each time the breakpoint is hit, the debugger calls the
String.IsNullOrEmpty(name)method, and it breaks on this line only if the method call returnstrue.Instead of a conditional expression, you can specify a hit count, which interrupts program execution before a statement is run a specified number of times. Another option is to specify a filter condition, which interrupts program execution based on such attributes as a thread identifier, process name, or thread name.
Start the program with debugging by pressing F5.
In the Terminal tab, press the Enter key when prompted to enter your name.
Because the condition you specified (
nameis eithernullor String.Empty) has been satisfied, program execution stops when it reaches the breakpoint and before theConsole.WriteLinemethod runs.The Variables window shows that the value of the
namevariable is"", or String.Empty.Confirm the value is an empty string by entering the following statement at the Debug Console prompt and pressing Enter. The result is
true.name == String.EmptySelect the Continue button on the toolbar to continue program execution.
Select the Terminal tab, and press any key to exit the program and stop debugging.
Clear the breakpoint by clicking on the dot in the left margin of the code window. Other ways to clear a breakpoint are by pressing F9 or choosing Run > Toggle Breakpoint from the menu while the line of code is selected.
If you get a warning that the breakpoint condition will be lost, select Remove Breakpoint.
Step through a program
Visual Studio Code also allows you to step line by line through a program and monitor its execution. Ordinarily, you'd set a breakpoint and follow program flow through a small part of your program code. Since this program is small, you can step through the entire program.
Set a breakpoint on the opening curly brace of the
Mainmethod.Press F5 to start debugging.
Visual Studio Code highlights the breakpoint line.
At this point, the Variables window shows that the
argsarray is empty, andnameandcurrentDatehave default values.Select Run > Step Into or press F11.
Visual Studio Code highlights the next line.
Select Run > Step Into or press F11.
Visual Studio Code runs the
Console.WriteLinefor the name prompt and highlights the next line of execution. The next line is theConsole.ReadLinefor thename. The Variables window is unchanged, and the Terminal tab shows the "What is your name?" prompt.Select Run > Step Into or press F11.
Visual Studio highlights the
namevariable assignment. The Variables window shows thatnameis stillnull.Respond to the prompt by entering a string in the Terminal tab and pressing Enter.
The Terminal tab might not display the string you enter while you're entering it, but the Console.ReadLine method will capture your input.
Select Run > Step Into or press F11.
Visual Studio Code highlights the
currentDatevariable assignment. The Variables window shows the value returned by the call to the Console.ReadLine method. The Terminal tab displays the string you entered at the prompt.Select Run > Step Into or press F11.
The Variables window shows the value of the
currentDatevariable after the assignment from the DateTime.Now property.Select Run > Step Into or press F11.
Visual Studio Code calls the Console.WriteLine(String, Object, Object) method. The console window displays the formatted string.
Select Run > Step Out or press Shift+F11.
Select the Terminal tab.
The terminal displays "Press any key to exit..."
Press any key to exit the program.
Use Release build configuration
Once you've tested the Debug version of your application, you should also compile and test the Release version. The Release version incorporates compiler optimizations that can affect the behavior of an application. For example, compiler optimizations that are designed to improve performance can create race conditions in multithreaded applications.
To build and test the Release version of your console application, open the Terminal and run the following command:
dotnet run --configuration Release
Additional resources
Next steps
In this tutorial, you used Visual Studio Code debugging tools. In the next tutorial, you publish a deployable version of the app.
This tutorial introduces the debugging tools available in Visual Studio Code for working with .NET apps.
Prerequisites
- This tutorial works with the console app that you create in Create a .NET console application using Visual Studio Code.
Use Debug build configuration
Debug and Release are .NET's built-in build configurations. You use the Debug build configuration for debugging and the Release configuration for the final release distribution.
In the Debug configuration, a program compiles with full symbolic debug information and no optimization. Optimization complicates debugging, because the relationship between source code and generated instructions is more complex. The release configuration of a program has no symbolic debug information and is fully optimized.
By default, Visual Studio Code launch settings use the Debug build configuration, so you don't need to change it before debugging.
Start Visual Studio Code.
Open the folder of the project that you created in Create a .NET console application using Visual Studio Code.
Set a breakpoint
A breakpoint temporarily interrupts the execution of the application before the line with the breakpoint is run.
Open the Program.cs file.
Set a breakpoint on the line that displays the name, date, and time, by clicking in the left margin of the code window. The left margin is to the left of the line numbers. Other ways to set a breakpoint are by pressing F9 or choosing Run > Toggle Breakpoint from the menu while the line of code is selected.
Visual Studio Code indicates the line on which the breakpoint is set by displaying a red dot in the left margin.
Set up for terminal input
The breakpoint is located after a Console.ReadLine method call. The Debug Console doesn't accept terminal input for a running program. To handle terminal input while debugging, you can use the integrated terminal (one of the Visual Studio Code windows) or an external terminal. For this tutorial, you use the integrated terminal.
Open .vscode/launch.json.
Change the
consolesetting frominternalConsoletointegratedTerminal:"console": "integratedTerminal",Save your changes.
Start debugging
Open the Debug view by selecting the Debugging icon on the left side menu.
Select the green arrow at the top of the pane, next to .NET Core Launch (console). Other ways to start the program in debugging mode are by pressing F5 or choosing Run > Start Debugging from the menu.
Select the Terminal tab to see the "What is your name?" prompt that the program displays before waiting for a response.
Enter a string in the Terminal window in response to the prompt for a name, and then press Enter.
Program execution stops when it reaches the breakpoint and before the
Console.WriteLinemethod runs. The Locals section of the Variables window displays the values of variables that are defined in the currently running method.
Use the Debug Console
The Debug Console window lets you interact with the application you're debugging. You can change the value of variables to see how it affects your program.
Select the Debug Console tab.
Enter
name = "Gracie"at the prompt at the bottom of the Debug Console window and press the Enter key.
Enter
currentDate = DateTime.Parse("2019-11-16T17:25:00Z").ToUniversalTime()at the bottom of the Debug Console window and press the Enter key.The Variables window displays the new values of the
nameandcurrentDatevariables.Continue program execution by selecting the Continue button in the toolbar. Another way to continue is by pressing F5.
Select the Terminal tab again.
The values displayed in the console window correspond to the changes you made in the Debug Console.
Press any key to exit the application and stop debugging.
Set a conditional breakpoint
The program displays the string that the user enters. What happens if the user doesn't enter anything? You can test this with a useful debugging feature called a conditional breakpoint.
Right-click (Ctrl-click on macOS) on the red dot that represents the breakpoint. In the context menu, select Edit Breakpoint to open a dialog that lets you enter a conditional expression.
Select
Expressionin the drop-down, enter the following conditional expression, and press Enter.String.IsNullOrEmpty(name)
Each time the breakpoint is hit, the debugger calls the
String.IsNullOrEmpty(name)method, and it breaks on this line only if the method call returnstrue.Instead of a conditional expression, you can specify a hit count, which interrupts program execution before a statement is run a specified number of times. Another option is to specify a filter condition, which interrupts program execution based on such attributes as a thread identifier, process name, or thread name.
Start the program with debugging by pressing F5.
In the Terminal tab, press the Enter key when prompted to enter your name.
Because the condition you specified (
nameis eithernullor String.Empty) has been satisfied, program execution stops when it reaches the breakpoint and before theConsole.WriteLinemethod runs.The Variables window shows that the value of the
namevariable is"", or String.Empty.Confirm the value is an empty string by entering the following statement at the Debug Console prompt and pressing Enter. The result is
true.name == String.EmptySelect the Continue button on the toolbar to continue program execution.
Select the Terminal tab, and press any key to exit the program and stop debugging.
Clear the breakpoint by clicking on the dot in the left margin of the code window. Other ways to clear a breakpoint are by pressing F9 or choosing Run > Toggle Breakpoint from the menu while the line of code is selected.
If you get a warning that the breakpoint condition will be lost, select Remove Breakpoint.
Step through a program
Visual Studio Code also allows you to step line by line through a program and monitor its execution. Ordinarily, you'd set a breakpoint and follow program flow through a small part of your program code. Since this program is small, you can step through the entire program.
Set a breakpoint on the opening curly brace of the
Mainmethod.Press F5 to start debugging.
Visual Studio Code highlights the breakpoint line.
At this point, the Variables window shows that the
argsarray is empty, andnameandcurrentDatehave default values.Select Run > Step Into or press F11.
Visual Studio Code highlights the next line.
Select Run > Step Into or press F11.
Visual Studio Code runs the
Console.WriteLinefor the name prompt and highlights the next line of execution. The next line is theConsole.ReadLinefor thename. The Variables window is unchanged, and the Terminal tab shows the "What is your name?" prompt.Select Run > Step Into or press F11.
Visual Studio highlights the
namevariable assignment. The Variables window is cleared.Respond to the prompt by entering a string in the Terminal tab and pressing Enter.
The Terminal tab might not display the string you enter while you're entering it, but the Console.ReadLine method will capture your input.
The Variables window shows the value returned by the call to the Console.ReadLine method.
Select Run > Step Into or press F11.
Visual Studio Code highlights the
currentDatevariable assignment. The Terminal tab displays the string you entered at the prompt.Select Run > Step Into or press F11.
The Variables window shows the value of the
currentDatevariable after the assignment from the DateTime.Now property.Select Run > Step Into or press F11.
Visual Studio Code calls the Console.WriteLine(String, Object, Object) method. The console window displays the formatted string.
Select Run > Step Out or press Shift+F11.
Select the Terminal tab.
The terminal displays "Press any key to exit..."
Press any key to exit the program.
Use Release build configuration
Once you've tested the Debug version of your application, you should also compile and test the Release version. The Release version incorporates compiler optimizations that can affect the behavior of an application. For example, compiler optimizations that are designed to improve performance can create race conditions in multithreaded applications.
To build and test the Release version of your console application, open the Terminal and run the following command:
dotnet run --configuration Release
Additional resources
Next steps
In this tutorial, you used Visual Studio Code debugging tools. In the next tutorial, you publish a deployable version of the app.
Pripomienky
Pripravujeme: V priebehu roka 2024 postupne zrušíme službu Problémy v službe GitHub ako mechanizmus pripomienok týkajúcich sa obsahu a nahradíme ju novým systémom pripomienok. Ďalšie informácie nájdete na stránke: https://aka.ms/ContentUserFeedback.
Odoslať a zobraziť pripomienky pre