Tutorial: Detect anomalies in product sales with ML.NET
Learn how to build an anomaly detection application for product sales data. This tutorial creates a .NET console application using C# in Visual Studio.
In this tutorial, you learn how to:
- Load the data
- Create a transform for spike anomaly detection
- Detect spike anomalies with the transform
- Create a transform for change point anomaly detection
- Detect change point anomalies with the transform
You can find the source code for this tutorial at the dotnet/samples repository.
Prerequisites
Visual Studio 2022 with the ".NET Desktop Development" workload installed.
Note
The data format in product-sales.csv is based on the dataset “Shampoo Sales Over a Three Year Period” originally sourced from DataMarket and provided by Time Series Data Library (TSDL), created by Rob Hyndman.
“Shampoo Sales Over a Three Year Period” Dataset Licensed Under the DataMarket Default Open License.
Create a console application
Create a C# Console Application called "ProductSalesAnomalyDetection". Click the Next button.
Choose .NET 6 as the framework to use. Click the Create button.
Create a directory named Data in your project to save your data set files.
Install the Microsoft.ML NuGet Package:
Note
This sample uses the latest stable version of the NuGet packages mentioned unless otherwise stated.
In Solution Explorer, right-click on your project and select Manage NuGet Packages. Choose "nuget.org" as the Package source, select the Browse tab, search for Microsoft.ML and select the Install button. Select the OK button on the Preview Changes dialog and then select the I Accept button on the License Acceptance dialog if you agree with the license terms for the packages listed. Repeat these steps for Microsoft.ML.TimeSeries.
Add the following
usingstatements at the top of your Program.cs file:using Microsoft.ML; using ProductSalesAnomalyDetection;
Download your data
Download the dataset and save it to the Data folder you previously created:
Right click on product-sales.csv and select "Save Link (or Target) As..."
Make sure you either save the *.csv file to the Data folder, or after you save it elsewhere, move the *.csv file to the Data folder.
In Solution Explorer, right-click the *.csv file and select Properties. Under Advanced, change the value of Copy to Output Directory to Copy if newer.
The following table is a data preview from your *.csv file:
| Month | ProductSales |
|---|---|
| 1-Jan | 271 |
| 2-Jan | 150.9 |
| ..... | ..... |
| 1-Feb | 199.3 |
| ..... | ..... |
Create classes and define paths
Next, define your input and prediction class data structures.
Add a new class to your project:
In Solution Explorer, right-click the project, and then select Add > New Item.
In the Add New Item dialog box, select Class and change the Name field to ProductSalesData.cs. Then, select the Add button.
The ProductSalesData.cs file opens in the code editor.
Add the following
usingstatement to the top of ProductSalesData.cs:using Microsoft.ML.Data;Remove the existing class definition and add the following code, which has two classes
ProductSalesDataandProductSalesPrediction, to the ProductSalesData.cs file:public class ProductSalesData { [LoadColumn(0)] public string? Month; [LoadColumn(1)] public float numSales; } public class ProductSalesPrediction { //vector to hold alert,score,p-value values [VectorType(3)] public double[]? Prediction { get; set; } }ProductSalesDataspecifies an input data class. The LoadColumn attribute specifies which columns (by column index) in the dataset should be loaded.ProductSalesPredictionspecifies the prediction data class. For anomaly detection, the prediction consists of an alert to indicate whether there is an anomaly, a raw score, and p-value. The closer the p-value is to 0, the more likely an anomaly has occurred.Create two global fields to hold the recently downloaded dataset file path and the saved model file path:
_dataPathhas the path to the dataset used to train the model._docsizehas the number of records in dataset file. You'll use_docSizeto calculatepvalueHistoryLength.
Add the following code to the line right below the using statements to specify those paths:
string _dataPath = Path.Combine(Environment.CurrentDirectory, "Data", "product-sales.csv");
//assign the Number of records in dataset file to constant variable
const int _docsize = 36;
Initialize variables
Replace the
Console.WriteLine("Hello World!")line with the following code to declare and initialize themlContextvariable:MLContext mlContext = new MLContext();The MLContext class is a starting point for all ML.NET operations, and initializing
mlContextcreates a new ML.NET environment that can be shared across the model creation workflow objects. It's similar, conceptually, toDBContextin Entity Framework.
Load the data
Data in ML.NET is represented as an IDataView interface. IDataView is a flexible, efficient way of describing tabular data (numeric and text). Data can be loaded from a text file or from other sources (for example, SQL database or log files) to an IDataView object.
Add the following code after creating the
mlContextvariable:IDataView dataView = mlContext.Data.LoadFromTextFile<ProductSalesData>(path: _dataPath, hasHeader: true, separatorChar: ',');The LoadFromTextFile() defines the data schema and reads in the file. It takes in the data path variables and returns an
IDataView.
Time series anomaly detection
Anomaly detection flags unexpected or unusual events or behaviors. It gives clues where to look for problems and helps you answer the question "Is this weird?".

Anomaly detection is the process of detecting time-series data outliers; points on a given input time-series where the behavior isn't what was expected, or "weird".
Anomaly detection can be useful in lots of ways. For instance:
If you have a car, you might want to know: Is this oil gauge reading normal, or do I have a leak? If you're monitoring power consumption, you’d want to know: Is there an outage?
There are two types of time series anomalies that can be detected:
Spikes indicate temporary bursts of anomalous behavior in the system.
Change points indicate the beginning of persistent changes over time in the system.
In ML.NET, The IID Spike Detection or IID Change point Detection algorithms are suited for independent and identically distributed datasets. They assume that your input data is a sequence of data points that are independently sampled from one stationary distribution.
Unlike the models in the other tutorials, the time series anomaly detector transforms operate directly on input data. The IEstimator.Fit() method does not need training data to produce the transform. It does need the data schema though, which is provided by a data view generated from an empty list of ProductSalesData.
You'll analyze the same product sales data to detect spikes and change points. The building and training model process is the same for spike detection and change point detection; the main difference is the specific detection algorithm used.
Spike detection
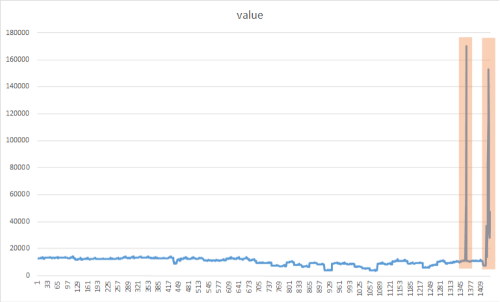
The goal of spike detection is to identify sudden yet temporary bursts that significantly differ from the majority of the time series data values. It's important to detect these suspicious rare items, events, or observations in a timely manner to be minimized. The following approach can be used to detect a variety of anomalies such as: outages, cyber-attacks, or viral web content. The following image is an example of spikes in a time series dataset:
Add the CreateEmptyDataView() method
Add the following method to Program.cs:
IDataView CreateEmptyDataView(MLContext mlContext) {
    // Create empty DataView. We just need the schema to call Fit() for the time series transforms
    IEnumerable<ProductSalesData> enumerableData = new List<ProductSalesData>();
    return mlContext.Data.LoadFromEnumerable(enumerableData);
}
The CreateEmptyDataView() produces an empty data view object with the correct schema to be used as input to the IEstimator.Fit() method.
Create the DetectSpike() method
The DetectSpike() method:
- Creates the transform from the estimator.
- Detects spikes based on historical sales data.
- Displays the results.
Create the
DetectSpike()method at the bottom of the Program.cs file using the following code:DetectSpike(MLContext mlContext, int docSize, IDataView productSales) { }Use the IidSpikeEstimator to train the model for spike detection. Add it to the
DetectSpike()method with the following code:var iidSpikeEstimator = mlContext.Transforms.DetectIidSpike(outputColumnName: nameof(ProductSalesPrediction.Prediction), inputColumnName: nameof(ProductSalesData.numSales), confidence: 95d, pvalueHistoryLength: docSize / 4);Create the spike detection transform by adding the following as the next line of code in the
DetectSpike()method:Tip
The
confidenceandpvalueHistoryLengthparameters impact how spikes are detected.confidencedetermines how sensitive your model is to spikes. The lower the confidence, the more likely the algorithm is to detect "smaller" spikes. ThepvalueHistoryLengthparameter defines the number of data points in a sliding window. The value of this parameter is usually a percentage of the entire dataset. The lower thepvalueHistoryLength, the faster the model forgets previous large spikes.ITransformer iidSpikeTransform = iidSpikeEstimator.Fit(CreateEmptyDataView(mlContext));Add the following line of code to transform the
productSalesdata as the next line in theDetectSpike()method:IDataView transformedData = iidSpikeTransform.Transform(productSales);The previous code uses the Transform() method to make predictions for multiple input rows of a dataset.
Convert your
transformedDatainto a strongly typedIEnumerablefor easier display using the CreateEnumerable() method with the following code:var predictions = mlContext.Data.CreateEnumerable<ProductSalesPrediction>(transformedData, reuseRowObject: false);Create a display header line using the following Console.WriteLine() code:
Console.WriteLine("Alert\tScore\tP-Value");You'll display the following information in your spike detection results:
Alertindicates a spike alert for a given data point.Scoreis theProductSalesvalue for a given data point in the dataset.P-ValueThe "P" stands for probability. The closer the p-value is to 0, the more likely the data point is an anomaly.
Use the following code to iterate through the
predictionsIEnumerableand display the results:foreach (var p in predictions) { if (p.Prediction is not null) { var results = $"{p.Prediction[0]}\t{p.Prediction[1]:f2}\t{p.Prediction[2]:F2}"; if (p.Prediction[0] == 1) { results += " <-- Spike detected"; } Console.WriteLine(results); } } Console.WriteLine("");Add the call to the
DetectSpike()method below the call to theLoadFromTextFile()method:DetectSpike(mlContext, _docsize, dataView);
Spike detection results
Your results should be similar to the following. During processing, messages are displayed. You may see warnings, or processing messages. Some of the messages have been removed from the following results for clarity.
Detect temporary changes in pattern
=============== Training the model ===============
=============== End of training process ===============
Alert   Score   P-Value
0       271.00  0.50
0       150.90  0.00
0       188.10  0.41
0       124.30  0.13
0       185.30  0.47
0       173.50  0.47
0       236.80  0.19
0       229.50  0.27
0       197.80  0.48
0       127.90  0.13
1       341.50  0.00 <-- Spike detected
0       190.90  0.48
0       199.30  0.48
0       154.50  0.24
0       215.10  0.42
0       278.30  0.19
0       196.40  0.43
0       292.00  0.17
0       231.00  0.45
0       308.60  0.18
0       294.90  0.19
1       426.60  0.00 <-- Spike detected
0       269.50  0.47
0       347.30  0.21
0       344.70  0.27
0       445.40  0.06
0       320.90  0.49
0       444.30  0.12
0       406.30  0.29
0       442.40  0.21
1       580.50  0.00 <-- Spike detected
0       412.60  0.45
1       687.00  0.01 <-- Spike detected
0       480.30  0.40
0       586.30  0.20
0       651.90  0.14
Change point detection
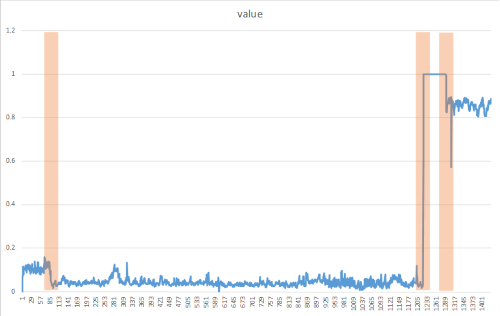
Change points are persistent changes in a time series event stream distribution of values, like level changes and trends. These persistent changes last much longer than spikes and could indicate catastrophic event(s). Change points are not usually visible to the naked eye, but can be detected in your data using approaches such as in the following method. The following image is an example of a change point detection:
Create the DetectChangepoint() method
The DetectChangepoint() method executes the following tasks:
- Creates the transform from the estimator.
- Detects change points based on historical sales data.
- Displays the results.
Create the
DetectChangepoint()method, just after theDetectSpike()method declaration, using the following code:void DetectChangepoint(MLContext mlContext, int docSize, IDataView productSales) { }Create the iidChangePointEstimator in the
DetectChangepoint()method with the following code:var iidChangePointEstimator = mlContext.Transforms.DetectIidChangePoint(outputColumnName: nameof(ProductSalesPrediction.Prediction), inputColumnName: nameof(ProductSalesData.numSales), confidence: 95d, changeHistoryLength: docSize / 4);As you did previously, create the transform from the estimator by adding the following line of code in the
DetectChangePoint()method:Tip
The detection of change points happens with a slight delay as the model needs to make sure the current deviation is a persistent change and not just some random spikes before creating an alert. The amount of this delay is equal to the
changeHistoryLengthparameter. By increasing the value of this parameter, change detection alerts on more persistent changes, but the trade-off would be a longer delay.var iidChangePointTransform = iidChangePointEstimator.Fit(CreateEmptyDataView(mlContext));Use the
Transform()method to transform the data by adding the following code toDetectChangePoint():IDataView transformedData = iidChangePointTransform.Transform(productSales);As you did previously, convert your
transformedDatainto a strongly typedIEnumerablefor easier display using theCreateEnumerable()method with the following code:var predictions = mlContext.Data.CreateEnumerable<ProductSalesPrediction>(transformedData, reuseRowObject: false);Create a display header with the following code as the next line in the
DetectChangePoint()method:Console.WriteLine("Alert\tScore\tP-Value\tMartingale value");You'll display the following information in your change point detection results:
Alertindicates a change point alert for a given data point.Scoreis theProductSalesvalue for a given data point in the dataset.P-ValueThe "P" stands for probability. The closer the P-value is to 0, the more likely the data point is an anomaly.Martingale valueis used to identify how "weird" a data point is, based on the sequence of P-values.
Iterate through the
predictionsIEnumerableand display the results with the following code:foreach (var p in predictions) { if (p.Prediction is not null) { var results = $"{p.Prediction[0]}\t{p.Prediction[1]:f2}\t{p.Prediction[2]:F2}\t{p.Prediction[3]:F2}"; if (p.Prediction[0] == 1) { results += " <-- alert is on, predicted changepoint"; } Console.WriteLine(results); } } Console.WriteLine("");Add the following call to the
DetectChangepoint()method after the call to theDetectSpike()method:DetectChangepoint(mlContext, _docsize, dataView);
Change point detection results
Your results should be similar to the following. During processing, messages are displayed. You may see warnings, or processing messages. Some messages have been removed from the following results for clarity.
Detect Persistent changes in pattern
=============== Training the model Using Change Point Detection Algorithm===============
=============== End of training process ===============
Alert   Score   P-Value Martingale value
0       271.00  0.50    0.00
0       150.90  0.00    2.33
0       188.10  0.41    2.80
0       124.30  0.13    9.16
0       185.30  0.47    9.77
0       173.50  0.47    10.41
0       236.80  0.19    24.46
0       229.50  0.27    42.38
1       197.80  0.48    44.23 <-- alert is on, predicted changepoint
0       127.90  0.13    145.25
0       341.50  0.00    0.01
0       190.90  0.48    0.01
0       199.30  0.48    0.00
0       154.50  0.24    0.00
0       215.10  0.42    0.00
0       278.30  0.19    0.00
0       196.40  0.43    0.00
0       292.00  0.17    0.01
0       231.00  0.45    0.00
0       308.60  0.18    0.00
0       294.90  0.19    0.00
0       426.60  0.00    0.00
0       269.50  0.47    0.00
0       347.30  0.21    0.00
0       344.70  0.27    0.00
0       445.40  0.06    0.02
0       320.90  0.49    0.01
0       444.30  0.12    0.02
0       406.30  0.29    0.01
0       442.40  0.21    0.01
0       580.50  0.00    0.01
0       412.60  0.45    0.01
0       687.00  0.01    0.12
0       480.30  0.40    0.08
0       586.30  0.20    0.03
0       651.90  0.14    0.09
Congratulations! You've now successfully built machine learning models for detecting spikes and change point anomalies in sales data.
You can find the source code for this tutorial at the dotnet/samples repository.
In this tutorial, you learned how to:
- Load the data
- Train the model for spike anomaly detection
- Detect spike anomalies with the trained model
- Train the model for change point anomaly detection
- Detect change point anomalies with the trained mode
Next steps
Check out the Machine Learning samples GitHub repository to explore a seasonality data anomaly detection sample.
Pripomienky
Pripravujeme: V priebehu roka 2024 postupne zrušíme službu Problémy v službe GitHub ako mechanizmus pripomienok týkajúcich sa obsahu a nahradíme ju novým systémom pripomienok. Ďalšie informácie nájdete na stránke: https://aka.ms/ContentUserFeedback.
Odoslať a zobraziť pripomienky pre