Activities
Microsoft Defender for Cloud Apps gives you visibility into all the activities from your connected apps. After you connect Defender for Cloud Apps to an app using the App connector, Defender for Cloud Apps scans all the activities that happened - the retroactive scan period differs per app - and then it's updated constantly with new activities.
Note
For a full list of Microsoft 365 activities monitored by Defender for Cloud Apps, see Search the audit log in the compliance center.
The Activity log can be filtered to enable you to find specific activities. You create policies based on the activities and then define what you want to be alerted about and act on. You can search for activities performed on certain files. The type of activities and the information we get for each activity depends on the app and what kind of data the app can provide.
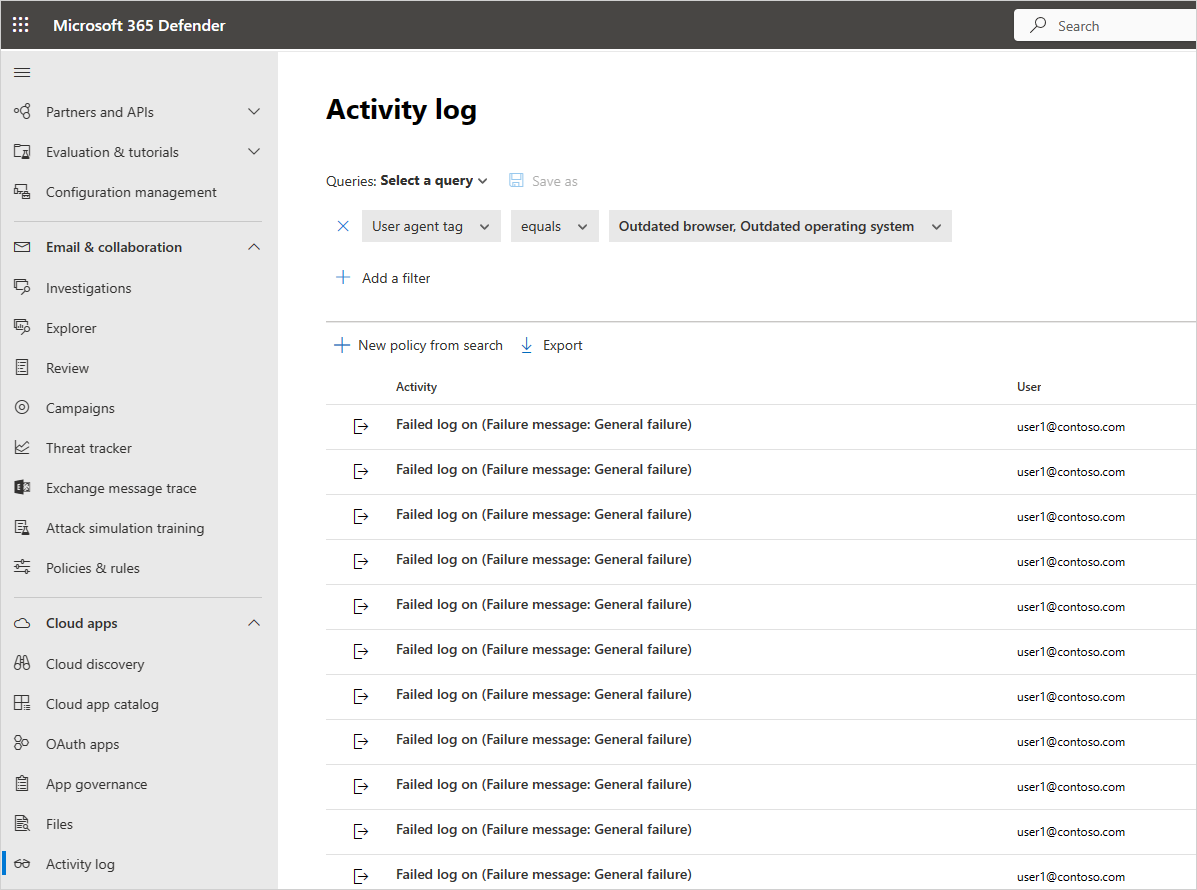
For example, you can use the Activity log to find users in your organization who are using operating systems or browsers that are out of date, as follows: After you connect an app to Defender for Cloud Apps in the Activity log page, use the advanced filter and select User agent tag. Then select Outdated browser or Outdated operating system.
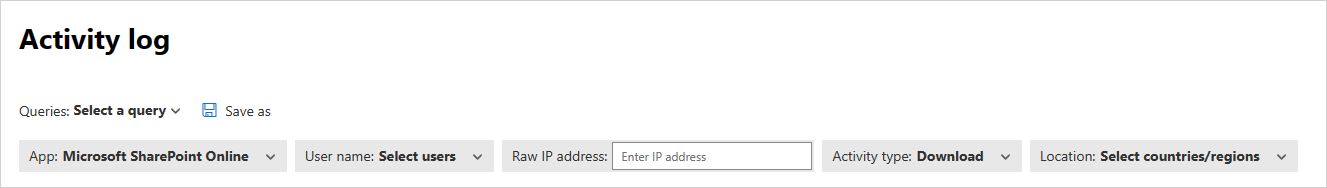
The basic filter provides great tools to start filtering your activities.
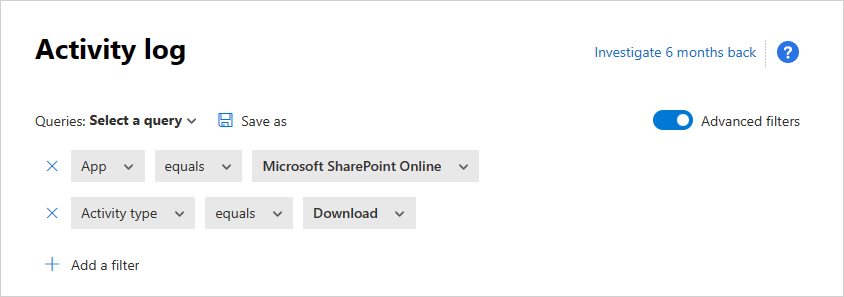
You can expand the basic filter by selecting Advanced filters to drill down into more specific activities.
Note
The Legacy tag is added to any activity policy that uses the older "user" filter. This filter will continue to work as usual. If you want to remove the Legacy tag, you can remove the filter and add the filter again using the new User name filter.
In some rare cases, the count of the events presented in the activity log may show a slightly higher number than the real number of events that apply for the filter and being presented.
The Activity drawer
Working with the Activity drawer
You can view more information about each activity, by selecting the Activity itself in the Activity log. This opens the Activity drawer that provides the following additional actions and insights for each activity:
Matched policies: Select the Matched policies link to see a list of policies this activity matched.
View raw data: Select View raw data to see the actual data that was received from the app.
User: Select the user to view the user page for the user who performed the activity.
Device type: Select Device type to view the raw user agent data.
Location: Select the location to view the location in Bing Maps.
IP address category and tags: Select the IP tag to view the list of IP tags found in this activity. You can then filter by all activities matching this tag.
The fields in the Activity drawer provide contextual links to additional activities and drill-downs you may want to perform from the drawer directly. For example, if you move your cursor next to the IP address category, you can use the add to filter icon ![]() to immediately add the IP address to the current page's filter. You can also use the settings cog icon
to immediately add the IP address to the current page's filter. You can also use the settings cog icon ![]() that pops up to arrive directly at the settings page necessary to modify the configuration of one of the fields, such as User groups.
that pops up to arrive directly at the settings page necessary to modify the configuration of one of the fields, such as User groups.
You can also use the icons at the top of the tab to:
- View activities of the same type
- View all activities of the same user
- View activities from the same IP address
- View activities from the exact geographic location
- View activities from the same period (48 hours)

For a list of governance actions available, see Activity governance actions.
User insights
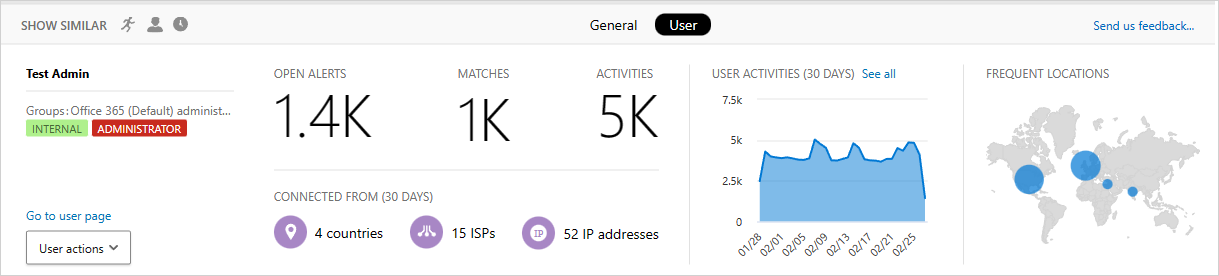
The investigation experience includes insights about the acting user. With a single click, you can get a comprehensive overview of the user, including which location they connected from, how many open alerts they're involved with, and their metadata information.
To view user insights:
Select the Activity itself in the Activity log.
Then select the User tab.
Selecting it opens the Activity drawer User tab provides the following insights about the user:- Open alerts: The number of open alerts that involve the user.
- Matches: The number of policy matches for files owned by the user.
- Activities: The number of activities performed by the user in the past 30 days.
- Countries: The number of countries the user connected from in the past 30 days.
- ISPs: The number of ISPs the user connected from in the past 30 days.
- IP addresses: The number of IP addresses the user connected from in the past 30 days.
IP address insights
Because IP address information is crucial for almost all investigations, you can view detailed information about IP addresses in the Activity drawer. From within a specific activity, you can select the IP address tab to view consolidated data about the IP address, including the number of open alerts for the particular IP address, a trend graph of recent activity, and a location map. This enables easy to drill down when investigating impossible travel alerts, for example. In addition, you can easily understand where the IP address was used and whether it was involved in suspicious activities. You can also perform actions directly in the IP address drawer that enable you to tag an IP address as risky, VPN, or corporate to ease future investigation and policy creation.
To view IP address insights:
Select the Activity itself in the Activity log.
Then select the IP address tab.
This opens the Activity drawer IP address tab, which provides the following insights about the IP address:
Open alerts: The number of open alerts that involved the IP address.
Activities: The number of activities performed by the IP address in the past 30 days.
IP location: The geographic locations from which the IP address connected in the past 30 days.
Activities: The number of activities performed from this IP address in the past 30 days.
Admin activities: The number of administrative activities performed from this IP address in the past 30 days. You can perform the following IP address actions:
- Set as a Corporate IP and add to allowlist
- Set as a VPN IP address and add to allowlist
- Set as a Risky IP and add to blocklist

Note
- Internal IPv4 or IPv6 IP addresses audited by the cloud applications connected with API, may indicate internal services communications within the network of the cloud application, and shouldn't be confused with internal IPs from the source network the device connected from, as the cloud application is not exposed to the internal IPs of the devices.
- To avoid raising impossible travel alerts when employees connect from their home locations via the corporate VPN, it's recommended to tag the IP address as VPN.
Export activities
You can export all user activities to a CSV file.
In the Activity log, select the Export button in the top-left corner.

Note
This article provides steps for how to delete personal data from the device or service and can be used to support your obligations under the GDPR. If you’re looking for general info about GDPR, see the GDPR section of the Service Trust portal.
Next steps
If you run into any problems, we're here to help. To get assistance or support for your product issue, please open a support ticket.
คำติชม
เร็วๆ นี้: ตลอดปี 2024 เราจะขจัดปัญหา GitHub เพื่อเป็นกลไกคำติชมสำหรับเนื้อหา และแทนที่ด้วยระบบคำติชมใหม่ สำหรับข้อมูลเพิ่มเติม ให้ดู: https://aka.ms/ContentUserFeedback
ส่งและดูข้อคิดเห็นสำหรับ