Create relationships
Applies to:  SQL Server 2019 and later Analysis Services
Azure Analysis Services
Fabric/Power BI Premium
SQL Server 2019 and later Analysis Services
Azure Analysis Services
Fabric/Power BI Premium
In this lesson, you verify the relationships that were created automatically when you imported data and add new relationships between different tables. A relationship is a connection between two tables that establishes how the data in those tables should be correlated. For example, the DimProduct table and the DimProductSubcategory table have a relationship based on the fact that each product in the DimProduct table belongs to a subcategory in the DimProductSubcategory table. To learn more, see Relationships.
Important
At this time, the AdventureWorksDW sample default database installed with Azure Synapse Analytics (SQL Data Warehouse) does not have relationships between tables described in this tutorial. You will have to manually create all relationships. Manually creating relationships is described later in this lesson.
Estimated time to complete this lesson: 10 minutes
Prerequisites
This article is part of a tabular modeling tutorial, which should be completed in order. Before performing the tasks in this lesson, you should have completed the previous lesson: Lesson 3: Mark as Date Table.
Review existing relationships and add new relationships
When you imported data by using Get Data, you got seven tables from the AdventureWorksDW database. Generally, when you import data from a relational source, existing relationships are automatically imported together with the data. In order for Get Data to automatically create relationships in the data model, there must be relationships between tables at the data source.
Before you proceed with authoring your model, you should verify those relationships between tables were created properly. For this tutorial, you also add three new relationships.
To review existing relationships
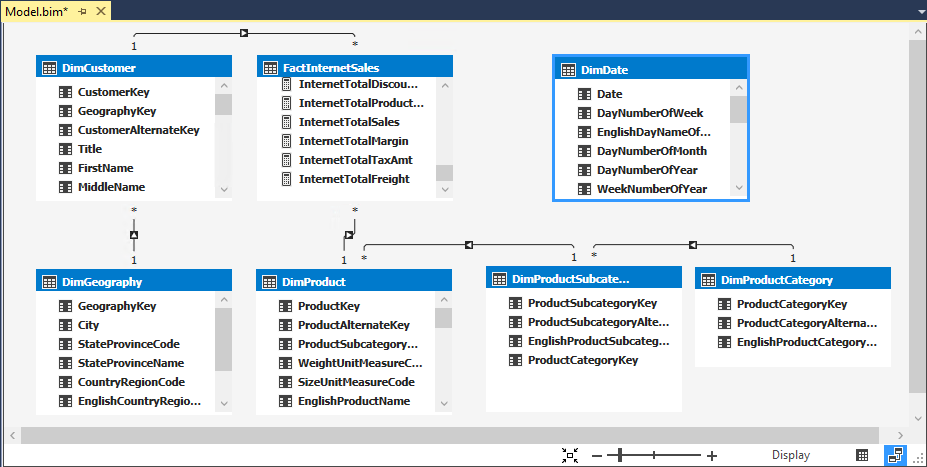
Click the Model menu > Model View > Diagram View.
The model designer now appears in Diagram View, a graphical format displaying all the tables you imported with lines between them. The lines between tables indicate the relationships that were automatically created when you imported the data.
Note
If you don't see any relationships between tables, it likely means there are no relationships between those tables at the datasource.
Include as many of the tables as possible by using minimap controls in the lower-right corner of the model designer. You can also click and drag tables to different locations, bringing tables closer together, or putting them in a particular order. Moving tables does not affect the relationships between the tables. To view all the columns in a particular table, click and drag on a table edge to expand or make it smaller.
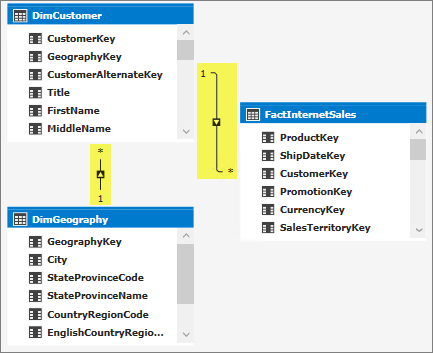
Click the solid line between the DimCustomer table and the DimGeography table. The solid line between these two tables shows this relationship is active, that is, it is used by default when calculating DAX formulas.
Notice the GeographyKey column in the DimCustomer table and the GeographyKey column in the DimGeography table now both each appear within a box. These columns are used in the relationship. The relationship's properties now also appear in the Properties window.
Tip
You can also use the Manage Relationships dialog box to show the relationships between all tables in a table format. In Tabular Model Explorer, right-click Relationships > Manage Relationships.
Verify the following relationships were created when each of the tables were imported from the AdventureWorksDW database:
Active Table Related Lookup Table Yes DimCustomer [GeographyKey] DimGeography [GeographyKey] Yes DimProduct [ProductSubcategoryKey] DimProductSubcategory [ProductSubcategoryKey] Yes DimProductSubcategory [ProductCategoryKey] DimProductCategory [ProductCategoryKey] Yes FactInternetSales [CustomerKey] DimCustomer [CustomerKey] Yes FactInternetSales [ProductKey] DimProduct [ProductKey] If any of the relationships are missing, verify your model includes the following tables: DimCustomer, DimDate, DimGeography, DimProduct, DimProductCategory, DimProductSubcategory, and FactInternetSales. If tables from the same datasource connection are imported at separate times, any relationships between those tables are not created and must be created manually. If no relationships appear, it means there are no relationships at the datasource. You can create them manually in the data model.
Take a closer look
In Diagram View, notice an arrow, an asterisk, and a number on the lines that show the relationship between tables.
The arrow shows the filter direction. The asterisk shows this table is the many side in the relationship's cardinality, and the one shows this table is the one side of the relationship. If you need to edit a relationship; for example, change the relationship's filter direction or cardinality, double-click the relationship line to open the Edit Relationship dialog.
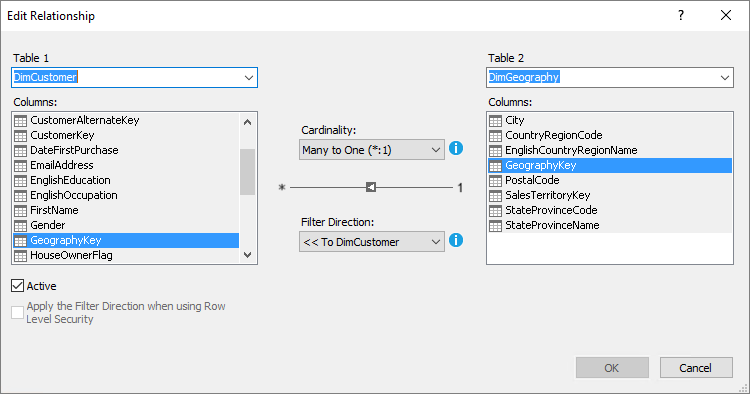
These features are meant for advanced data modeling and are outside the scope of this tutorial. To learn more, see Bi-directional cross filters for tabular models in Analysis Services.
In some cases, you may need to create additional relationships between tables in your model to support certain business logic. For this tutorial, you need to create three additional relationships between the FactInternetSales table and the DimDate table.
To add new relationships between tables
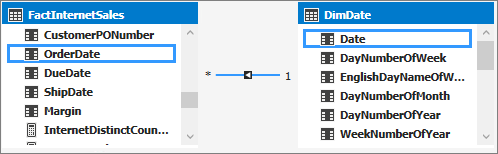
In the model designer, in the FactInternetSales table, click, and hold on the OrderDate column, then drag the cursor to the Date column in the DimDate table, and then release.
A solid line appears showing you have created an active relationship between the OrderDate column in the Internet Sales table, and the Date column in the Date table.
Note
When creating relationships, the cardinality and filter direction between the primary table and the related lookup table is automatically selected.
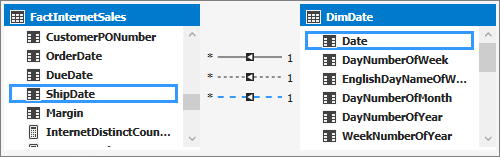
In the FactInternetSales table, click and hold on the DueDate column, then drag the cursor to the Date column in the DimDate table, and then release.
A dotted line appears showing you have created an inactive relationship between the DueDate column in the FactInternetSales table, and the Date column in the DimDate table. You can have multiple relationships between tables, but only one relationship can be active at a time. Inactive relationships can be made active to perform special aggregations in custom DAX expressions.
Finally, create one more relationship. In the FactInternetSales table, click and hold on the ShipDate column, then drag the cursor to the Date column in the DimDate table, and then release.
Next step
คำติชม
เร็วๆ นี้: ตลอดปี 2024 เราจะขจัดปัญหา GitHub เพื่อเป็นกลไกคำติชมสำหรับเนื้อหา และแทนที่ด้วยระบบคำติชมใหม่ สำหรับข้อมูลเพิ่มเติม ให้ดู: https://aka.ms/ContentUserFeedback
ส่งและดูข้อคิดเห็นสำหรับ