Supplemental lesson - Ragged hierarchies
Applies to:  SQL Server 2017 and later Analysis Services
Azure Analysis Services
SQL Server 2017 and later Analysis Services
Azure Analysis Services  Fabric/Power BI Premium
In this supplemental lesson, you resolve a common problem when pivoting on hierarchies that contain blank values (members) at different levels. For example, an organization where a high-level manager has both departmental managers and non-managers as direct reports. Or, geographic hierarchies composed of Country-Region-City, where some cities lack a parent State or Province, such as Washington D.C., Vatican City. When a hierarchy has blank members, it often descends to different, or ragged, levels.
Tabular models at the 1400 compatibility level have an additional Hide Members property for hierarchies. The Default setting assumes there are no blank members at any level. The Hide blank members setting excludes blank members from the hierarchy when added to a PivotTable or report.
Estimated time to complete this lesson: 20 minutes
Prerequisites
This supplemental lesson article is part of a tabular modeling tutorial. Before performing the tasks in this supplemental lesson, you should have completed all previous lessons or have a completed Adventure Works Internet Sales sample model project.
If you've created the AW Internet Sales project as part of the tutorial, your model does not yet contain any data or hierarchies that are ragged. To complete this supplemental lesson, you first have to create the problem by adding some additional tables, create relationships, calculated columns, a measure, and a new Organization hierarchy. That part takes about 15 minutes. Then, you get to solve it in just a few minutes.
Add tables and objects
To add new tables to your model
In Tabular Model Explorer, expand Data Sources, then right-click your connection > Import New Tables.
In Navigator, select DimEmployee and FactResellerSales, and then click OK.
In Query Editor, click Import
Create the following relationships:
Table 1 Column Filter Direction Table 2 Column Active FactResellerSales OrderDateKey Default DimDate Date Yes FactResellerSales DueDate Default DimDate Date No FactResellerSales ShipDateKey Default DimDate Date No FactResellerSales ProductKey Default DimProduct ProductKey Yes FactResellerSales EmployeeKey To Both Tables DimEmployee EmployeeKey Yes In the DimEmployee table, create the following calculated columns:
Path
=PATH([EmployeeKey],[ParentEmployeeKey])FullName
=[FirstName] & " " & [MiddleName] & " " & [LastName]Level1
=LOOKUPVALUE(DimEmployee[FullName],DimEmployee[EmployeeKey],PATHITEM([Path],1,1))Level2
=LOOKUPVALUE(DimEmployee[FullName],DimEmployee[EmployeeKey],PATHITEM([Path],2,1))Level3
=LOOKUPVALUE(DimEmployee[FullName],DimEmployee[EmployeeKey],PATHITEM([Path],3,1))Level4
=LOOKUPVALUE(DimEmployee[FullName],DimEmployee[EmployeeKey],PATHITEM([Path],4,1))Level5
=LOOKUPVALUE(DimEmployee[FullName],DimEmployee[EmployeeKey],PATHITEM([Path],5,1))In the DimEmployee table, create a hierarchy named Organization. Add the following columns in-order: Level1, Level2, Level3, Level4, Level5.
In the FactResellerSales table, create the following measure:
ResellerTotalSales:=SUM([SalesAmount])Use Analyze in Excel to open Excel and automatically create a PivotTable.
In PivotTable Fields, add the Organization hierarchy from the DimEmployee table to Rows, and the ResellerTotalSales measure from the FactResellerSales table to Values.
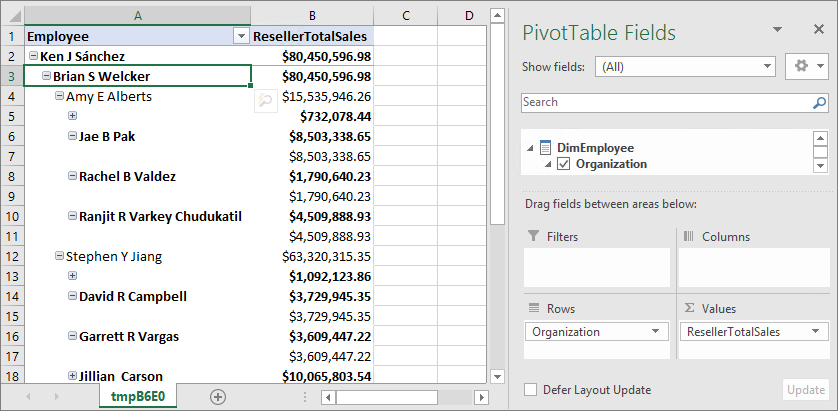
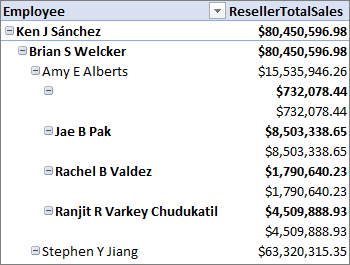
As you can see in the PivotTable, the hierarchy displays rows that are ragged. There are many rows where blank members are shown.
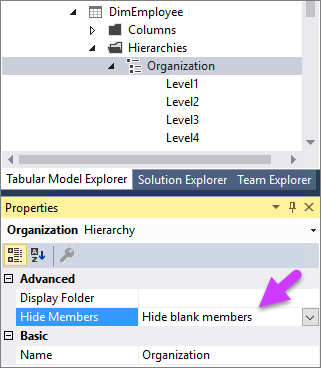
To fix the ragged hierarchy by setting the Hide members property
In Tabular Model Explorer, expand Tables > DimEmployee > Hierarchies > Organization.
In Properties > Hide Members, select Hide blank members.
Back in Excel, refresh the PivotTable.

Now that looks a whole lot better!
See Also
Lesson 9: Create hierarchies
Supplemental Lesson - Dynamic security
Supplemental Lesson - Detail rows
คำติชม
เร็วๆ นี้: ตลอดปี 2024 เราจะขจัดปัญหา GitHub เพื่อเป็นกลไกคำติชมสำหรับเนื้อหา และแทนที่ด้วยระบบคำติชมใหม่ สำหรับข้อมูลเพิ่มเติม ให้ดู: https://aka.ms/ContentUserFeedback
ส่งและดูข้อคิดเห็นสำหรับ