Managing Pipeline & Recurring Jobs in Azure Data Lake Analytics Made Easy
Azure Data Lake Analytics (ADLA) is a big data job service that enables you to develop and run data transformation and processing jobs over petabytes of data. With no clusters or servers to provision or manage, you can process data on demand and scale instantly all while paying only for the jobs you run. This blog describes new capabilities in ADLA that make it easier than ever for you to manage pipeline and recurring jobs.
Customers are developing and deploying increasing numbers of analytics pipelines composed of multiple ADLA jobs and other Azure services. Some customers run more than 5,000 jobs per day extracting key operational and business insights from their big data.
Operating and managing ADLA accounts with thousands of jobs per week becomes a challenge especially when all you see in the portal or get through the ADLA APIs is a flat list of all the jobs. As shown in Fig 1 while multiple pipelines are submitting jobs through Azure Data Factory, developers are submitting ad-hoc jobs to the same accounts. All these jobs are listed as a flat list in the ADLA Portal.
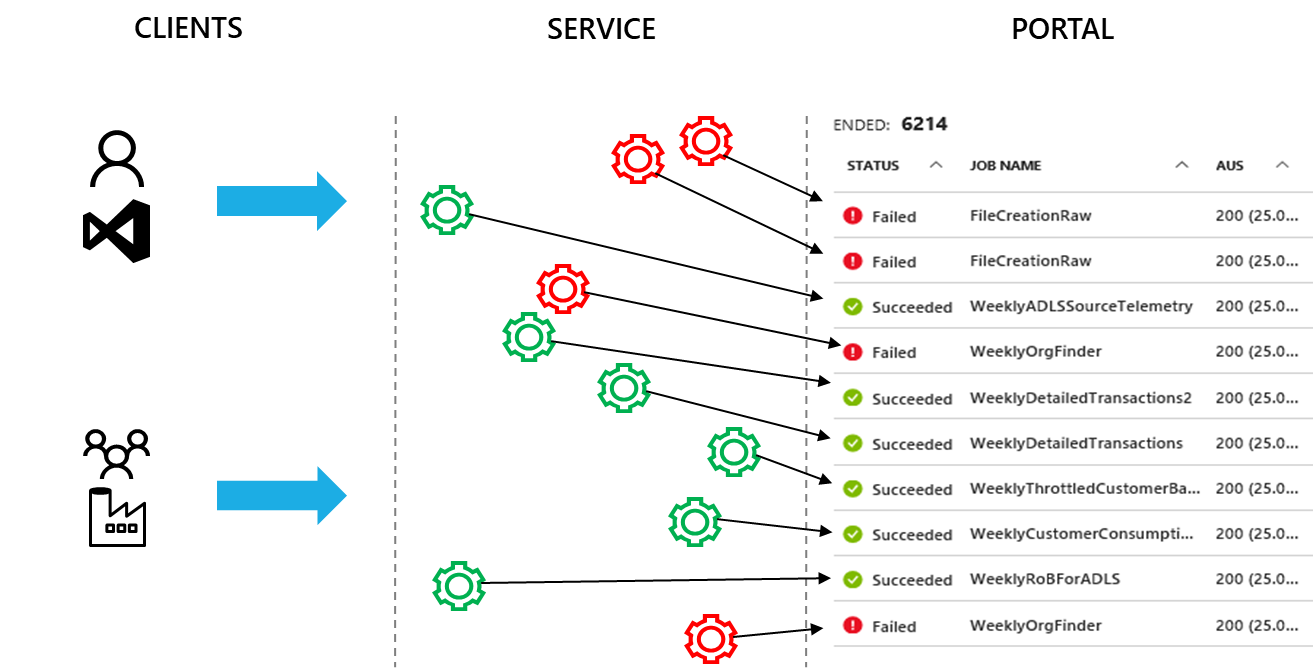
Fig 1 ADLA Jobs are presented as a flat list
The following tasks become very difficult to perform when dealing with a flat, mostly unordered list of jobs:
- Troubleshooting failed jobs or job performance issues in one pipeline -- When a pipeline has failed or missed a deadline, searching for the problematic jobs in the job list and comparing them to successful ones are difficult to achieve today.
- Understanding the cost of a pipeline – Collecting the cost data for each pipeline so that you can make decisions like scheduling frequency is a challenge. Given that jobs can’t be grouped by pipeline, this is almost impossible to get in today’s ADLA service.
Organizing pipeline & recurring ADLA jobs made easy
To make it easier to manage and understand jobs, ADLA now captures the pipeline and recurrence information for each job. This information can be used to connect and organize jobs belonging to the same pipeline or recurring instances. As shown in Fig 2, now jobs are organized by pipeline and recurring instances which enable you to:
- Quickly identify jobs in pipelines which may have failed or taken longer than expected.
- Get the aggregated statistics (e.g. job counts, successful and failed AU hours etc.) for a pipeline or a recurring instance
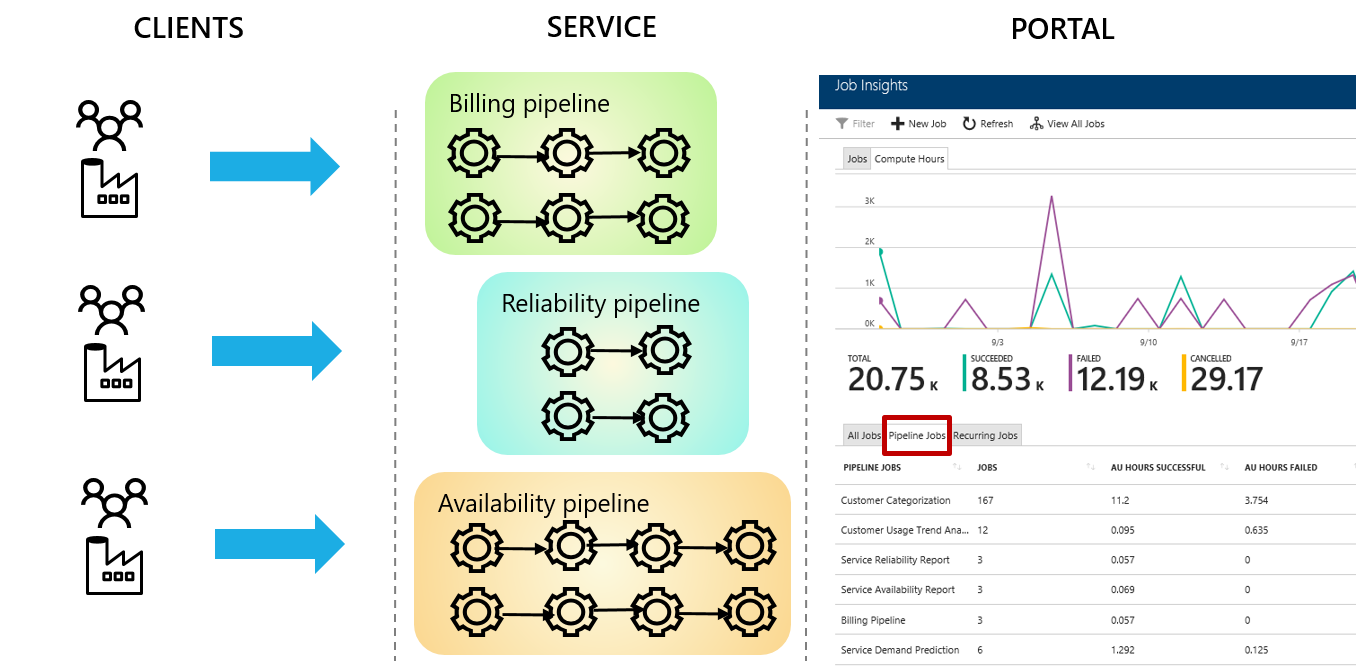
Fig 2 ADLA jobs are organized by pipeline and recurrence
The ADLA service gathers this per-job pipeline and recurrence information from applications (such as ADL tools for Visual Studio, Azure Powershell for ADL etc.) through new properties added to the job submission APIs. Azure Portal for ADLA and ADL Tools for Visual Studio now organize jobs in to pipelines and makes it easier to find and compare related jobs, understand pipeline performance trends etc. You can find more information in our coming blogs and documentations.
If you have developed your own job orchestration and monitoring tools, you can use this new functionality through the ADLA REST APIs and SDK (documentation is here).
With the latest version of Azure Data Factory that Microsoft just announced, you can now manage and gain insights in to the ADLA activities in ADF V2 pipelines. You find more information about ADF V2 here . This feature is not available with your existing ADF V1 pipelines and U-SQL activities.
Typical Use Cases
Scenario 1: Troubleshooting Job Failure and Performance Issues
Once deployed to production, pipeline jobs are expected to run on time and complete successfully. If a pipeline job fails or a pipeline misses the deadline, you need to figure out the root cause as quickly as possible. With the new capability in ADLA, you can take the following steps:
- Group the jobs by pipeline to identify which pipelines have failed jobs and find the one you are interested in debugging further.
- Sort the jobs by runs so that you can check the sequence and the duration of jobs.
- Once you find which jobs have failed or which job took longer than usual, determine which recurrence instance they belong to. Then drill down to that recurrence instance and list all the jobs.
- Find the last successful job to compare with the current problematic one. Through side-by-side comparison, you can further investigate the root cause for the job’s failure or performance regression.
More details on how to debug the root cause by leveraging job comparison will come soon.
Scenario 2: Manage your ADLA Pipeline cost
It is important for customers to understand the cost of operating a pipeline and minimizing unnecessary usage by reducing failures, optimizing performance etc. It is equally important to understand the past trends and to estimate costs in the future.
ADLA now provides the following aggregated statistics for every pipeline and groups of recurring jobs:
- AU hours aggregation statistics: providing data for the past 30 days like total job count and total AU hours per pipeline or recurring instance
- AU hours history: providing daily summary of total job count and AU hours per pipeline or recurring instance
These aggregated statistics make it simple for you to:
- Understand your cost: By knowing the cost of executing an instance of a pipeline, you can decide how frequently to trigger its execution, how much compute capacity to allocate to jobs in the pipeline etc. You can then ensure that your business requirements and budget goals are met.
- Reduce wasted cost: AU hours spent for failed and cancelled jobs are provided for each pipeline. With this data, you can target your debugging efforts to the jobs that may be failing most often.
- Improve the efficiency: ADLA jobs are charged based on the requested AUs and job duration. If you allocate more AUs than the job needs, you are missing an opportunity to save money. Once you have the cost per recurring instance, you can sort by the cost and identify the jobs that need to be optimized for efficiency. You can find more details about job efficiency here.
- Predict future cost: The cost of a job can change due to the input data growth or changes to the business logic. The usage history provided by ADLA makes it possible for you to understand the usage trends of your pipelines. You can use this information to build a model that can provide more accurate estimation of the cost of operating this or similar pipelines in the future.
Resources
More resources coming soon.