Person queries
Important
This article is for the legacy Workplace Analytics app and does not reflect functionality available on the updated Viva Insights platform. Access current documentation for Viva Insights advanced insights here: advanced insights documentation.
The person query analyzes data from the point of view of each individual in the organization.
This creates a lot of flexibility in analyzing data. For example, you can learn:
How time use varies by different organizational attributes?
How specific subgroups in the organization spend their time?
How one aspect of collaboration influences other time-use habits?

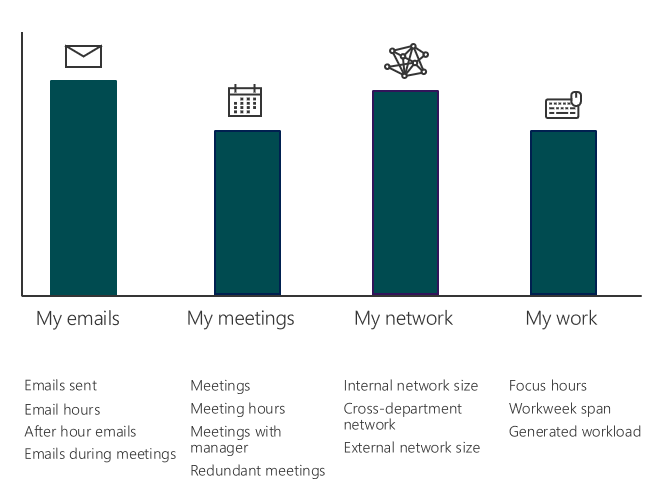
The person query metrics fall within four broad categories. You can add standard metrics from each category to your query. Depending on the analysis, you can summarize a person’s collaboration metrics by day, week, or month.
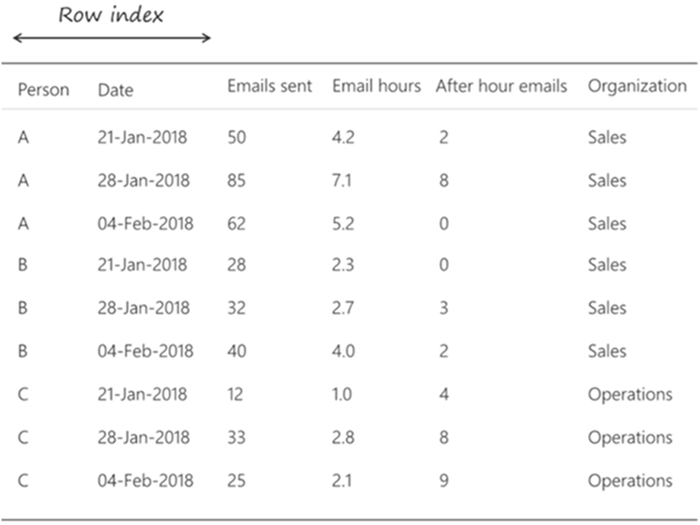
Each query returns one row per person, per period.
The file will include any standard or customized metrics you specify. The IsActive column in the output file is a Boolean value of "TRUE" or "FALSE." Active employees send at least one email or instant message during the unit of time—day, week, or month—defined by the query’s Group by setting.

And your results will include any employee organizational data attributes in the latest available organizational data.

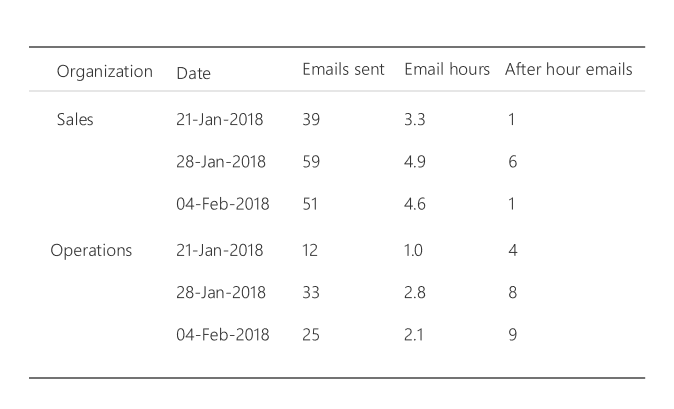
You can use organizational attributes to further summarize the person results and create powerful analyses that compare and contrast the collaboration of different groups in the organization.
Create a person query
It's simple to set up a person query.
- Select whether you want each person's metrics summarized by day, week, or month, and the period you’d like to analyze.
- Select a custom rule set to exclude meetings from the calculations, otherwise it'll use the default.
Select metrics
You can select metrics for what you want to know about your employees. The options vary based on the type of metric, but can include criteria related to their work activities, such as for meetings and email:
- When the meeting occurred
- How many people were invited
- Subject line keywords
- Attendee/organizer attributes
- When email was sent
- How many people were included in the email
- Subject line keywords
- Recipient/sender attributes
For example, you can add a metric to get an email count for each person where at least one person from the Sales organization is included in email.
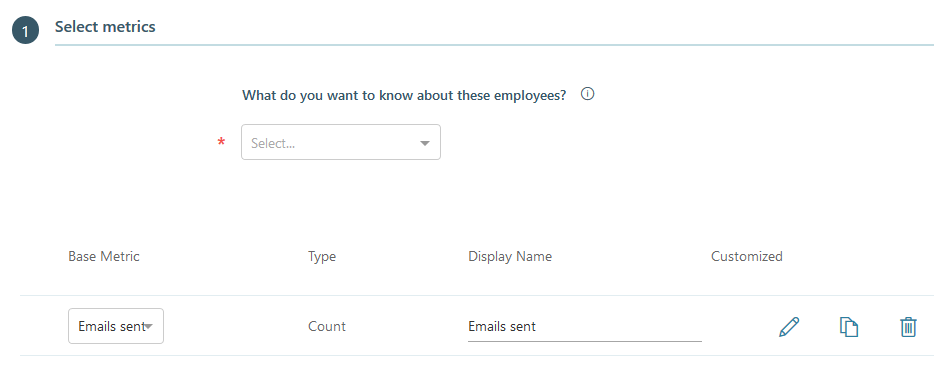
You can add a filter to a base metric and edit the metric name with the filter. For example, the following shows Emails sent to Sales, which will be the column header in the output file.
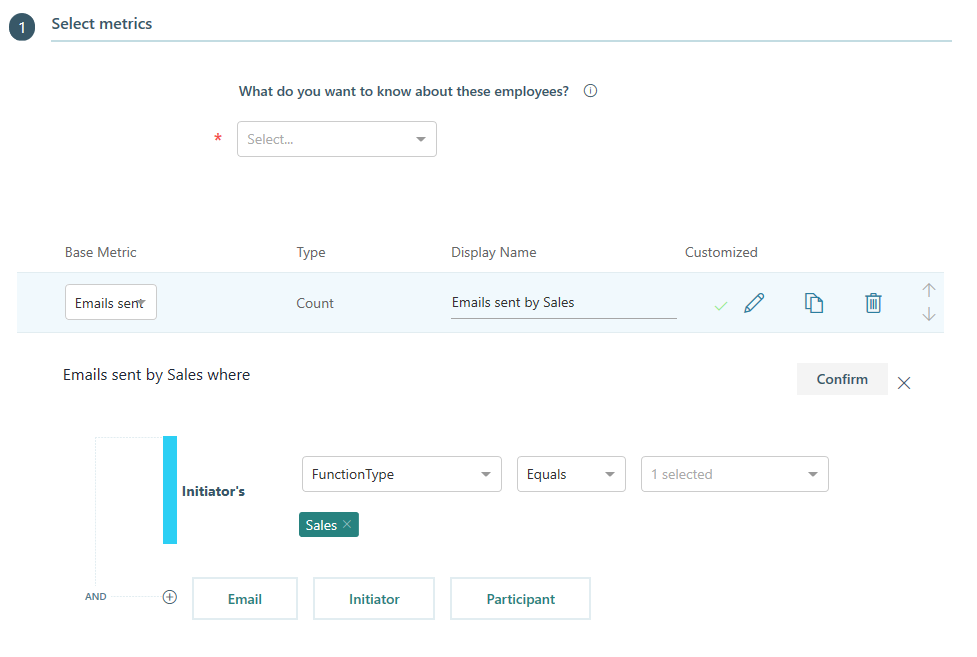
To get more details on adding metric filters, see Customize a metric.
Standardize working hours
In the results for person queries, the reporting for the working hours, after hours, and focus hours metrics is influenced by the working hours that individuals have set in Outlook. This can cause calculation errors if individuals have set unusually long working hours. To avoid this problem, analysts can standardize the working hours that a query uses to calculate these metrics.
Analysts can standardize settings
In the Dependencies section of a person query, analysts can set the working days and hours that that query will use in its calculations.
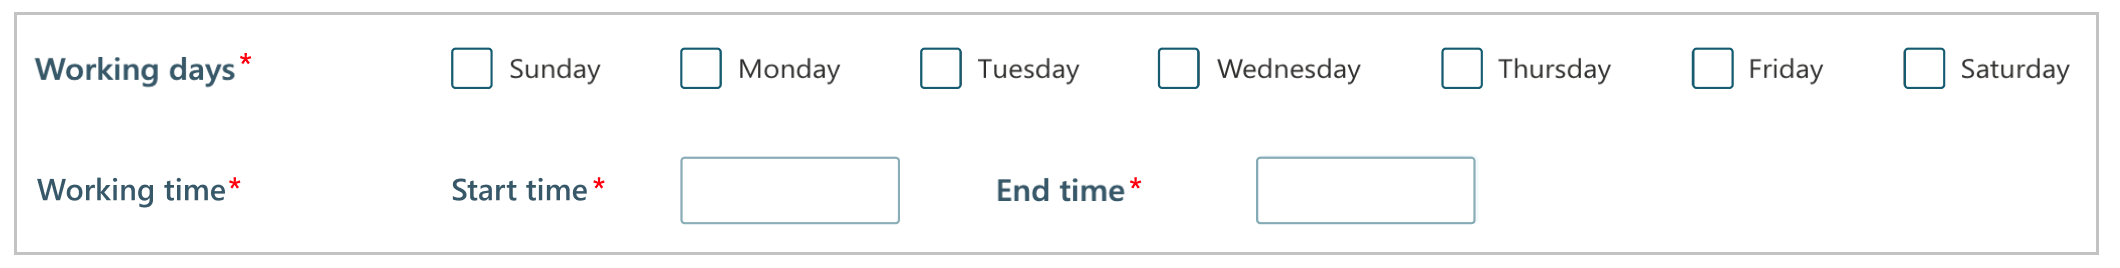
This lets analysts benchmark metrics calculations by using one standard set of values for working hours and days, with the goal of achieving apples-to-apples comparisons. The settings that analysts make are used only within the query and its calculations and do not override any data that is used in any other queries or in any user's settings in Outlook or elsewhere.
Columns in query results
The output of person queries automatically contains information that pertains to these standardized settings:
- It contains columns that show the working start time, working end time, and working days that were used in the query's calculations.
- It indicates which metrics used working hours in the query's calculations.
- It indicates whether the standardized settings were used in the query's calculations.
Select filters
You can select which measured employees you want to include in your query results. For Employees, select whether you want Active, Inactive, or All employees included in the query. Active employees send at least one email or instant message during the unit of time—day, week, or month—defined by the query’s Group by setting.
You can then select other filters to exclude certain rows from the output file based on a person's organizational attributes, such as function type. For example, the following filter will only list people from the Operations and Sales groups.
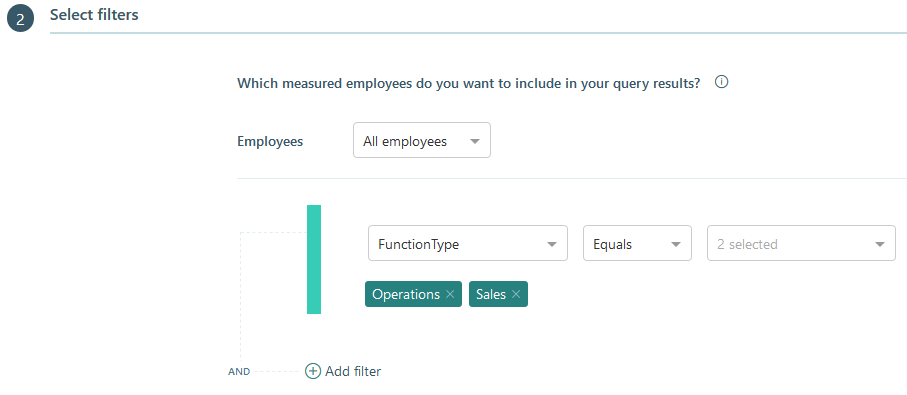
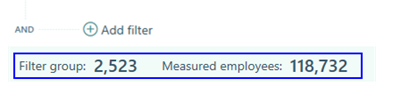
When you add a filter, you'll see the number of people included in the filter group and the total number of measured employees it's based on. This will help you decide if you've set the correct filters for the query before running it.
Select what organizational data to include
When you run a person query, the output (.csv) file can be larger than necessary, with more organizational data columns than you need. Use the Organizational data section to select which data columns to include in the output file, which:
- Improves data analysis with fewer columns in a smaller file.
- Further protects private data by excluding columns from the file.
- Enables you to select Clear all to clear the selected columns and use Select all to include all columns.

Example person query for long meetings
You can create a person query to investigate if long meetings are a significant factor in the total number of meeting hours for Operations. The following custom query uses metrics and filters to customize the data.
Query criteria
- Time frame: Shows the data aggregated weekly
- Who: Filters on Operations
- What data: Metrics
- Meeting hours are the total of all meeting hours
- Long meeting hours that include long meetings that last 2 or more hours
- Meetings is the total number of meetings
- Emails sent is the total number of emails sent
To create a custom person query for long meetings
In Analyze > Query designer, select Get started under Query.
Select Person, and then change Enter query name here to Long Operations meetings and enter a description.
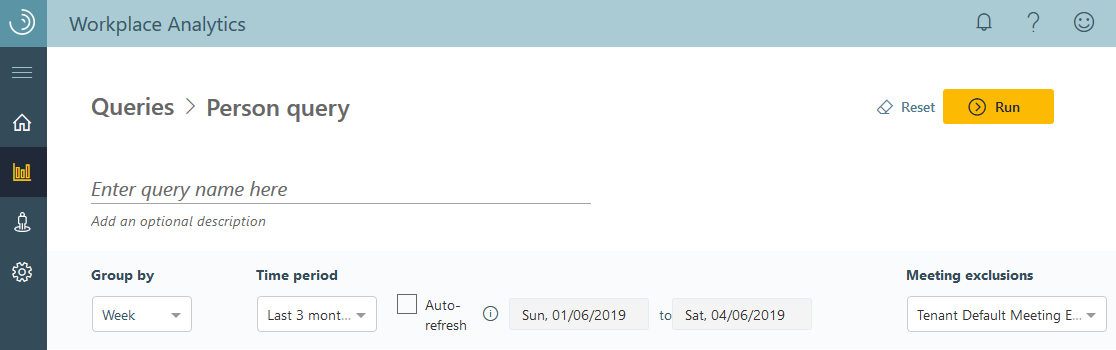
For Group by, select Week.
Select a date range. The query will analyze only the meetings that occurred during this date range.
In the Meeting exclusions menu, select the applicable exclusion rule set.
In the Metrics section, select Add metric, and then select Meeting hours to add a metric for total meeting hours.
Select the Edit icon and change the metric's name to Total meeting hours.
To add a custom metric for long meeting hours, select Add metric, and then select Meeting hours. Choose the Edit icon and change the metric's name to Long meeting hours.
- To customize the Long meeting hours metric, select the Edit icon.
- Choose Add filter.
- In the Long meeting hours where section, select Meeting, and then select DurationHours > greater than or equal to > 2.
- Select Confirm.
To add a metric for total number of meetings, select Add metric, and then select Meetings. Choose the Edit icon and change the name to Total number of meetings.
To add a metric for sent email, select Add metric, and then select Emails sent. Choose the Edit icon and change the metric name to Number of emails sent.
Note
- If no data exists for a person/date combination for a metric, the query results will not have a row for that person/date combination.
- When aggregating data by the week or the month, you might want to include a metric that has a zero value.
- To make sure you have a line of data for every person and date combination for the metrics, add Emails sent as one of your metrics.
- After you export the results, replace all null values with zeros to ensure that calculations for averages and other statistics include all person and date combinations.
In the Filters section, for Employees, select whether you want Active only, Inactive only, or All employees included in the query. Active employees send at least one email or instant message during the unit of time—day, week, or month—defined by the query’s Group by setting.
Select Add filter, and then in the menus, select FunctionType > Equals > Operations.
In the Organizational data section, you can select what data columns to include in the output (.csv) file. Select Clear all to clear all selected columns, and then select which columns you want to include from the list. Use Select all to include all columns, which is the default.
Select Run at the top right to run the query.
In Query designer > Results, the query status shows as Submitted. After the query status changes to Succeeded, you can view it, share it, download it (in .csv file format), delete it, or Copy an OData link to use in a visualization tool, such as Power BI or Excel.
Person query results The following are the columns included in the query results for the custom query created in the previous steps and an example of the type of data rows you might see:
- Person ID - De-identified ID number for the person represented in the metric.
- Date - The start date of the aggregation (i.e. if the week is 6/3 to 6/10, then it is 6/3. If it is a month, then it is the start of the month your data encompasses).
- Person Attributes - Each of the person attributes in the data set supplied by the organizational data.
- Metrics - Any other metrics that you included in the query.
| Person ID | Date | Person attribute 1 (department) | Person attribute 2 (role) | Email hours | Meeting hours |
|---|---|---|---|---|---|
| P1 | 04/25/2019 | HR | Administrator | 5 | 11 |
| P2 | 04/24/2019 | Marketing | Executive | 4 | 14 |