教學課程:使用筆記本分析 Azure 監視器記錄中的資料
筆記本是整合式環境,可讓您使用即時程式碼、方程式、視覺效果和文字來建立和共用文件。 將筆記本與 Log Analytics 工作區整合可讓您建立多步驟程序,以根據上一個步驟的結果,在每個步驟中執行程式碼。 您可以使用這類簡化的程序來建置機器學習管線、進階分析工具、疑難排解指南 (TSG) 來支援需求和其他工作。
將筆記本與 Log Analytics 工作區整合也可讓您:
- 以任何語言執行 KQL 查詢和自訂程式碼。
- 引進新的分析和視覺效果功能,例如新的機器學習模型、自訂時間表和程序樹狀結構。
- 在 Azure 監視器記錄外部整合資料集,例如內部部署資料集。
- 相較於 Azure 入口網站,您可以使用查詢 API 限制來利用增加的服務限制。
在本教學課程中,您會了解如何:
- 使用 Azure 監視器查詢用戶端程式庫和 Azure 身分識別用戶端程式庫,將筆記本與您的 Log Analytics 工作區整合
- 在筆記本中探索和視覺化 Log Analytics 工作區中的資料
- 將資料從筆記本擷取到 Log Analytics 工作區中的自訂資料表 (選擇性)
如需範例來了解如何使用筆記本建置機器學習管線來分析 Azure 監視器記錄中的資料,請參閱此範例筆記本:使用機器學習技術偵測 Azure 監視器記錄中的異常狀況。
提示
必要條件
在本教學課程中,您需要:
包含 CPU 計算執行個體的 Azure Machine Learning 工作區,以及:
- 筆記本。
- 設定為 Python 3.8 或更高版本的核心。
下列角色和權限:
在 Azure 監視器記錄中:記錄分析參與者角色,可從 Logs Analytics 工作區中讀取資料,並將資料傳送至其中。 如需詳細資訊,請參閱管理 Log Analytics 工作區的存取權。
在 Azure Machine Learning 中:
- 資源群組層級擁有者或參與者角色,視需要建立新的 Azure Machine Learning 工作區。
- 執行筆記本所在 Azure Machine Learning 工作區上的參與者角色。
如需詳細資訊,請參閱管理對 Azure Machine Learning 工作區的存取。
工具和筆記本
在本教學課程中,您會使用這些工具:
| 工具 | 描述 |
|---|---|
| Azure 監視器查詢用戶端程式庫 | 可讓您對 Azure 監視器記錄中的資料執行唯讀查詢。 |
| Azure 身分識別用戶端程式庫 | 可讓 Azure SDK 用戶端使用 Microsoft Entra 識別碼進行驗證。 |
| Azure 監視器擷取用戶端程式庫 | 可讓您使用記錄擷取 API 將自訂記錄傳送至 Azure 監視器。 將分析的資料擷取到 Log Analytics 工作區中自訂資料表 (選擇性) 時的必要項目 |
| 資料收集規則、資料收集端點和已註冊的應用程式 | 將分析的資料擷取到 Log Analytics 工作區中自訂資料表 (選擇性) 時的必要項目 |
您可以使用的其他查詢程式庫包括:
- Kqlmagic 程式庫可讓您直接從筆記本內執行 KQL 查詢,就像從 Log Analytics 工具執行 KQL 查詢一樣。
- MSTICPY 程式庫提供範本化查詢,可叫用內建 KQL 時間序列和機器學習功能,並提供 Log Analytics 工作區中資料的進階視覺效果工具和分析。
其他用於進階分析的 Microsoft 筆記本體驗包括:
1.整合 Log Analytics 工作區與筆記本
設定筆記本以查詢 Log Analytics 工作區:
安裝 Azure 監視器查詢、Azure 身分識別和 Azure 監視器擷取用戶端程式庫 (一併安裝 Pandas 資料分析程式庫)、繪圖視覺效果程式庫:
import sys

!{sys.executable} -m pip install --upgrade azure-monitor-query azure-identity azure-monitor-ingestion

!{sys.executable} -m pip install --upgrade pandas plotly
將下列
LOGS_WORKSPACE_ID變數設定為 Log Analytics 工作區的識別碼。 變數目前設定為使用 Azure 監視器示範工作區,您可以使用此工作區來示範筆記本。LOGS_WORKSPACE_ID = "DEMO_WORKSPACE"設定
LogsQueryClient以驗證和查詢 Azure 監視器記錄。此程式碼會設定
LogsQueryClient,以使用DefaultAzureCredential進行驗證:from azure.core.credentials import AzureKeyCredential from azure.core.pipeline.policies import AzureKeyCredentialPolicy from azure.identity import DefaultAzureCredential from azure.monitor.query import LogsQueryClient if LOGS_WORKSPACE_ID == "DEMO_WORKSPACE": credential = AzureKeyCredential("DEMO_KEY") authentication_policy = AzureKeyCredentialPolicy(name="X-Api-Key", credential=credential) else: credential = DefaultAzureCredential() authentication_policy = None logs_query_client = LogsQueryClient(credential, authentication_policy=authentication_policy)LogsQueryClient通常只支援使用 Microsoft Entra 權杖認證進行驗證。 不過,我們可以傳遞自訂驗證原則來啟用 API 金鑰的使用。 這可讓用戶端查詢示範工作區。 此示範工作區的可用性和存取權可能會變更,因此建議使用您自己的 Log Analytics 工作區。定義名為
query_logs_workspace的協助程式函式,以在 Log Analytics 工作區中執行指定的查詢,並以 Pandas DataFrame 傳回結果。import pandas as pd import plotly.express as px from azure.monitor.query import LogsQueryStatus from azure.core.exceptions import HttpResponseError def query_logs_workspace(query): try: response = logs_query_client.query_workspace(LOGS_WORKSPACE_ID, query, timespan=None) if response.status == LogsQueryStatus.PARTIAL: error = response.partial_error data = response.partial_data print(error.message) elif response.status == LogsQueryStatus.SUCCESS: data = response.tables for table in data: my_data = pd.DataFrame(data=table.rows, columns=table.columns) except HttpResponseError as err: print("something fatal happened") print (err) return my_data
2.在您的筆記本中探索和視覺化 Log Analytics 工作區中的資料
讓我們從筆記本執行查詢,查看工作區中的一些資料:
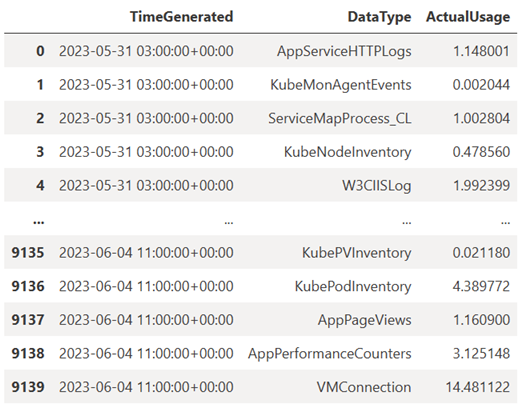
此查詢會檢查過去一週的每一個小時中,您擷取至 Log Analytics 工作區中每個資料表 (資料類型) 的資料量 (以 MB 為單位):
TABLE = "Usage"

QUERY = f"""
let starttime = 7d; // Start date for the time series, counting back from the current date
let endtime = 0d; // today
{TABLE} | project TimeGenerated, DataType, Quantity
| where TimeGenerated between (ago(starttime)..ago(endtime))
| summarize ActualUsage=sum(Quantity) by TimeGenerated=bin(TimeGenerated, 1h), DataType
"""

df = query_logs_workspace(QUERY)
display(df)
產生的 DataFrame 會顯示 Log Analytics 工作區中每個資料表的每小時擷取量:
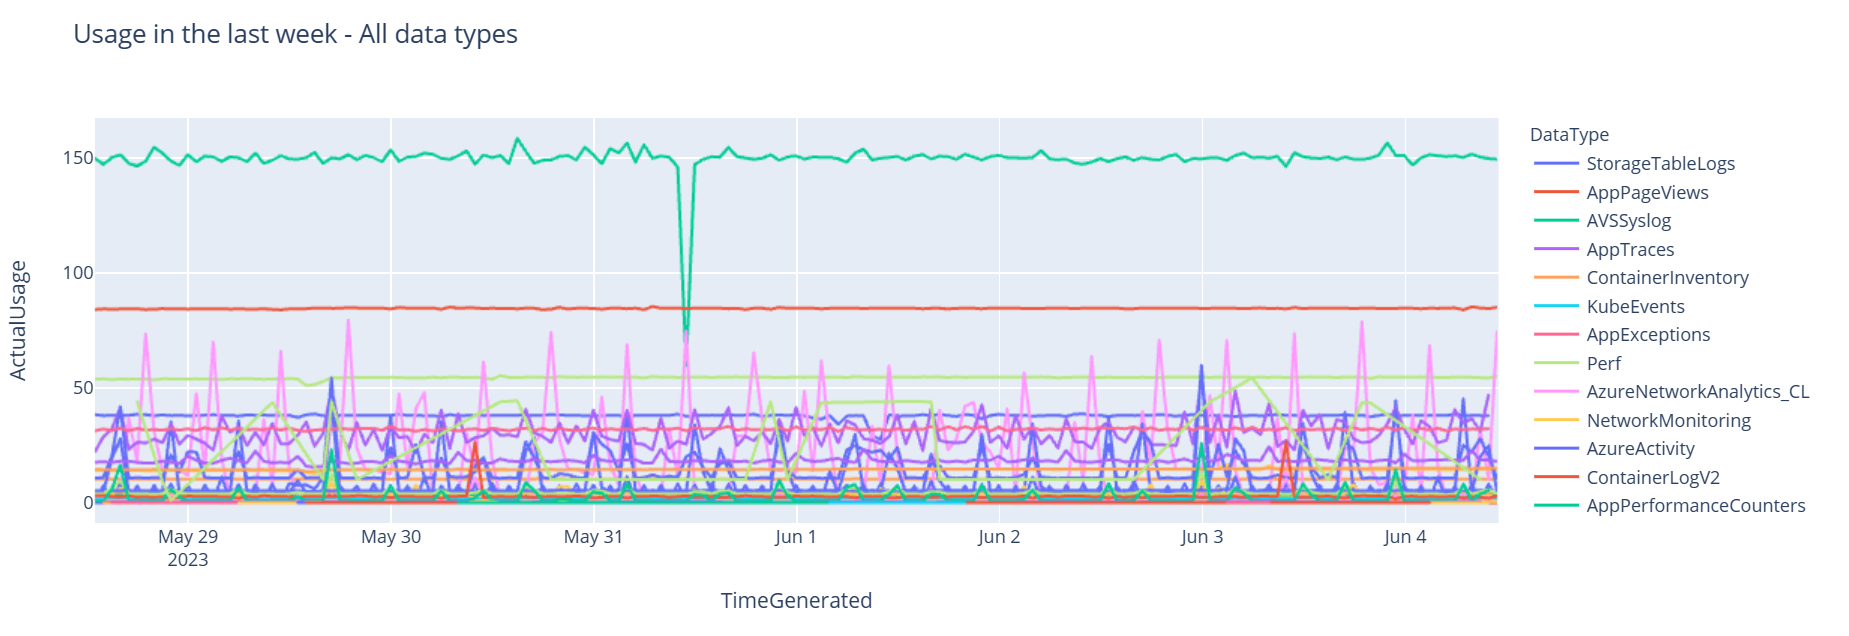
現在,讓我們根據 Pandas DataFrame,以圖表形式檢視資料,其中顯示一段時間內各種資料類型的每小時使用量:
df = df.sort_values(by="TimeGenerated")
graph = px.line(df, x='TimeGenerated', y="ActualUsage", color='DataType', title="Usage in the last week - All data types")
graph.show()
產生的圖表看起來像這樣:
您已成功在筆記本中查詢 Log Analytics 工作區的記錄資料並將其視覺化。

3.分析資料
作為簡單的範例,我們採用前五個資料列:
analyzed_df = df.head(5)
如需如何實作機器學習技術來分析 Azure 監視器記錄中資料的範例,請參閱此範例筆記本:使用機器學習技術偵測 Azure 監視器記錄中的異常狀況。
4.將分析的資料擷取到 Log Analytics 工作區中的自訂資料表 (選擇性)
將您的分析結果傳送至 Log Analytics 工作區中的自訂資料表以觸發警示,或讓資料可供進一步分析。
若要將資料傳送至 Log Analytics 工作區,您需要自訂資料表、資料收集端點、資料收集規則,以及具有資料收集規則使用權限的已註冊 Microsoft Entra 應用程式,如教學課程:使用記錄擷取 API 將資料傳送至 Azure 監視器記錄 (Azure 入口網站) 中所述。
當您建立自訂資料表時:
上傳此範例檔案以定義資料表結構描述:
[
  {
    "TimeGenerated": "2023-03-19T19:56:43.7447391Z",
    "ActualUsage": 40.1,
    "DataType": "AzureDiagnostics"
  }
]
定義記錄擷取 API 所需的常數:
os.environ['AZURE_TENANT_ID'] = "<Tenant ID>"; #ID of the tenant where the data collection endpoint resides
os.environ['AZURE_CLIENT_ID'] = "<Application ID>"; #Application ID to which you granted permissions to your data collection rule
os.environ['AZURE_CLIENT_SECRET'] = "<Client secret>"; #Secret created for the application


os.environ['LOGS_DCR_STREAM_NAME'] = "<Custom stream name>" ##Name of the custom stream from the data collection rule
os.environ['LOGS_DCR_RULE_ID'] = "<Data collection rule immutableId>" # immutableId of your data collection rule
os.environ['DATA_COLLECTION_ENDPOINT'] =  "<Logs ingestion URL of your endpoint>" # URL that looks like this: https://xxxx.ingest.monitor.azure.com
將資料擷取至 Log Analytics 工作區中的自訂資料表:
from azure.core.exceptions import HttpResponseError
from azure.identity import ClientSecretCredential
from azure.monitor.ingestion import LogsIngestionClient
import json


credential = ClientSecretCredential(
    tenant_id=AZURE_TENANT_ID,
    client_id=AZURE_CLIENT_ID,
    client_secret=AZURE_CLIENT_SECRET
)

client = LogsIngestionClient(endpoint=DATA_COLLECTION_ENDPOINT, credential=credential, logging_enable=True)

body = json.loads(analyzed_df.to_json(orient='records', date_format='iso'))

try:
   response =  client.upload(rule_id=LOGS_DCR_RULE_ID, stream_name=LOGS_DCR_STREAM_NAME, logs=body)
   print("Upload request accepted")
except HttpResponseError as e:
    print(f"Upload failed: {e}")
注意
當您在 Log Analytics 工作區中建立資料表時,擷取的資料最多可能需要 15 分鐘才會出現在資料表中。
確認資料現在出現在您的自訂資料表中。

下一步
深入了解如何: