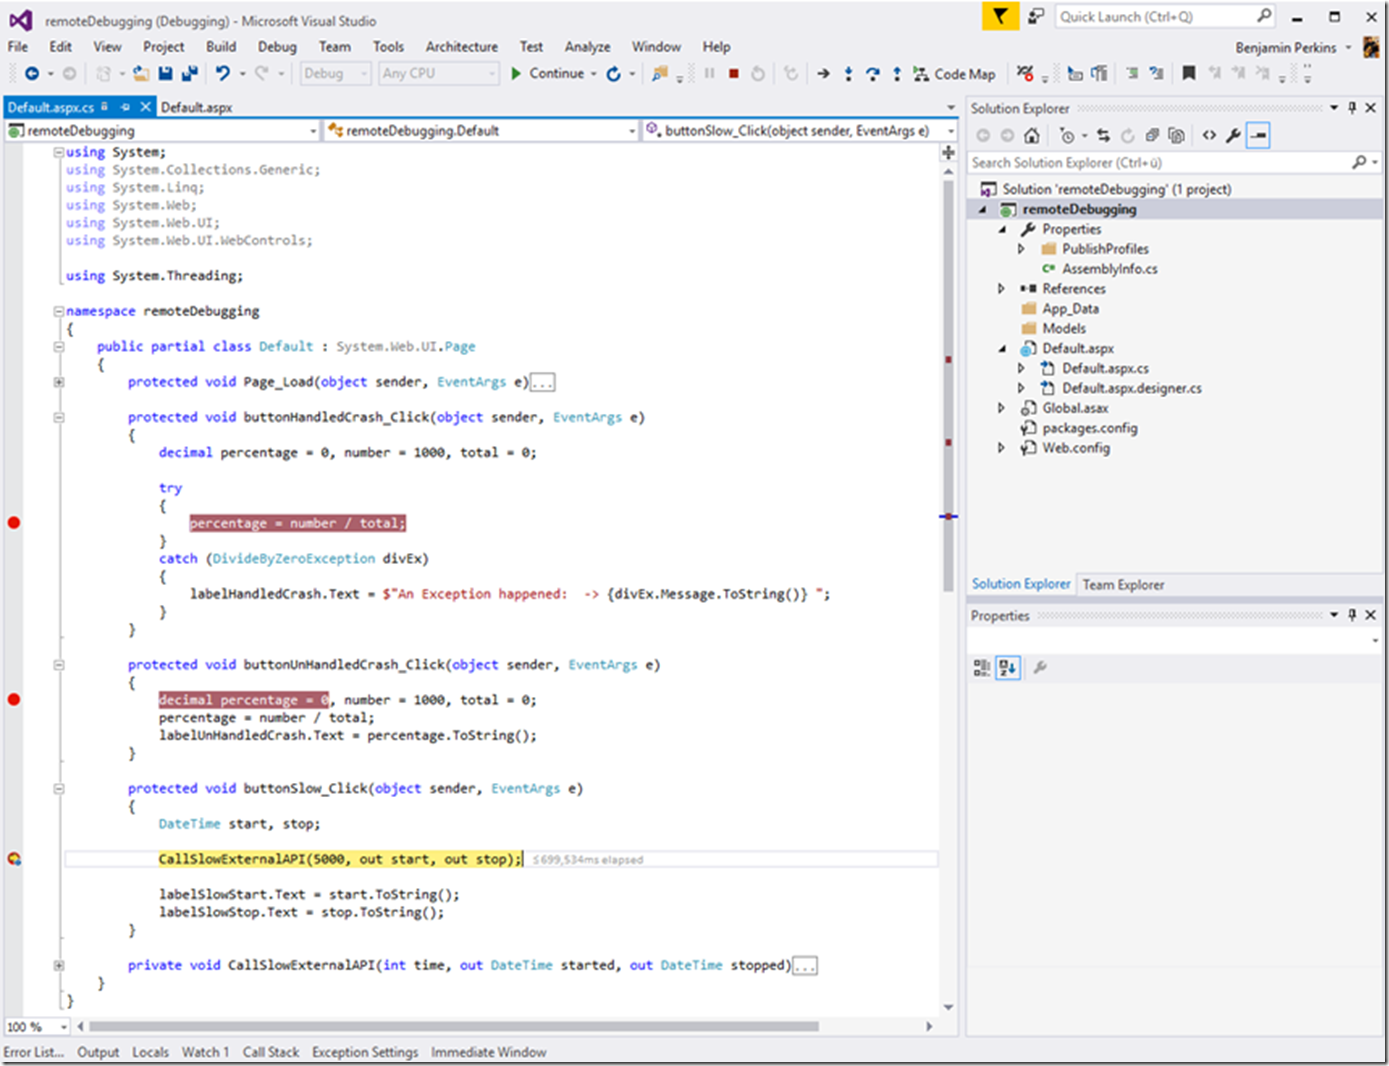
I created a sample ASP.NET application that you can download from here that contains a slow running request, a handled and an unhandled exception.
UPDATE: I wrote an article here about remote debugging in Visual Studio 2017 and ASP.NET Core here, titled “Remote debug your Azure App Service 2017 including ASP.NET Core”, JIC you are interested.
To configure and remote debug your Microsoft Azure App Service Web App, you will need to perform the following:
- Have a Web App deployed to the Azure platform
- Attach the remote debugger to the Web App
- Confirm the remote debugger is attached to the W3WP process
- Set the break points
- Execute the process which is rendering the exception, performing slow or in an unexpected manner
- Debugging other technologies
Attach the remote debugger to the Web App
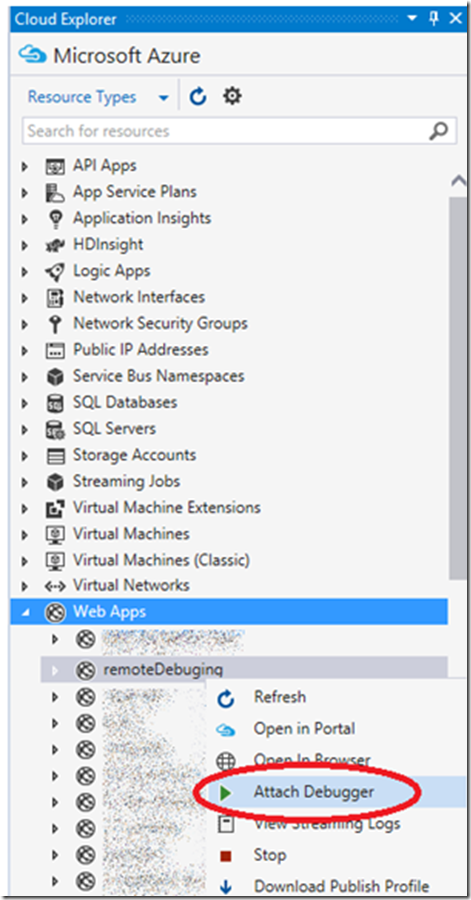
Within Visual Studio open the Cloud Explorer, expand the Web Apps, right-click the Web App you want to attach to and click Attach Debugger, as shown in Figure 1. You can download Cloud Explorer here or install it from within Visual Studio by selecting Tools -> Extensions and Updates…, then search for Cloud Explorer.
Figure 1, attach a remote debugger to a Microsoft Azure App Service Web App
If you have not already enabled the remote debugging application setting, it will be done for you when you attach the debugger for the first time. You can see the setting in the portal as illustrated in Figure 2.
Figure 2, Enable Remote Debugging for a Microsoft Azure App Service Web App
If your Web App uses an IP based SSL certificate you might get this exception:
System.Runtime.InteropServices.COMException (0x89710023): Unable to connect to the Microsoft Visual Studio Remote Debugger named ‘***’. The Visual Studio 2015 Remote Debugger (MSVSMON.EXE) does not appear to be running on the remote computer. This may be because a firewall is preventing communication to the remote computer. Please see Help for assistance on configuring remote debugging.
Without going into much detail, what you have to do is get the IP address of your KUDU console, which I describe here and use that IP address for the *.azurewebsites.net hostname you are remote debugging by adding the IP HOSTNAME combination to the HOSTS file.
Confirm the remote debugger is attached to the W3WP process
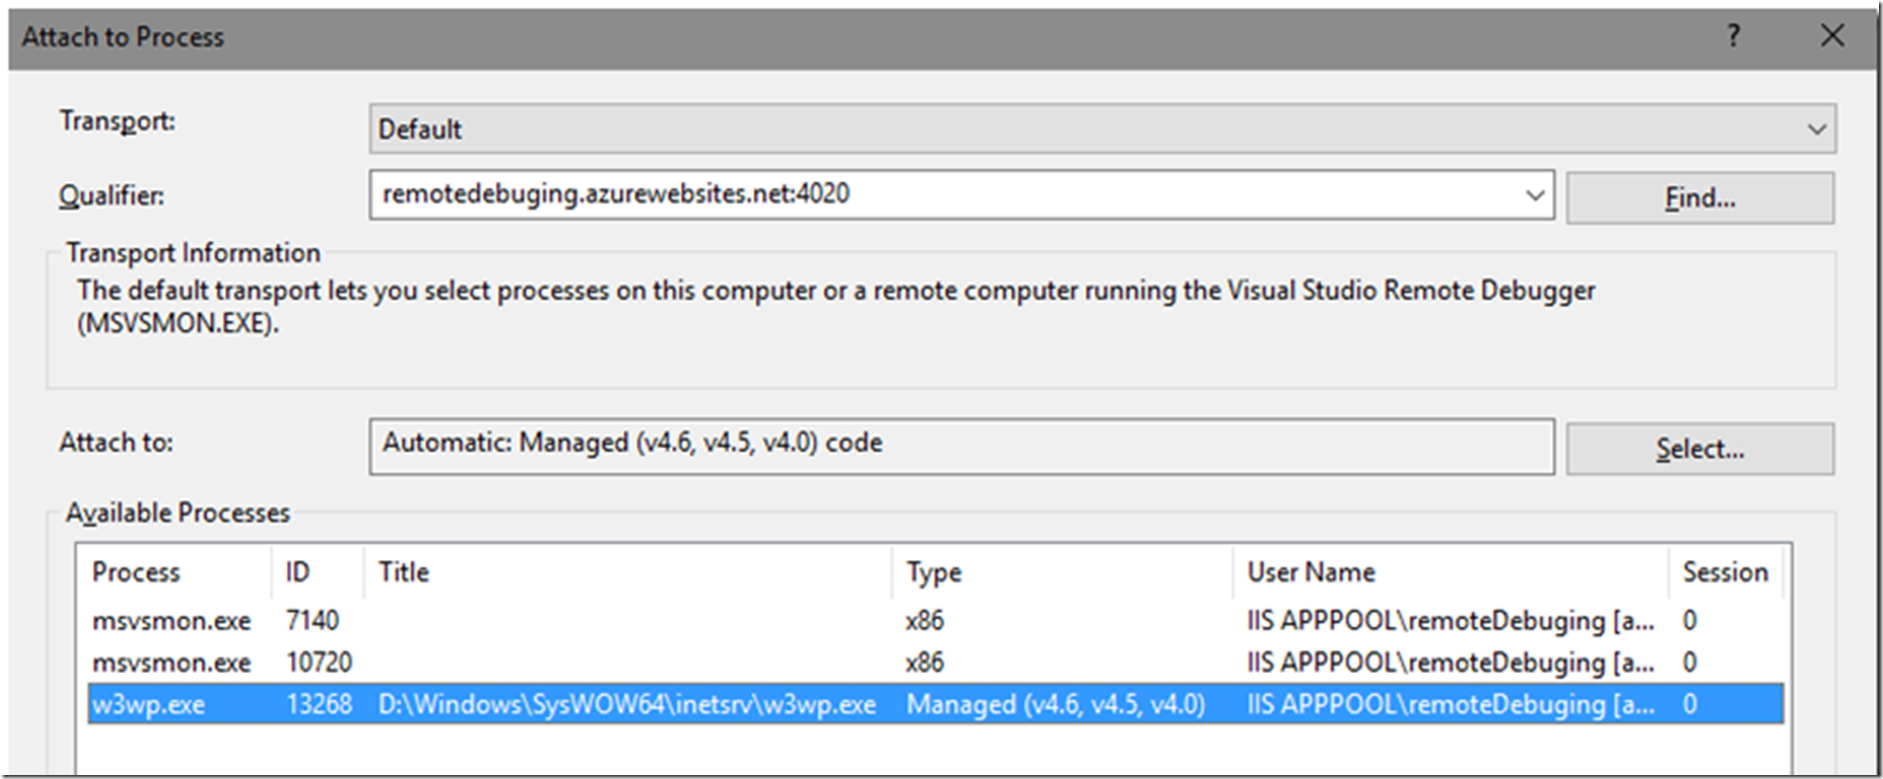
After the Web App opens in the browser return to Visual Studio and click on Debug –> Attach to Process…. Then select the Web App to which you want to debug from the Qualifier drop down as shown in Figure 3.
Figure 3, attach the debugger to the desired Web App and process
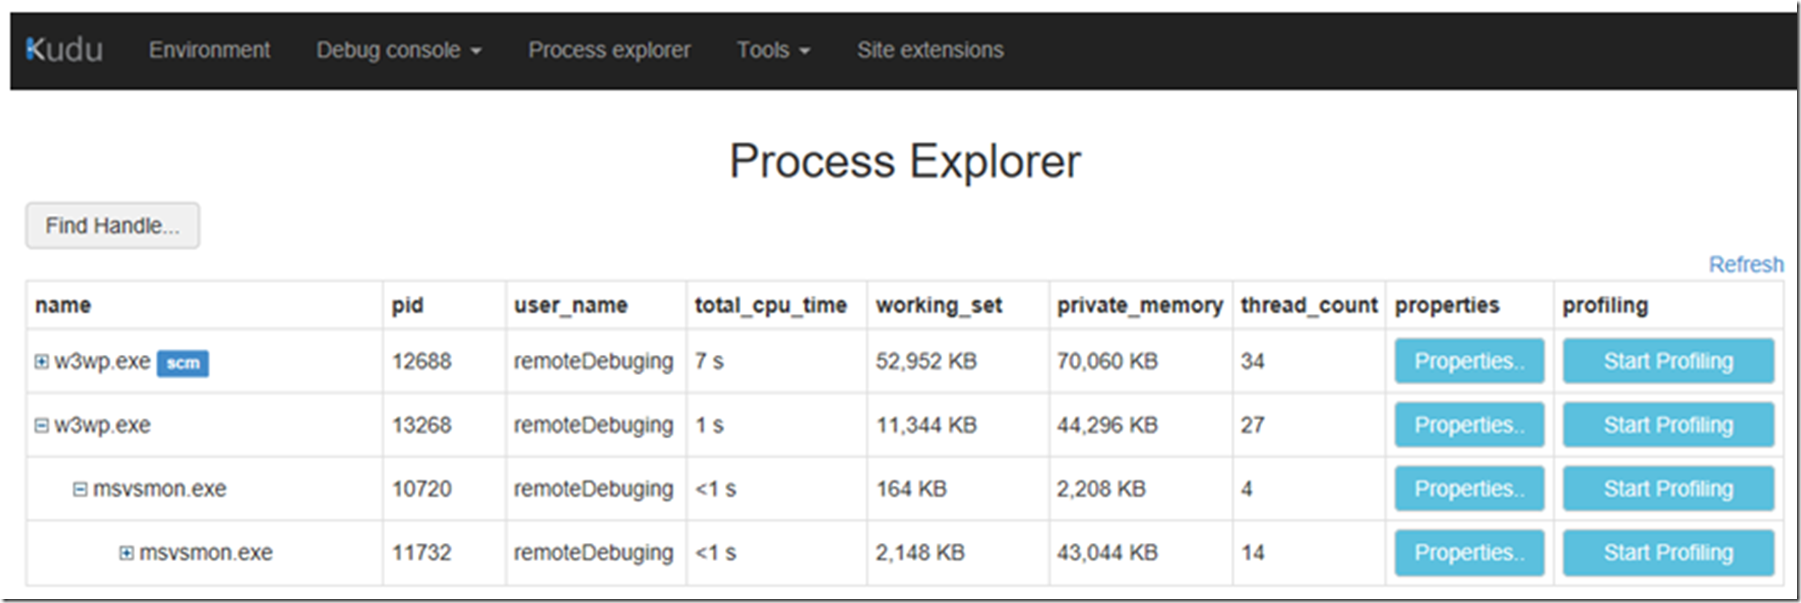
Note that you can compare the PID of the W3WP process within the Available Processes list with the PID of the W3WP process seen in the process explorer in KUDU. See Figure 4.
Figure 4, compare W3WP PID between Visual Studio and Kudu process explorer
Once confirmed move on and start debugging.
Set the break points
When you attach the debugger to your Web App it will open the Web App in you browser. Leave the browser open but change the focus to Visual Studio and set your breakpoints just like you would when debugging locally.
- Debug must be = true
- Remote debugging requires symbols and there are no symbols for ASP.NET Web Sites, they exist only for ASP.NET Projects, so if you get this error when setting a break point, you will not be able to remote debug: ***“The breakpoint will not currently be hit. No symbols have been loaded for this document.” *** (SEO TAG: debug break points not hit when remote debugging)
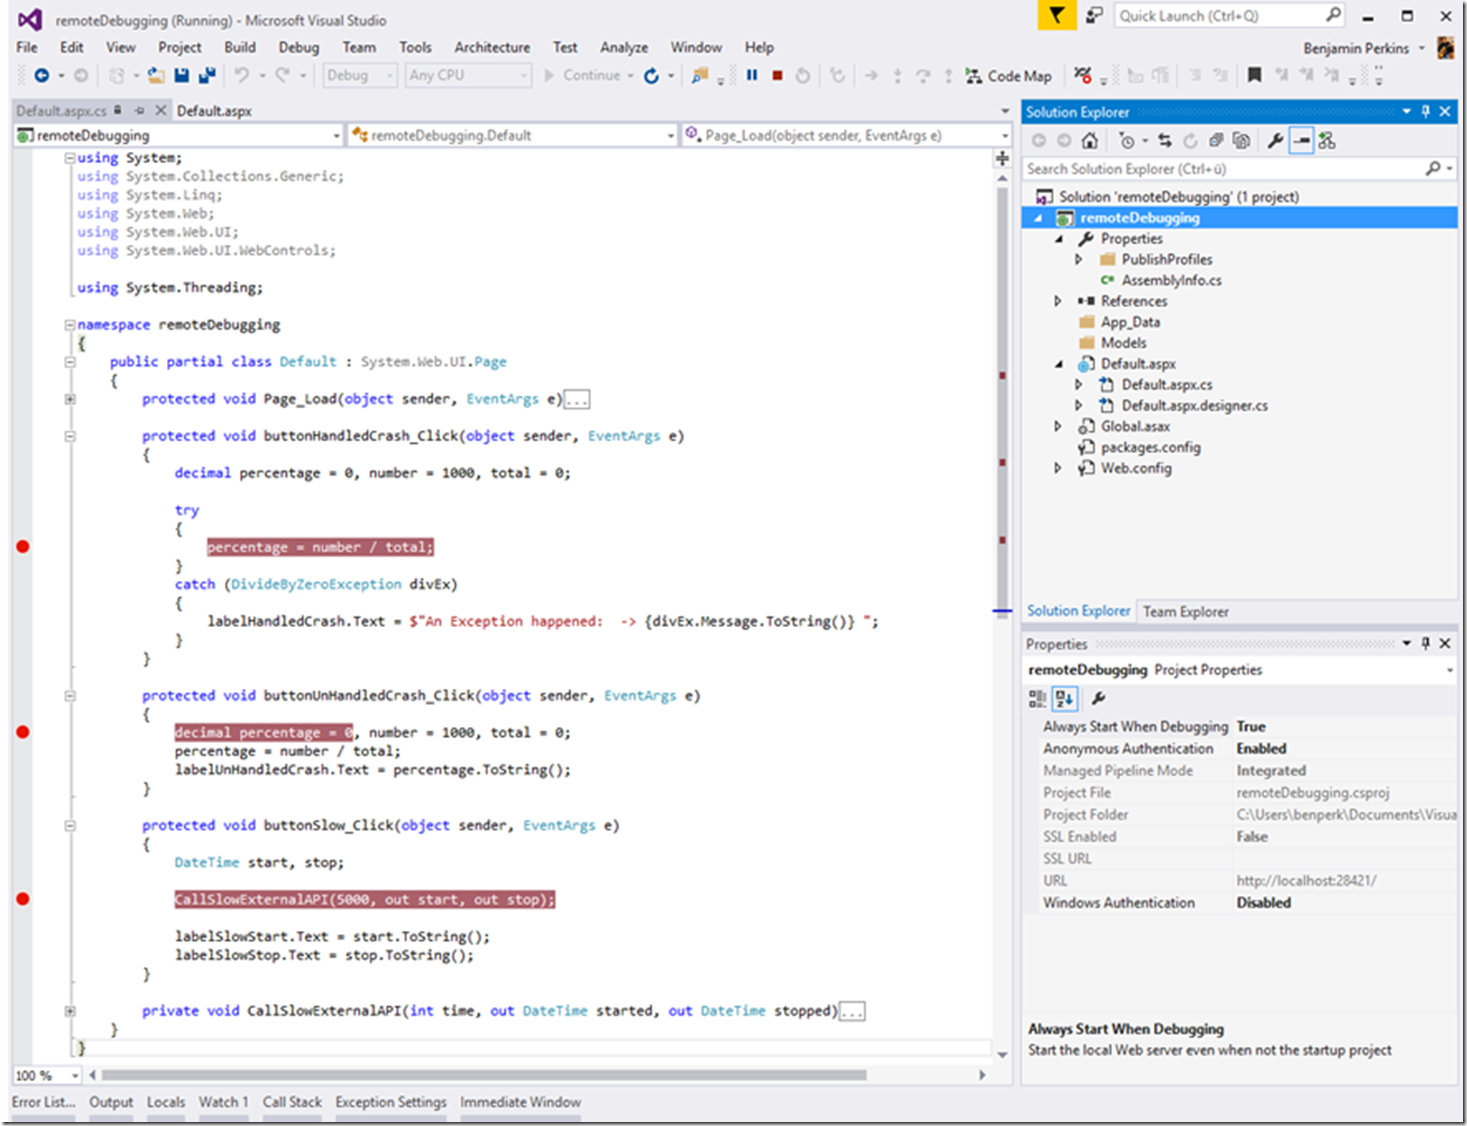
As shown in Figure 5, set a break point to troubleshoot the code.
Figure 5, set break points to remote debug the Microsoft Azure App Service Web App
Navigate back to the browser where your Web App is displayed, the example code Web App looks like this:
Figure 6, set break points to remote debug the Microsoft Azure App Service Web App
Execute the process which is rendering the exception, performing slow or in an unexpected manner
Just like when debugging locally, as I have set a break point on the CallSlowExternalAPI() method in the buttonSlow_Click() method, when I click on the Slow button it breaks at that point and I can step through the code to see why and where the code is slow. See Figure 7 which illustrates the break in the execution of the code.
Figure 7, debug break points is hit when remote debugging
That’s it. Happy debugging.
Debugging other technologies
Notes about debugging
Have a look at the section “Notes about debugging” here.
- It is not recommended to run debug mode in production, because running in debug mode will prevent the web server from responding to other requests.
- Avoid long stops at breakpoints.
- Make sure debug=true, check out my other article about that here and here.
- After 48 hours, the remote debug feature is automatically turned off
