你当前正在访问 Microsoft Azure Global Edition 技术文档网站。 如果需要访问由世纪互联运营的 Microsoft Azure 中国技术文档网站,请访问 https://docs.azure.cn。
向地图添加多边形挤压层 (Android SDK)
本文介绍如何使用多边形挤压层将 Polygon 和 MultiPolygon 特征几何体的面积呈现为挤压形状。
注意
Azure Maps Android SDK 停用
适用于 Android 的 Azure Maps 本机 SDK 现已弃用,将于 2025 年 3 月 31 日停用。 为了避免服务中断,请在 2025 年 3 月 31 日之前迁移到 Azure Maps Web SDK。 有关详细信息,请参阅 Azure Maps Android SDK 迁移指南。
使用多边形挤压层
将多边形挤压层连接到数据源。 然后,将其加载到地图中。 多边形挤压层会将 Polygon 和 MultiPolygon 特征的区域呈现为挤压形状。 多边形挤压层的 height 和 base 属性定义了与挤压形状的地面和高度的基准距离(以米为单位)。 下面的代码演示如何创建一个多边形,如何将其添加到数据源中,以及如何使用多边形挤压层类进行呈现。
注意
多边形挤压层中定义的 base 值应小于或等于 height 的值。
//Create a data source and add it to the map.
DataSource source = new DataSource();
map.sources.add(source);

//Create a polygon.
source.add(Polygon.fromLngLats(
    Arrays.asList(
        Arrays.asList(
            Point.fromLngLat(-73.958383, 40.800279),
            Point.fromLngLat(-73.981547, 40.768459),
            Point.fromLngLat(-73.981246, 40.767761),
            Point.fromLngLat(-73.973618, 40.764616),
            Point.fromLngLat(-73.973060, 40.765128),
            Point.fromLngLat(-73.972599, 40.764908),
            Point.fromLngLat(-73.949446, 40.796584),
            Point.fromLngLat(-73.949661, 40.797088),
            Point.fromLngLat(-73.957815, 40.800523),
            Point.fromLngLat(-73.958383, 40.800279)
        )
    )
));

//Create and add a polygon extrusion layer to the map below the labels so that they are still readable.
PolygonExtrusionLayer layer = new PolygonExtrusionLayer(source,
    fillColor("#fc0303"),
    fillOpacity(0.7f),
    height(500f)
);

//Create and add a polygon extrusion layer to the map below the labels so that they are still readable.
map.layers.add(layer, "labels");
//Create a data source and add it to the map.
val source = DataSource()
map.sources.add(source)

//Create a polygon.
source.add(
    Polygon.fromLngLats(
        Arrays.asList(
            Arrays.asList(
                Point.fromLngLat(-73.958383, 40.800279),
                Point.fromLngLat(-73.981547, 40.768459),
                Point.fromLngLat(-73.981246, 40.767761),
                Point.fromLngLat(-73.973618, 40.764616),
                Point.fromLngLat(-73.973060, 40.765128),
                Point.fromLngLat(-73.972599, 40.764908),
                Point.fromLngLat(-73.949446, 40.796584),
                Point.fromLngLat(-73.949661, 40.797088),
                Point.fromLngLat(-73.957815, 40.800523),
                Point.fromLngLat(-73.958383, 40.800279)
            )
        )
    )
)

//Create and add a polygon extrusion layer to the map below the labels so that they are still readable.
val layer = PolygonExtrusionLayer(
    source,
    fillColor("#fc0303"),
    fillOpacity(0.7f),
    height(500f)
)

//Create and add a polygon extrusion layer to the map below the labels so that they are still readable.
map.layers.add(layer, "labels")
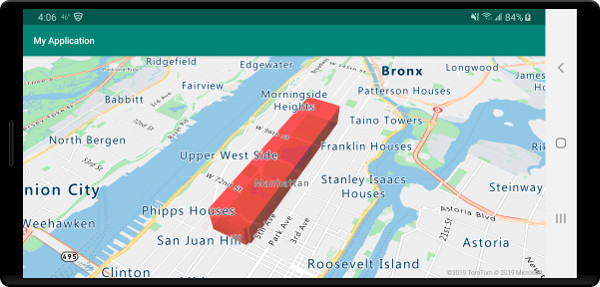
以下屏幕截图显示了上述使用多边形挤压层呈现垂直拉伸的多边形的代码。
添加数据驱动多边形
可以使用多边形挤压层来呈现分级统计图。 将挤压层的 height 和 fillColor 属性设置为 Polygon 和 MultiPolygon 特征几何形状中统计变量的度量。 下面的代码示例根据状态的人口密度度量值显示美国的挤压分级统计图。
//Create a data source and add it to the map.
DataSource source = new DataSource();

//Import the geojson data and add it to the data source.
source.importDataFromUrl("https://samples.azuremaps.com/data/geojson/US_States_Population_Density.json");

//Add data source to the map.
map.sources.add(source);

//Create and add a polygon extrusion layer to the map below the labels so that they are still readable.
PolygonExtrusionLayer layer = new PolygonExtrusionLayer(source,
    fillOpacity(0.7f),
    fillColor(
        step(
            get("density"),
            literal("rgba(0, 255, 128, 1)"),
            stop(10, "rgba(9, 224, 118, 1)"),
            stop(20, "rgba(11, 191, 103, 1)"),
            stop(50, "rgba(247, 227, 5, 1)"),
            stop(100, "rgba(247, 199, 7, 1)"),
            stop(200, "rgba(247, 130, 5, 1)"),
            stop(500, "rgba(247, 94, 5, 1)"),
            stop(1000, "rgba(247, 37, 5, 1)")
        )
    ),
    height(
        interpolate(
            linear(),
            get("density"),
            stop(0, 100),
            stop(1200, 960000)
        )
    )
);

//Create and add a polygon extrusion layer to the map below the labels so that they are still readable.
map.layers.add(layer, "labels");
//Create a data source and add it to the map.
val source = DataSource()

//Import the geojson data and add it to the data source.
source.importDataFromUrl("https://samples.azuremaps.com/data/geojson/US_States_Population_Density.json")

//Add data source to the map.
map.sources.add(source)

//Create and add a polygon extrusion layer to the map below the labels so that they are still readable.
val layer = PolygonExtrusionLayer(
    source,
    fillOpacity(0.7f),
    fillColor(
        step(
            get("density"),
            literal("rgba(0, 255, 128, 1)"),
            stop(10, "rgba(9, 224, 118, 1)"),
            stop(20, "rgba(11, 191, 103, 1)"),
            stop(50, "rgba(247, 227, 5, 1)"),
            stop(100, "rgba(247, 199, 7, 1)"),
            stop(200, "rgba(247, 130, 5, 1)"),
            stop(500, "rgba(247, 94, 5, 1)"),
            stop(1000, "rgba(247, 37, 5, 1)")
        )
    ),
    height(
        interpolate(
            linear(),
            get("density"),
            stop(0, 100),
            stop(1200, 960000)
        )
    )
)

//Create and add a polygon extrusion layer to the map below the labels so that they are still readable.
map.layers.add(layer, "labels")
下面的屏幕截图显示了美国的分级统计图,该图已着色并根据人口密度垂直拉伸成挤压多边形。

后续步骤
有关可向地图添加的更多代码示例,请参阅以下文章: