你当前正在访问 Microsoft Azure Global Edition 技术文档网站。 如果需要访问由世纪互联运营的 Microsoft Azure 中国技术文档网站,请访问 https://docs.azure.cn。
为事件网格资源启用诊断日志
本文提供有关为事件网格资源启用诊断设置的分步说明。 通过这些设置,可以捕获和查看诊断信息,以便排查出现的故障。 下表显示了可用于不同类型的事件网格资源(自定义主题、系统主题和域)的设置。
| 诊断设置 | 事件网格主题 | 事件网格系统主题 | 事件域 | 事件网格合作伙伴命名空间 |
|---|---|---|---|---|
| DeliveryFailures | 是 | 是 | 是 | 否 |
| PublishFailures | 是 | 否 | 是 | 是 |
| DataPlaneRequests | 是 | 否 | 是 | 是 |
重要
有关传送失败、发布失败和数据平面请求的架构,请参阅诊断日志。
先决条件
- 预配的事件网格资源
- 用于捕获诊断日志的预配目标:
- Log Analytics 工作区
- 存储帐户
- 事件中心
- 合作伙伴解决方案
为事件网格主题和域启用诊断日志
注意
以下过程提供了有关如何为主题启用诊断日志的分步说明。 为域启用诊断日志的步骤非常相似。 在步骤 2 中,导航到 Azure 门户中的事件网格域。
登录 Azure 门户。
导航到要为其启用诊断日志设置的事件网格主题。
在顶部搜索栏中,搜索“事件网格主题”。

从列表中选择要为其配置诊断设置的主题。
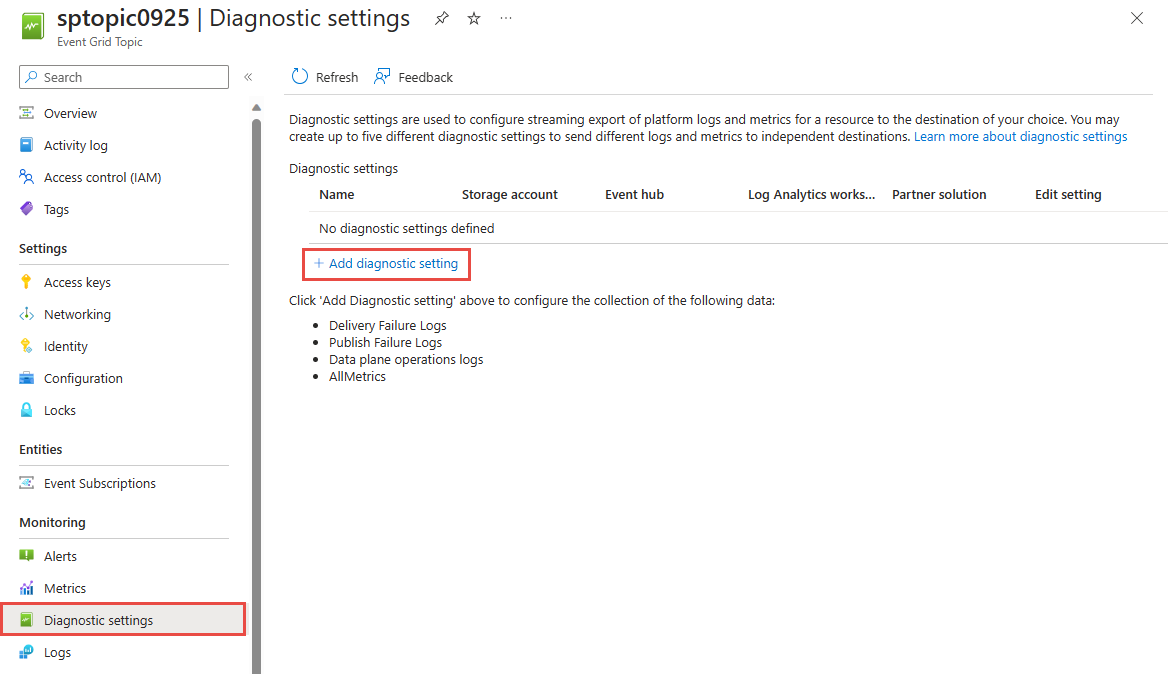
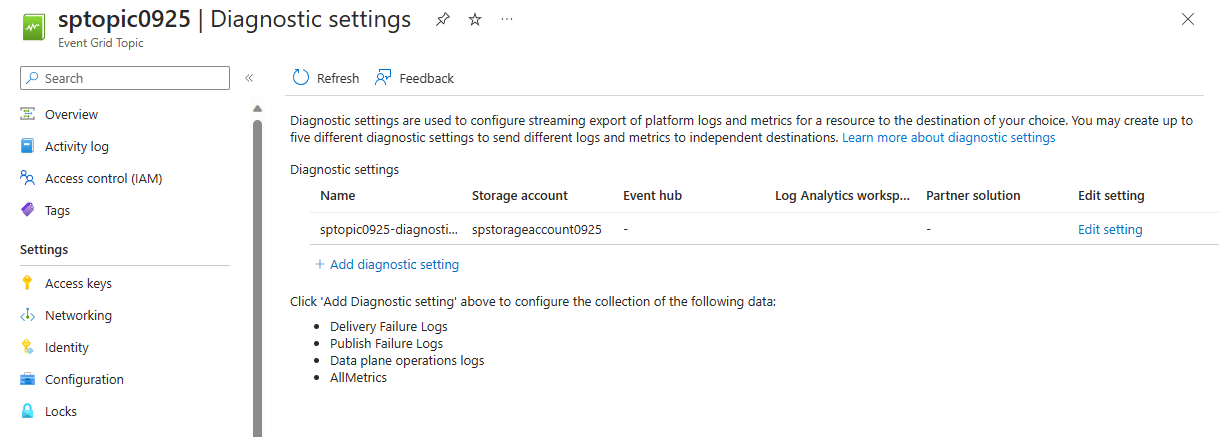
在左侧菜单中的“监视”下,选择“诊断设置”。
在“诊断设置”页面上,选择“添加新的诊断设置”。
为诊断设置指定一个名称。
在“日志”部分选择“allLogs”选项 。
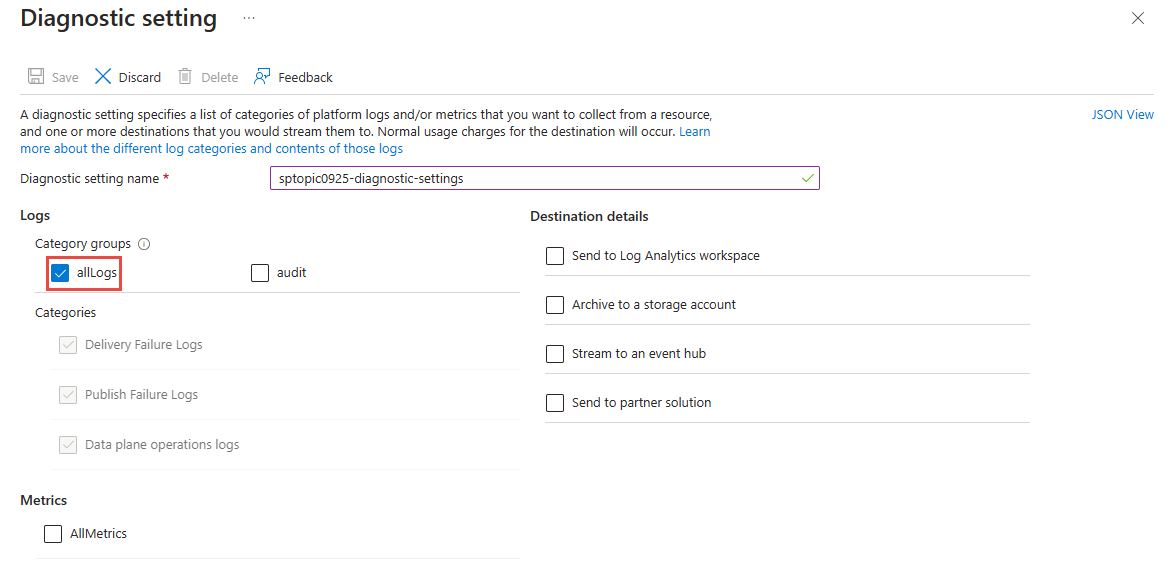
为日志启用一个或多个捕获目标,然后通过选择以前创建的捕获资源对其进行配置。
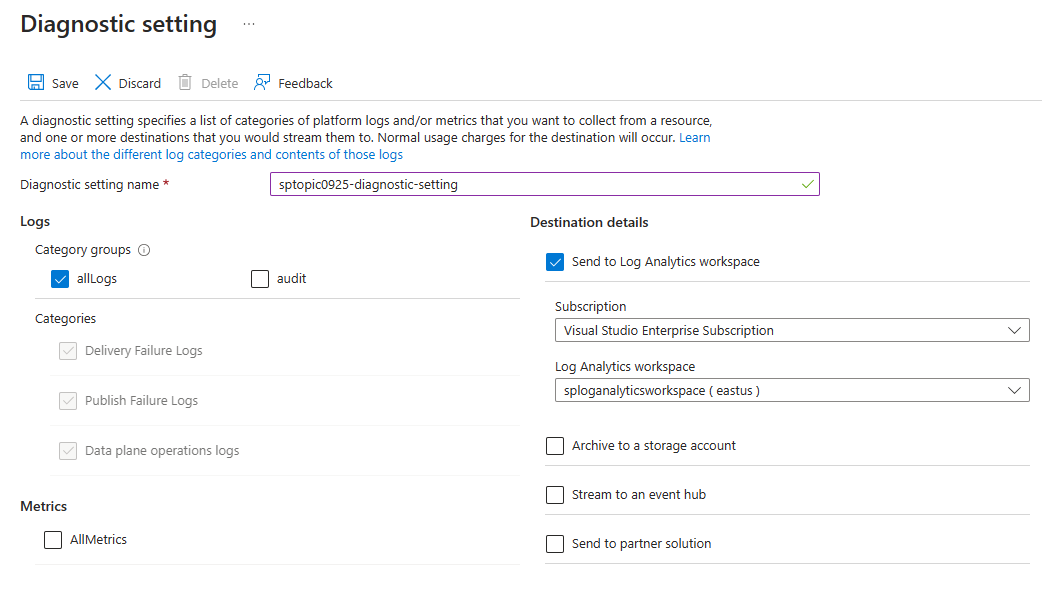
如果选择“发送到 Log Analytics”,请选择 Log Analytics 工作区。
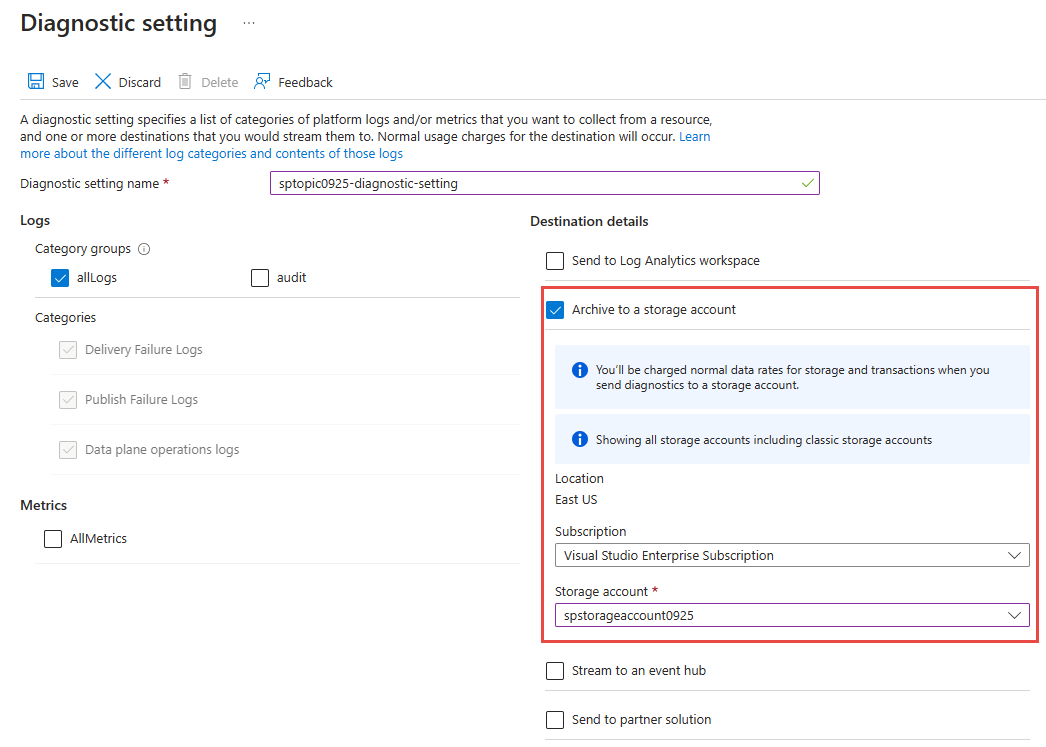
如果选择“存档到存储帐户”,请选择“存储帐户 - 配置”,然后选择你的 Azure 订阅中的存储帐户。
如果选择“流式传输到事件中心”,请选择“事件中心 - 配置”,然后选择事件中心命名空间、事件中心和访问策略。
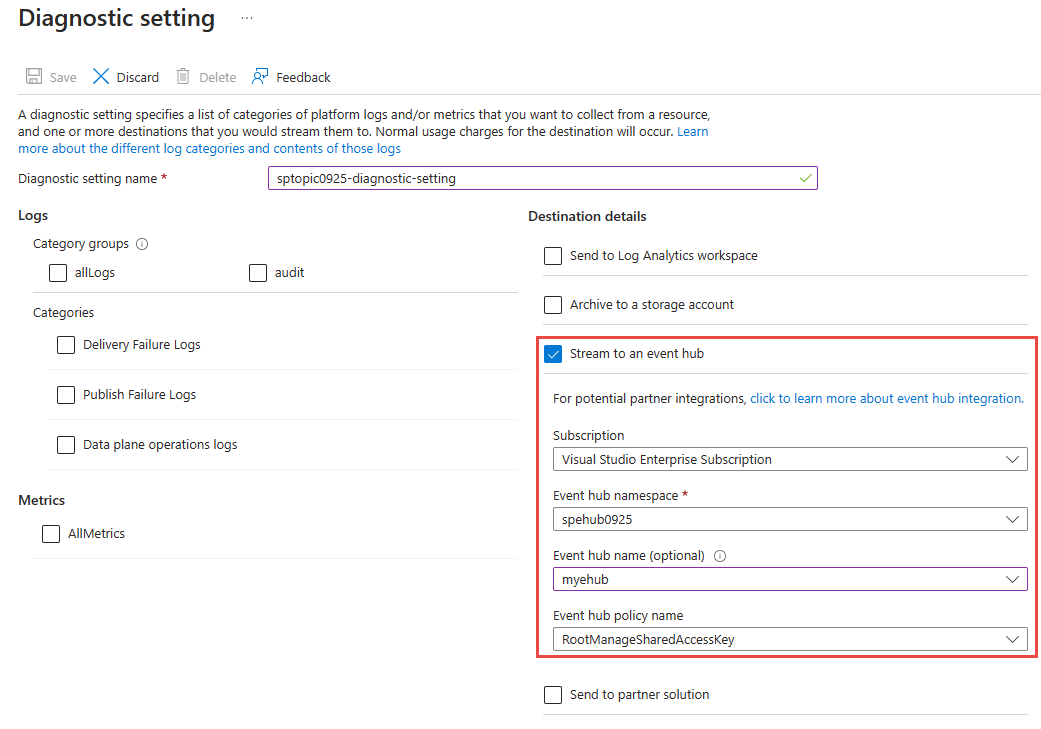
选择“保存”。 然后,选择右上角的 X 以关闭页面。
现在,返回“诊断设置”页面,确认在“诊断设置”表中看到了一个新条目。
你还可以为主题启用所有指标的收集。
为事件网格系统主题启用诊断日志
- 登录到 Azure 门户。
- 导航到要为其启用诊断日志设置的系统主题。
- 在顶部搜索栏中,搜索“事件网格系统主题”。
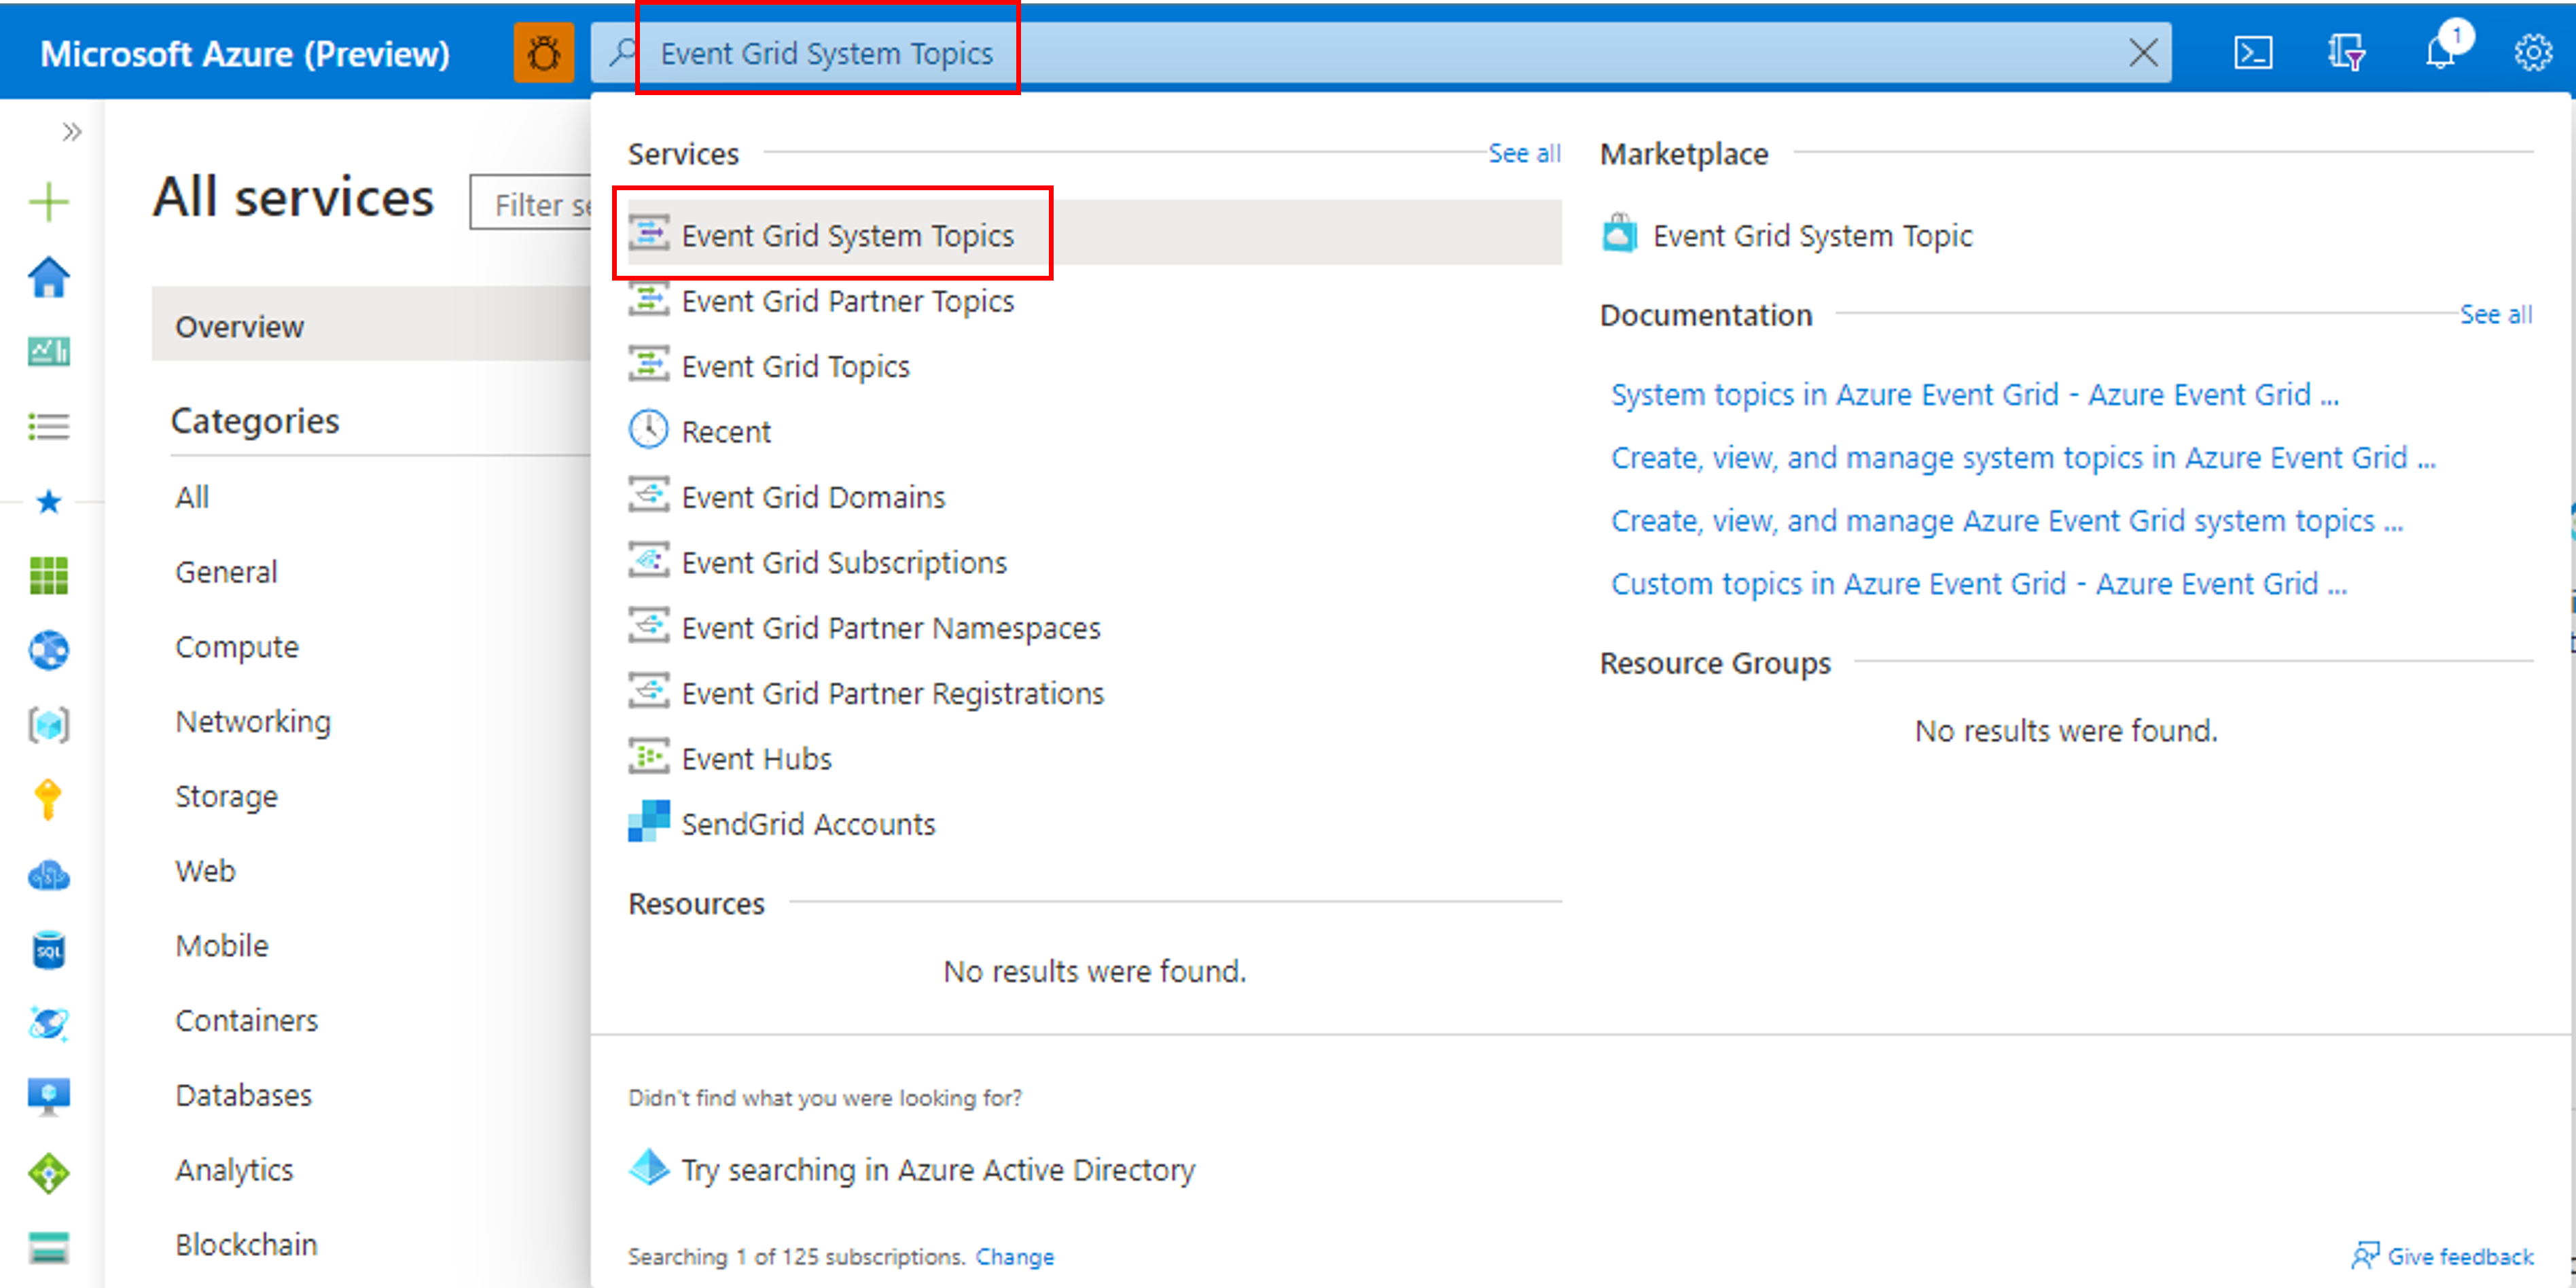
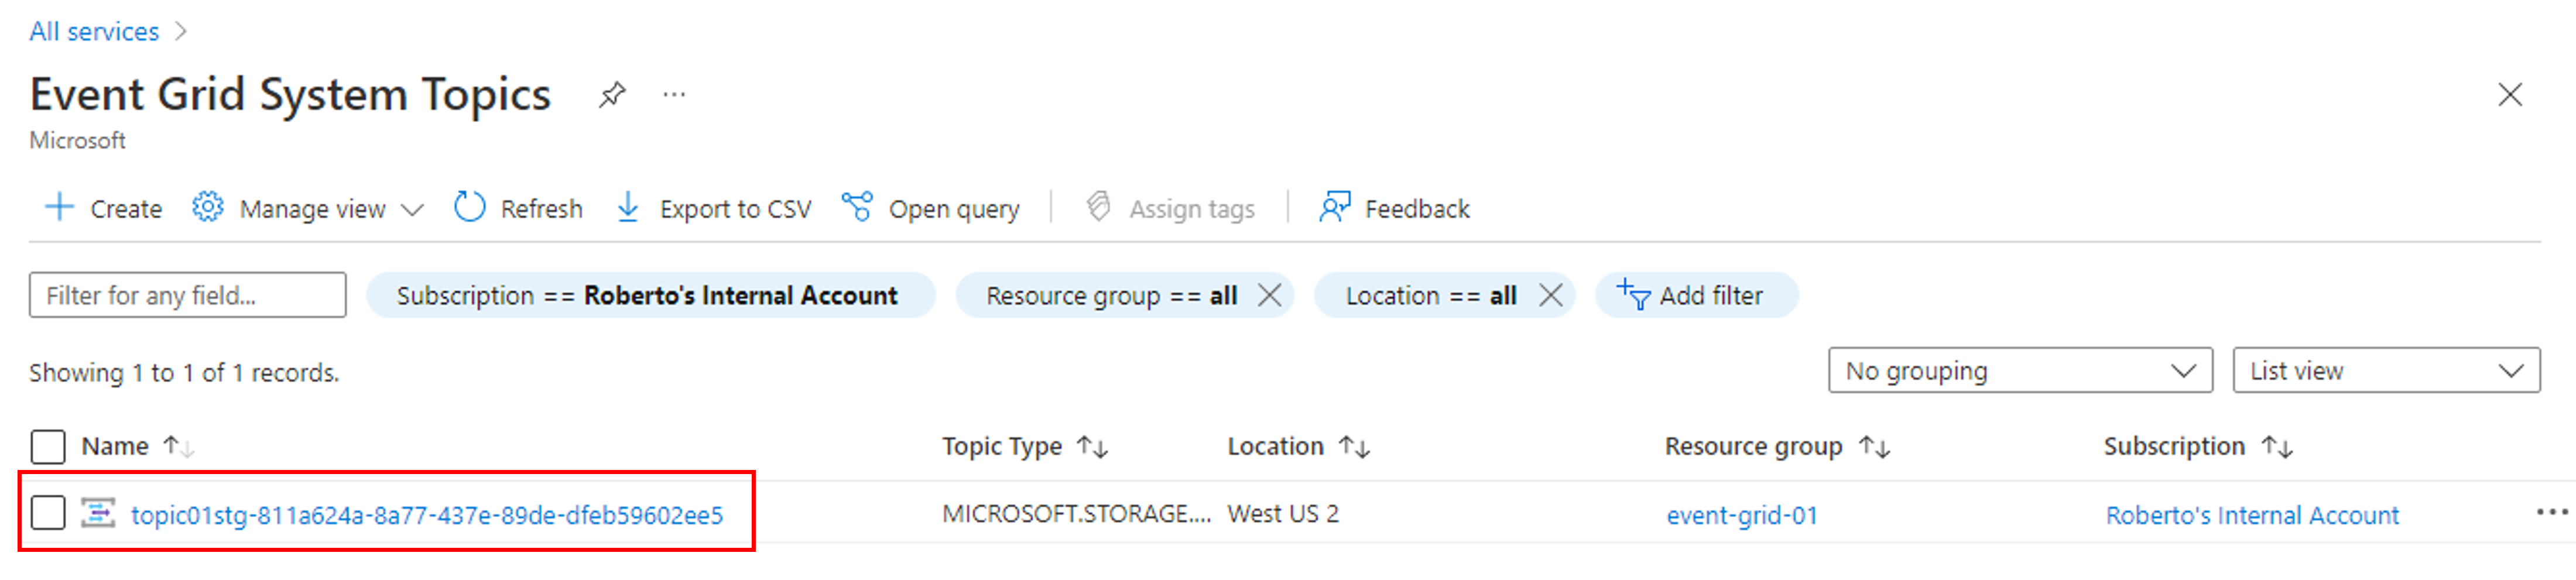
- 选择要为其配置诊断设置的系统主题。
- 在顶部搜索栏中,搜索“事件网格系统主题”。
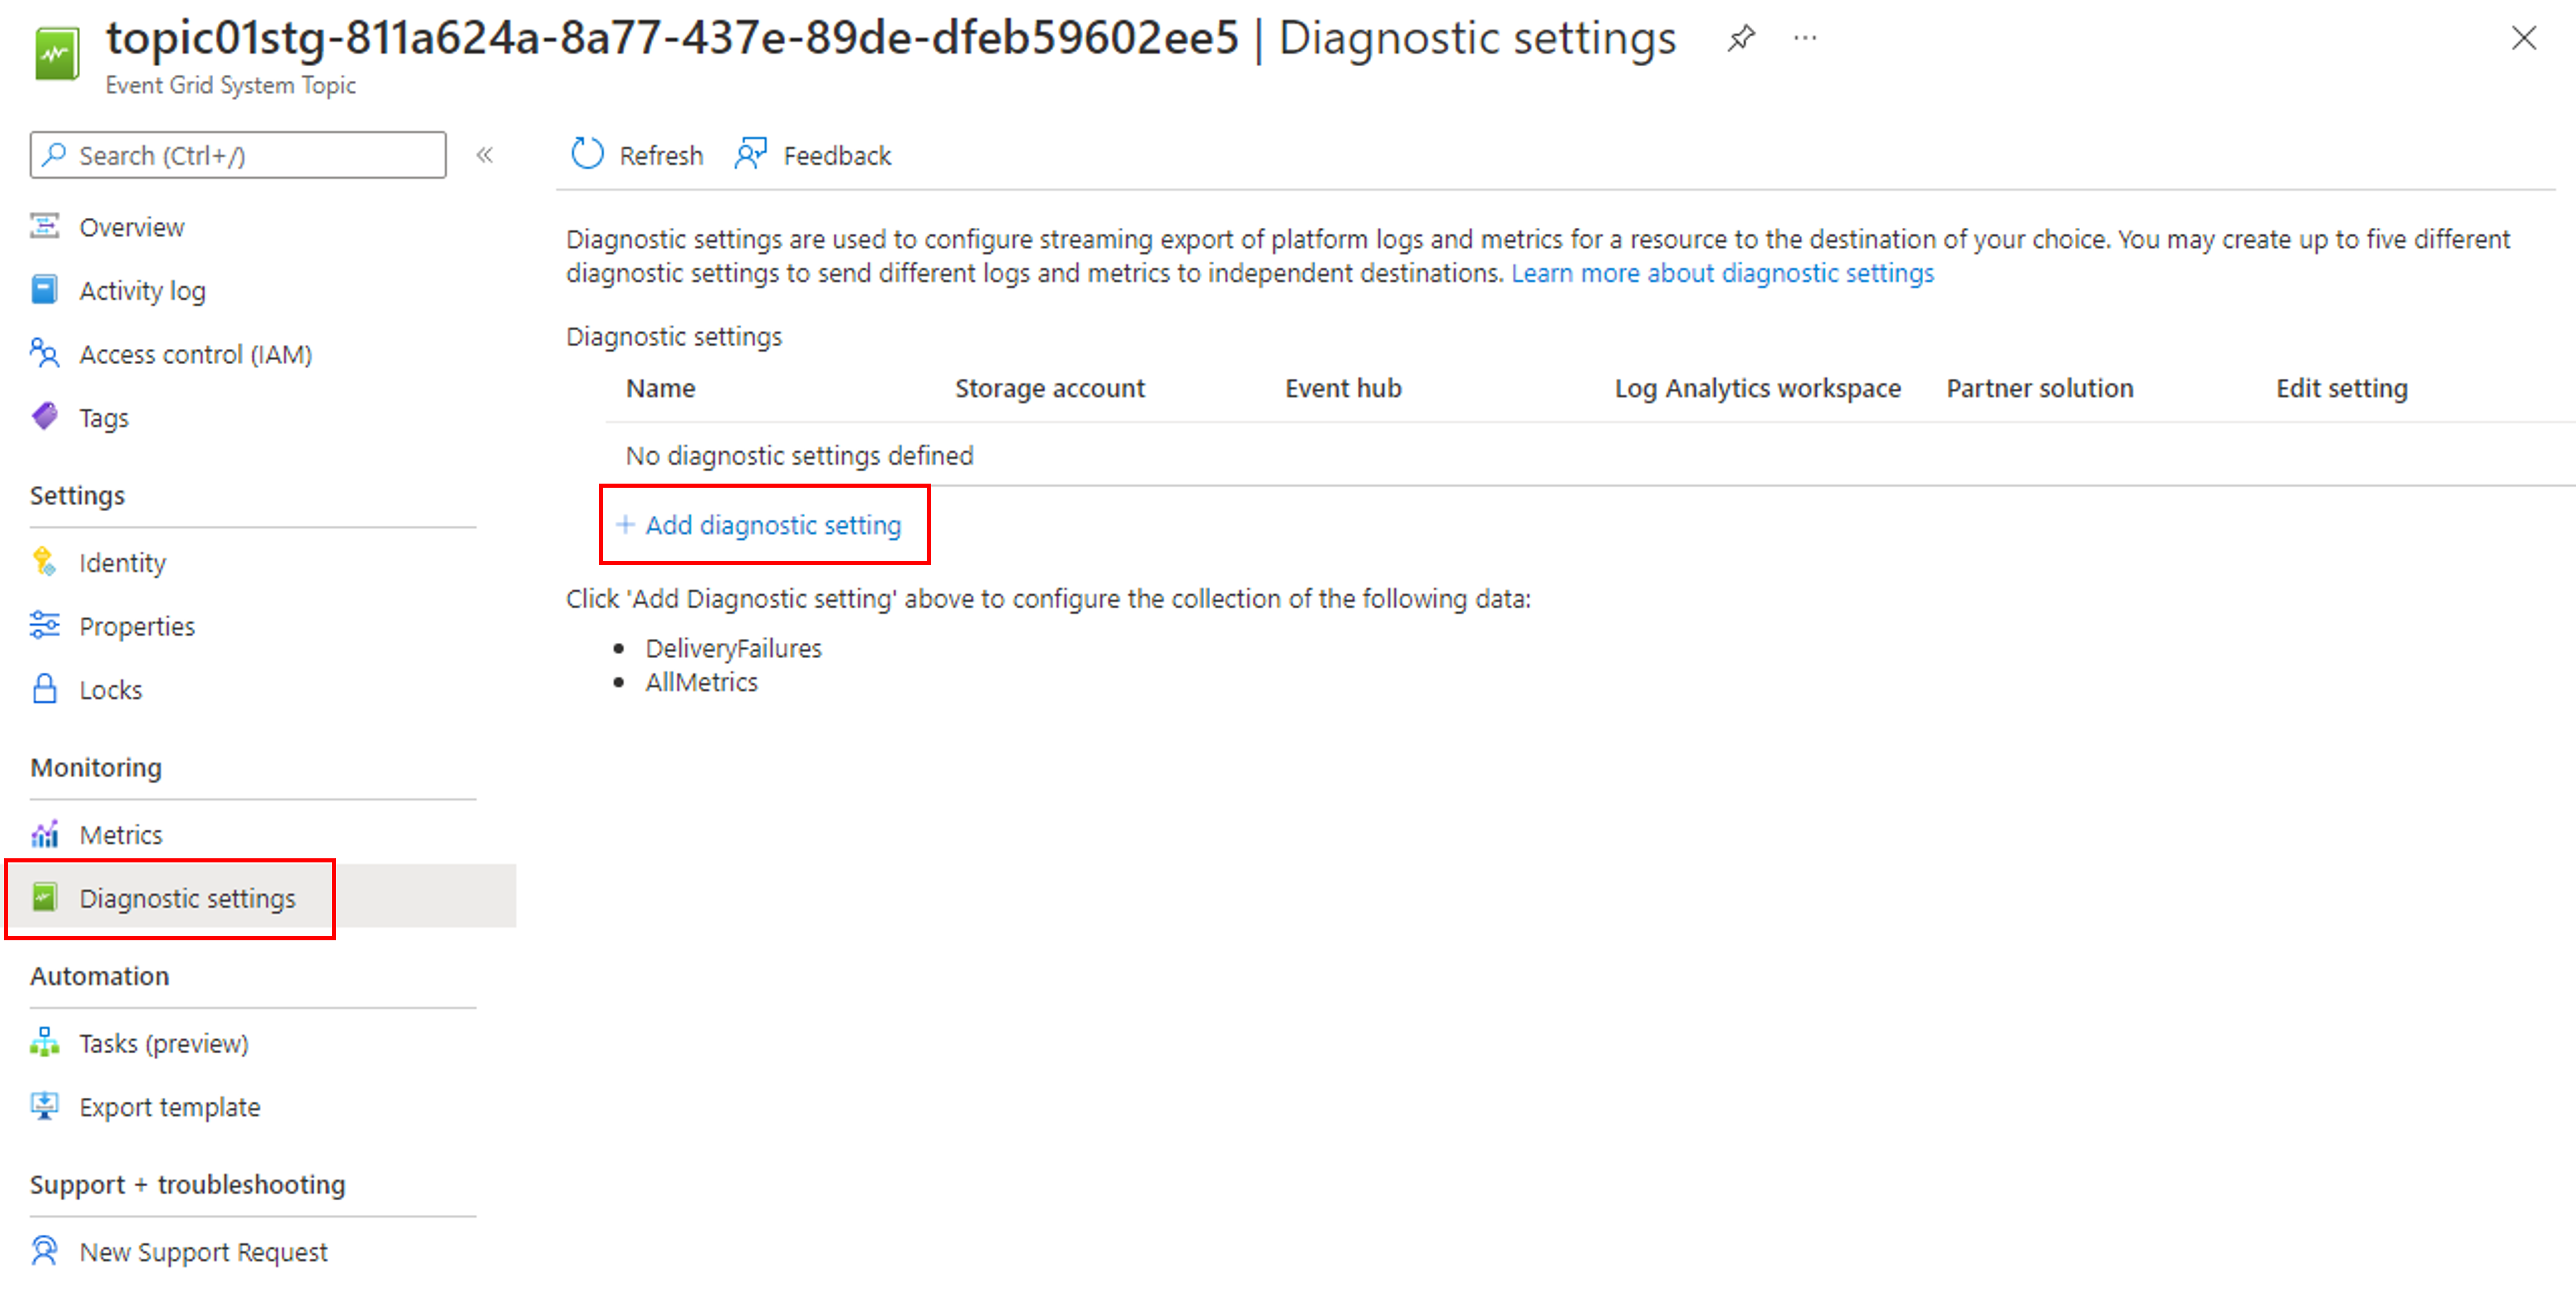
- 在左侧菜单中的“监视”下选择“诊断设置”,然后选择“添加诊断设置”。
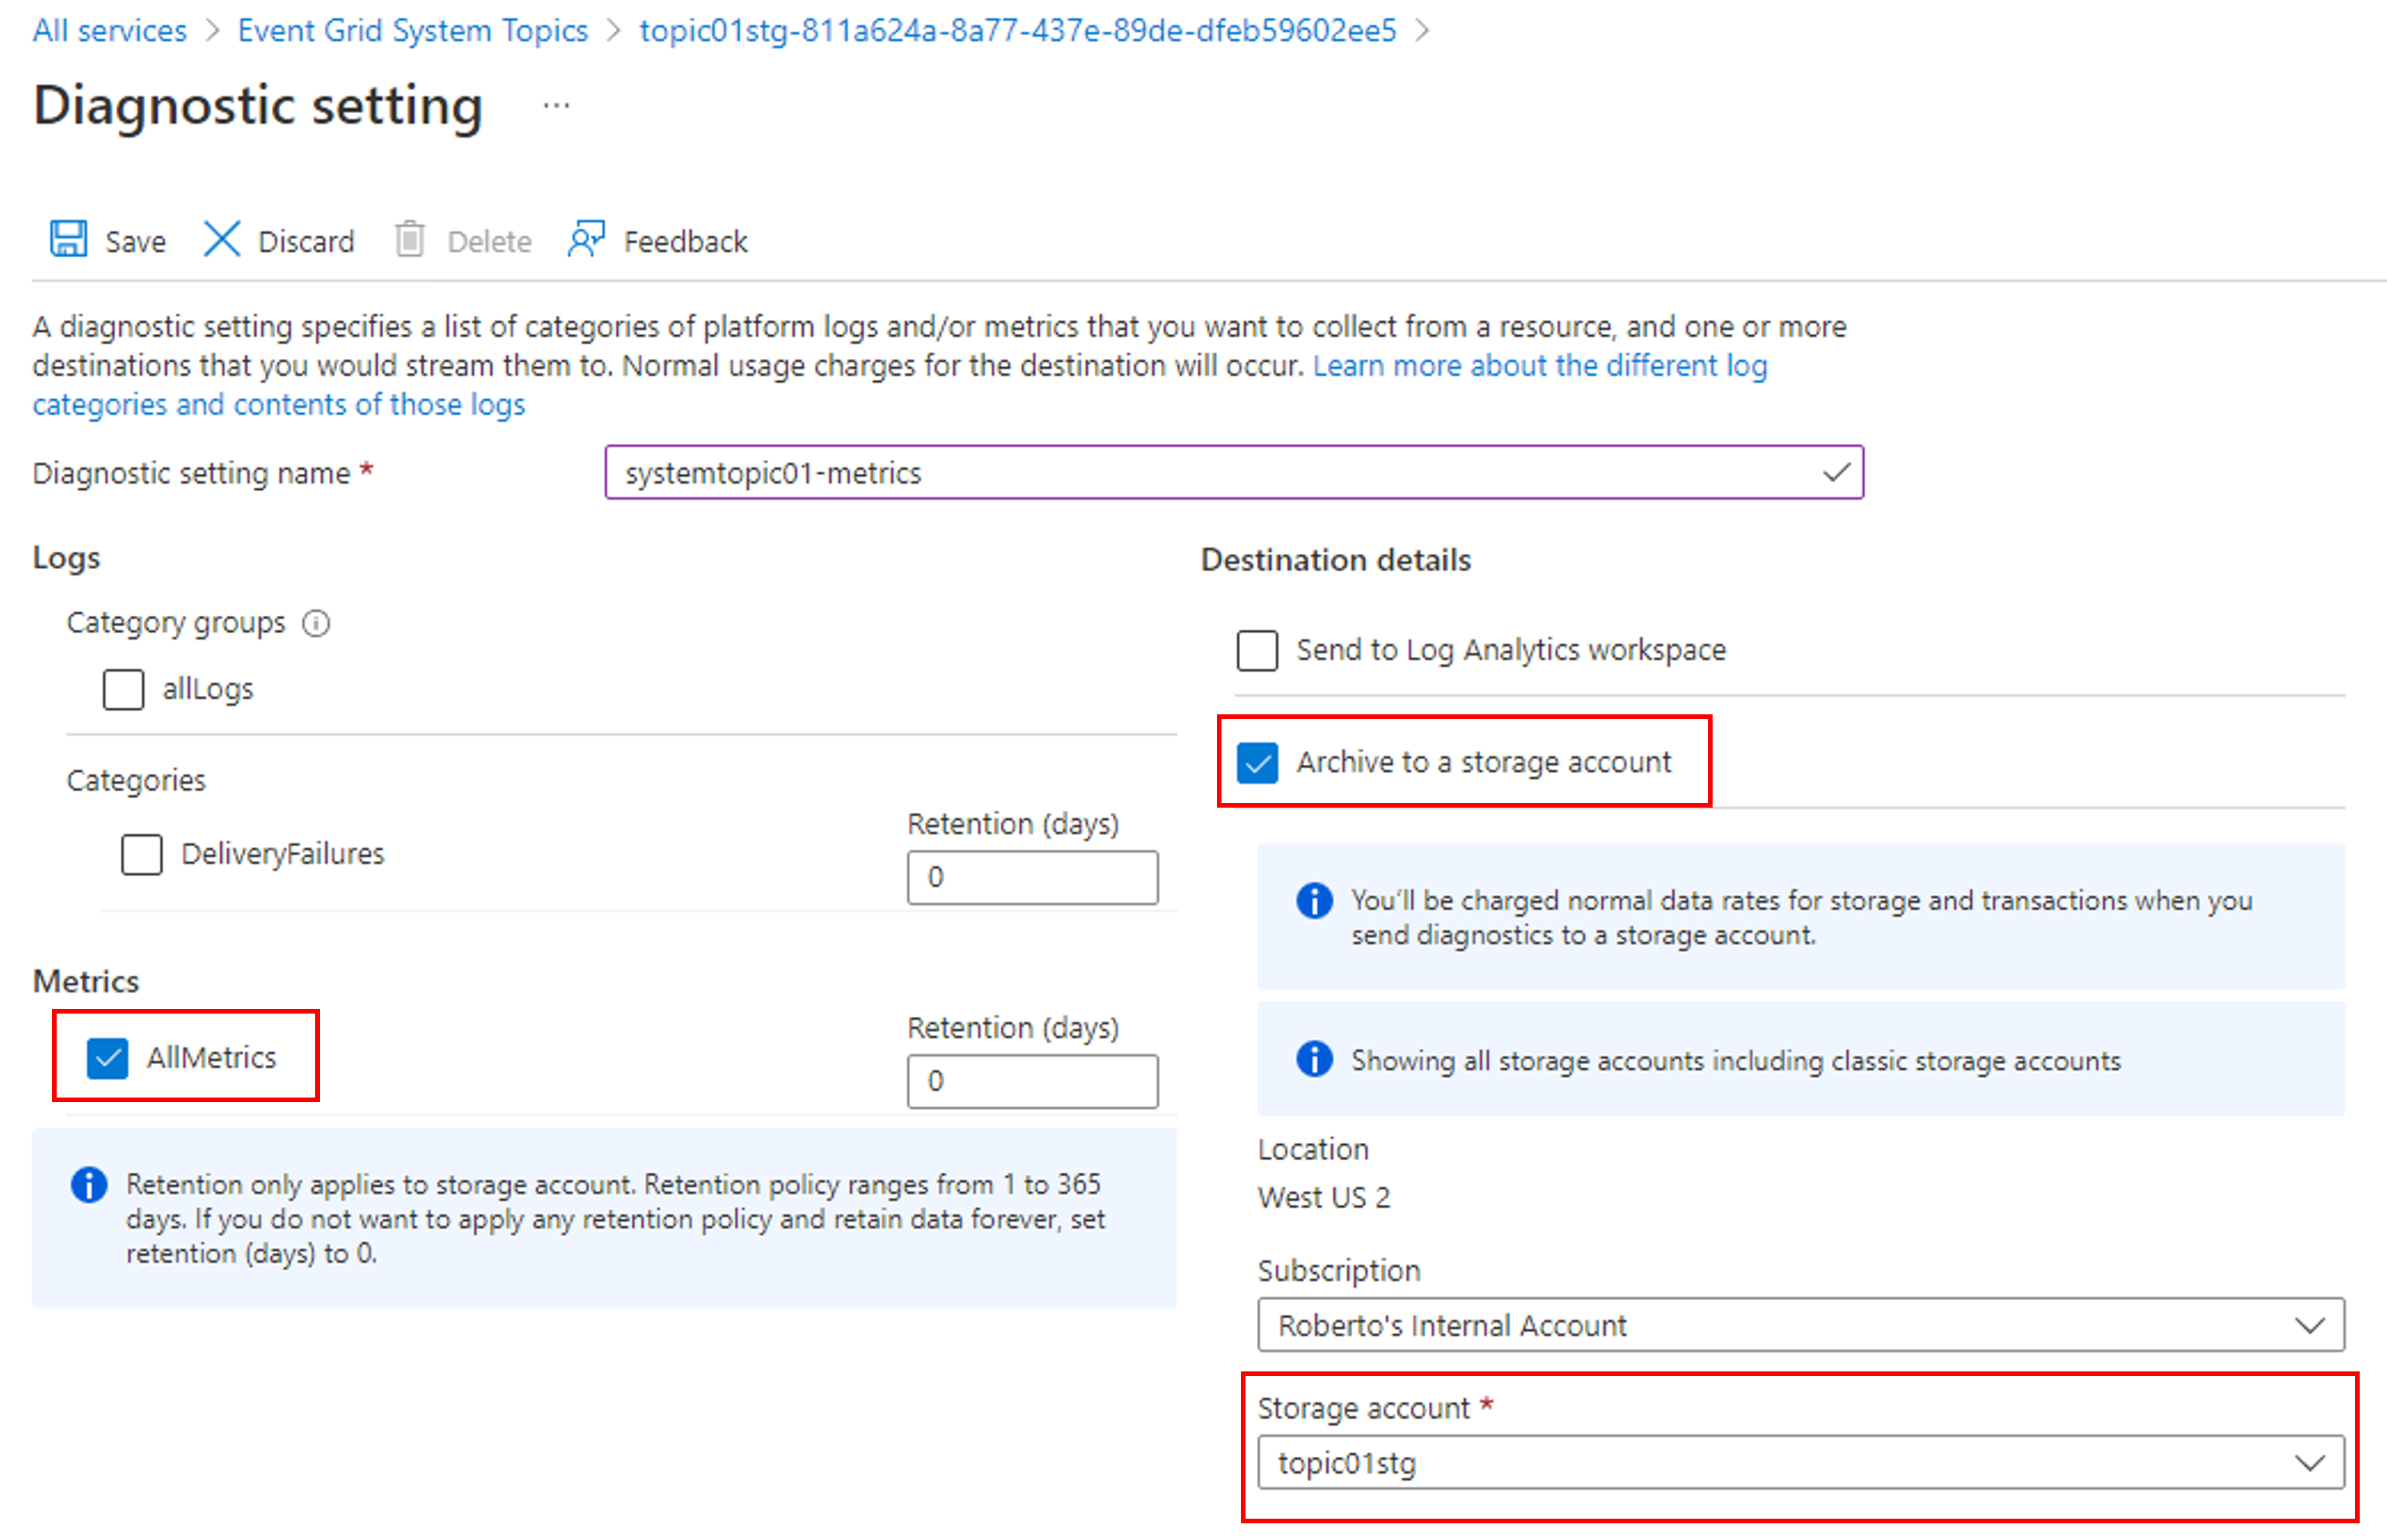
- 为诊断设置指定一个名称。
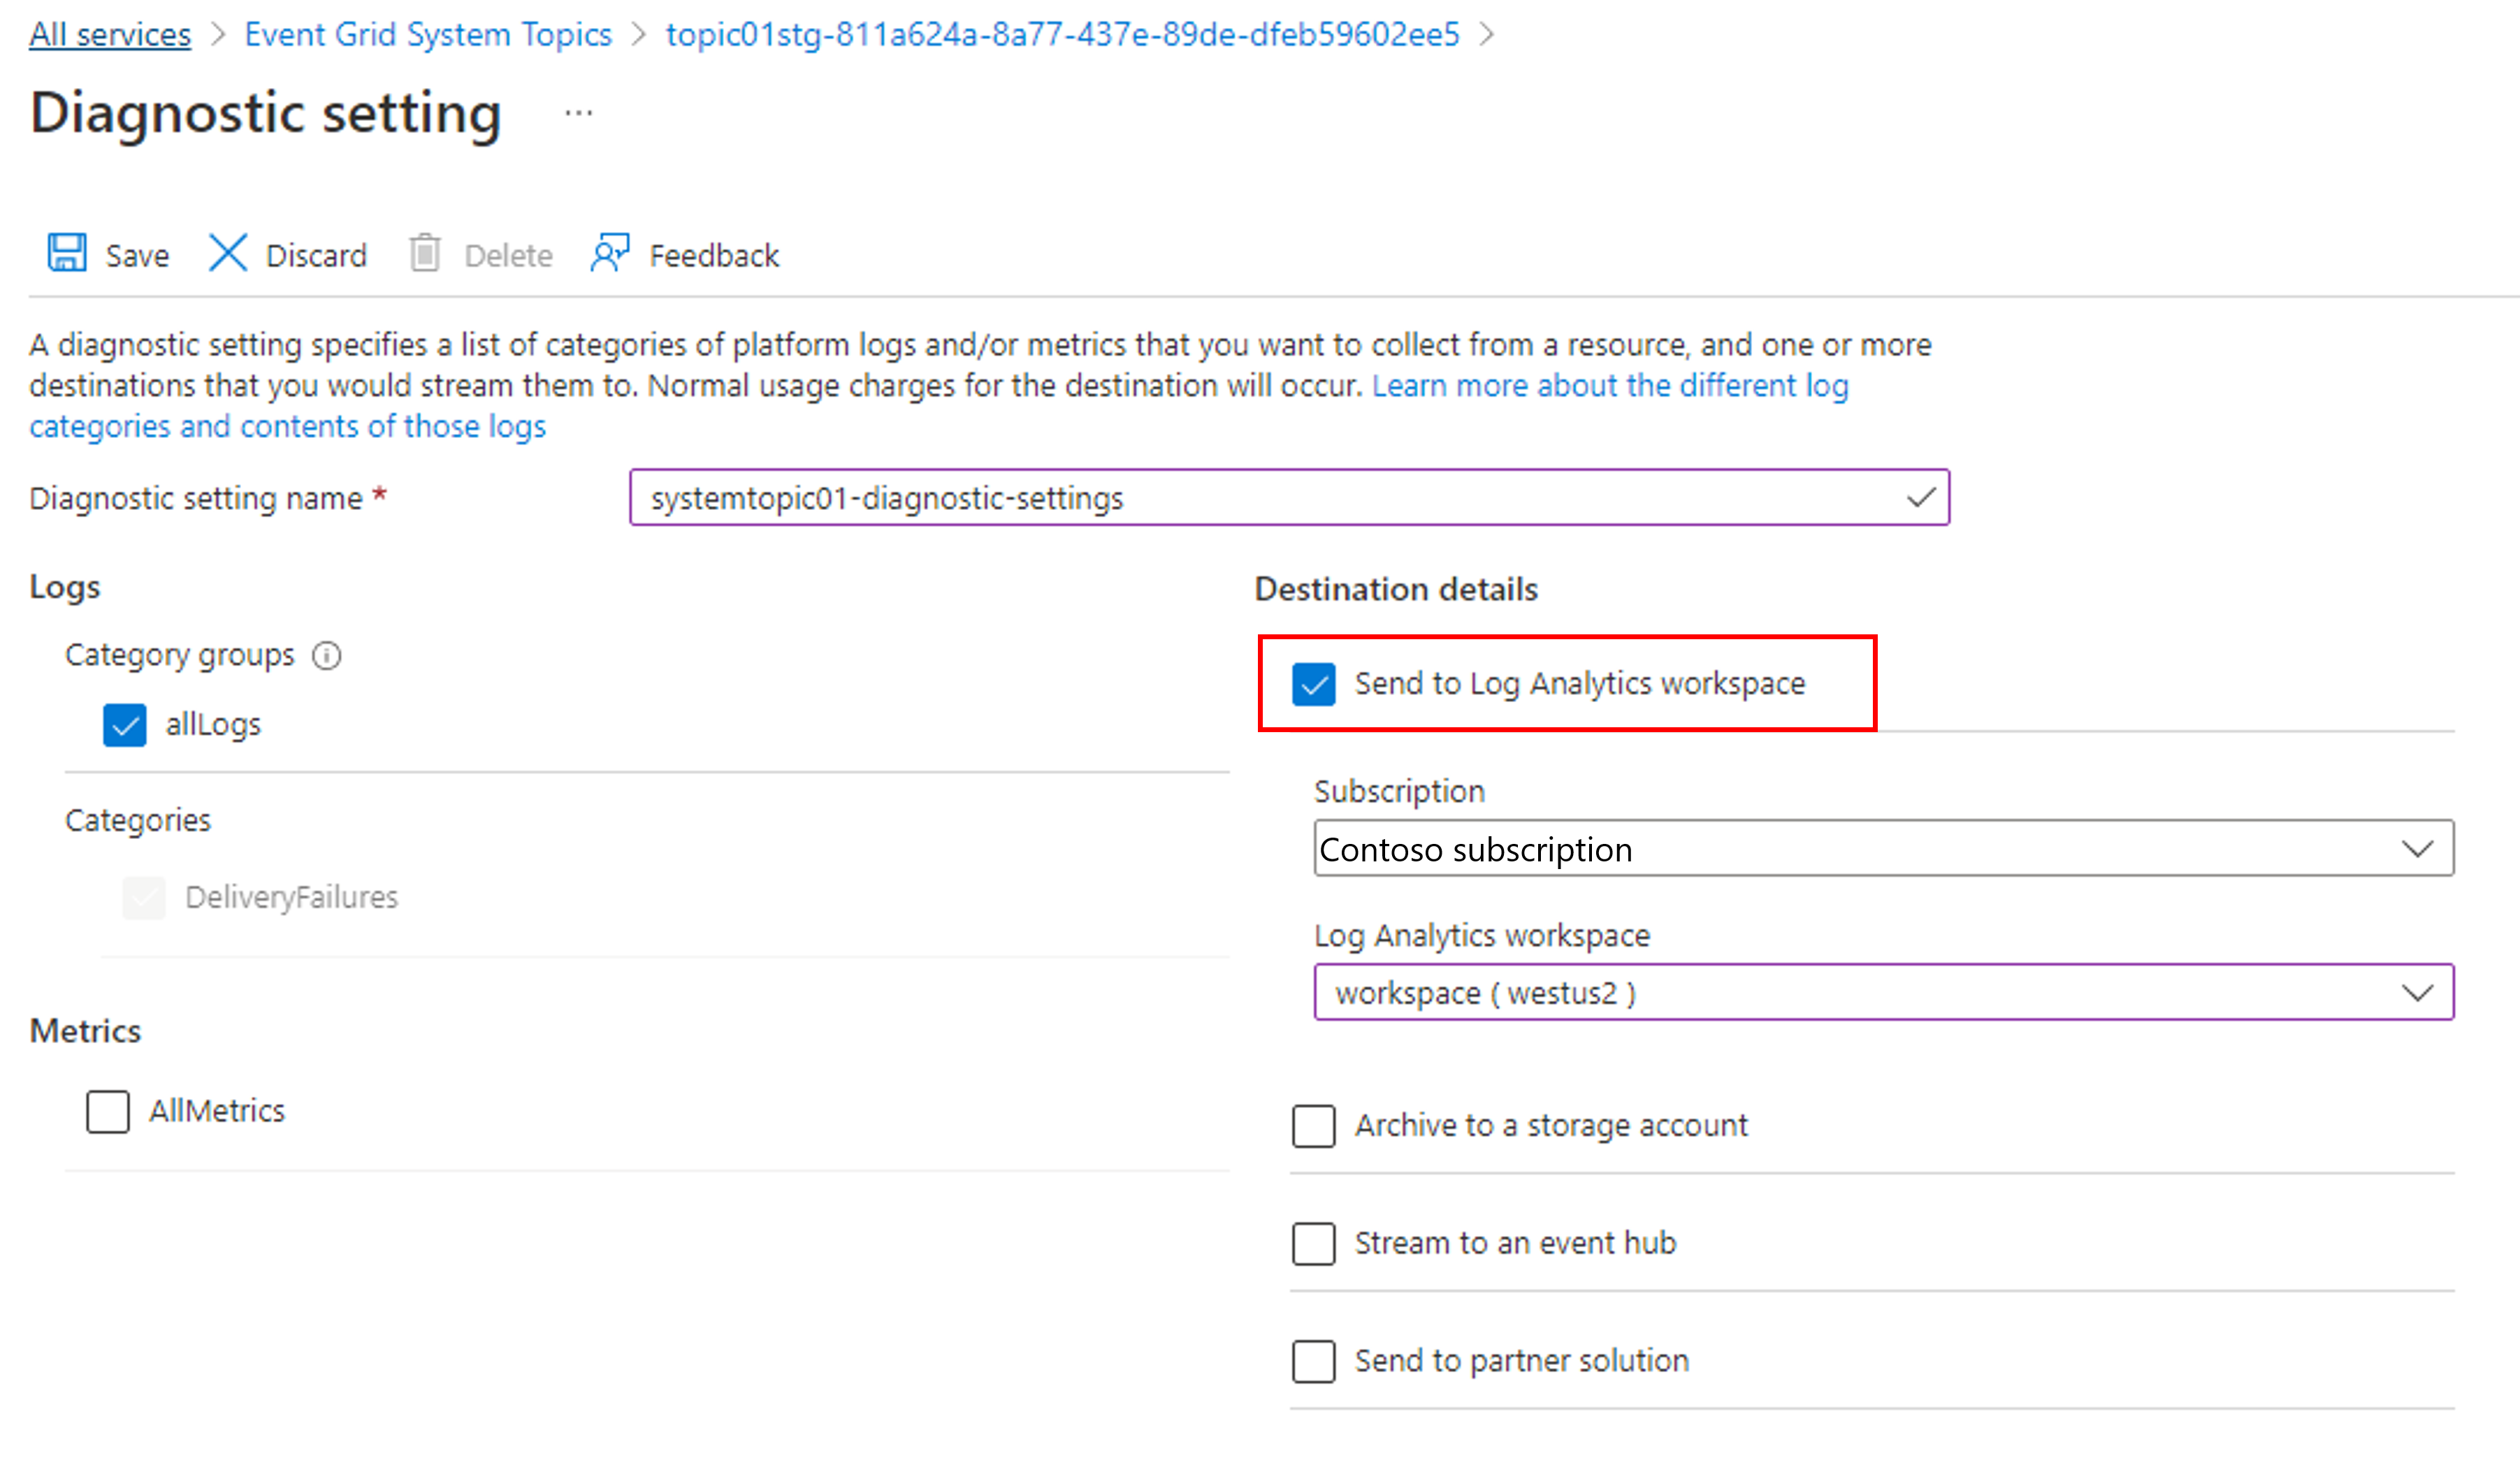
- 在“日志”部分选择“allLogs”选项 。

- 为日志启用一个或多个捕获目标,然后通过选择以前创建的捕获资源对其进行配置。
- 如果选择“发送到 Log Analytics”,请选择 Log Analytics 工作区。
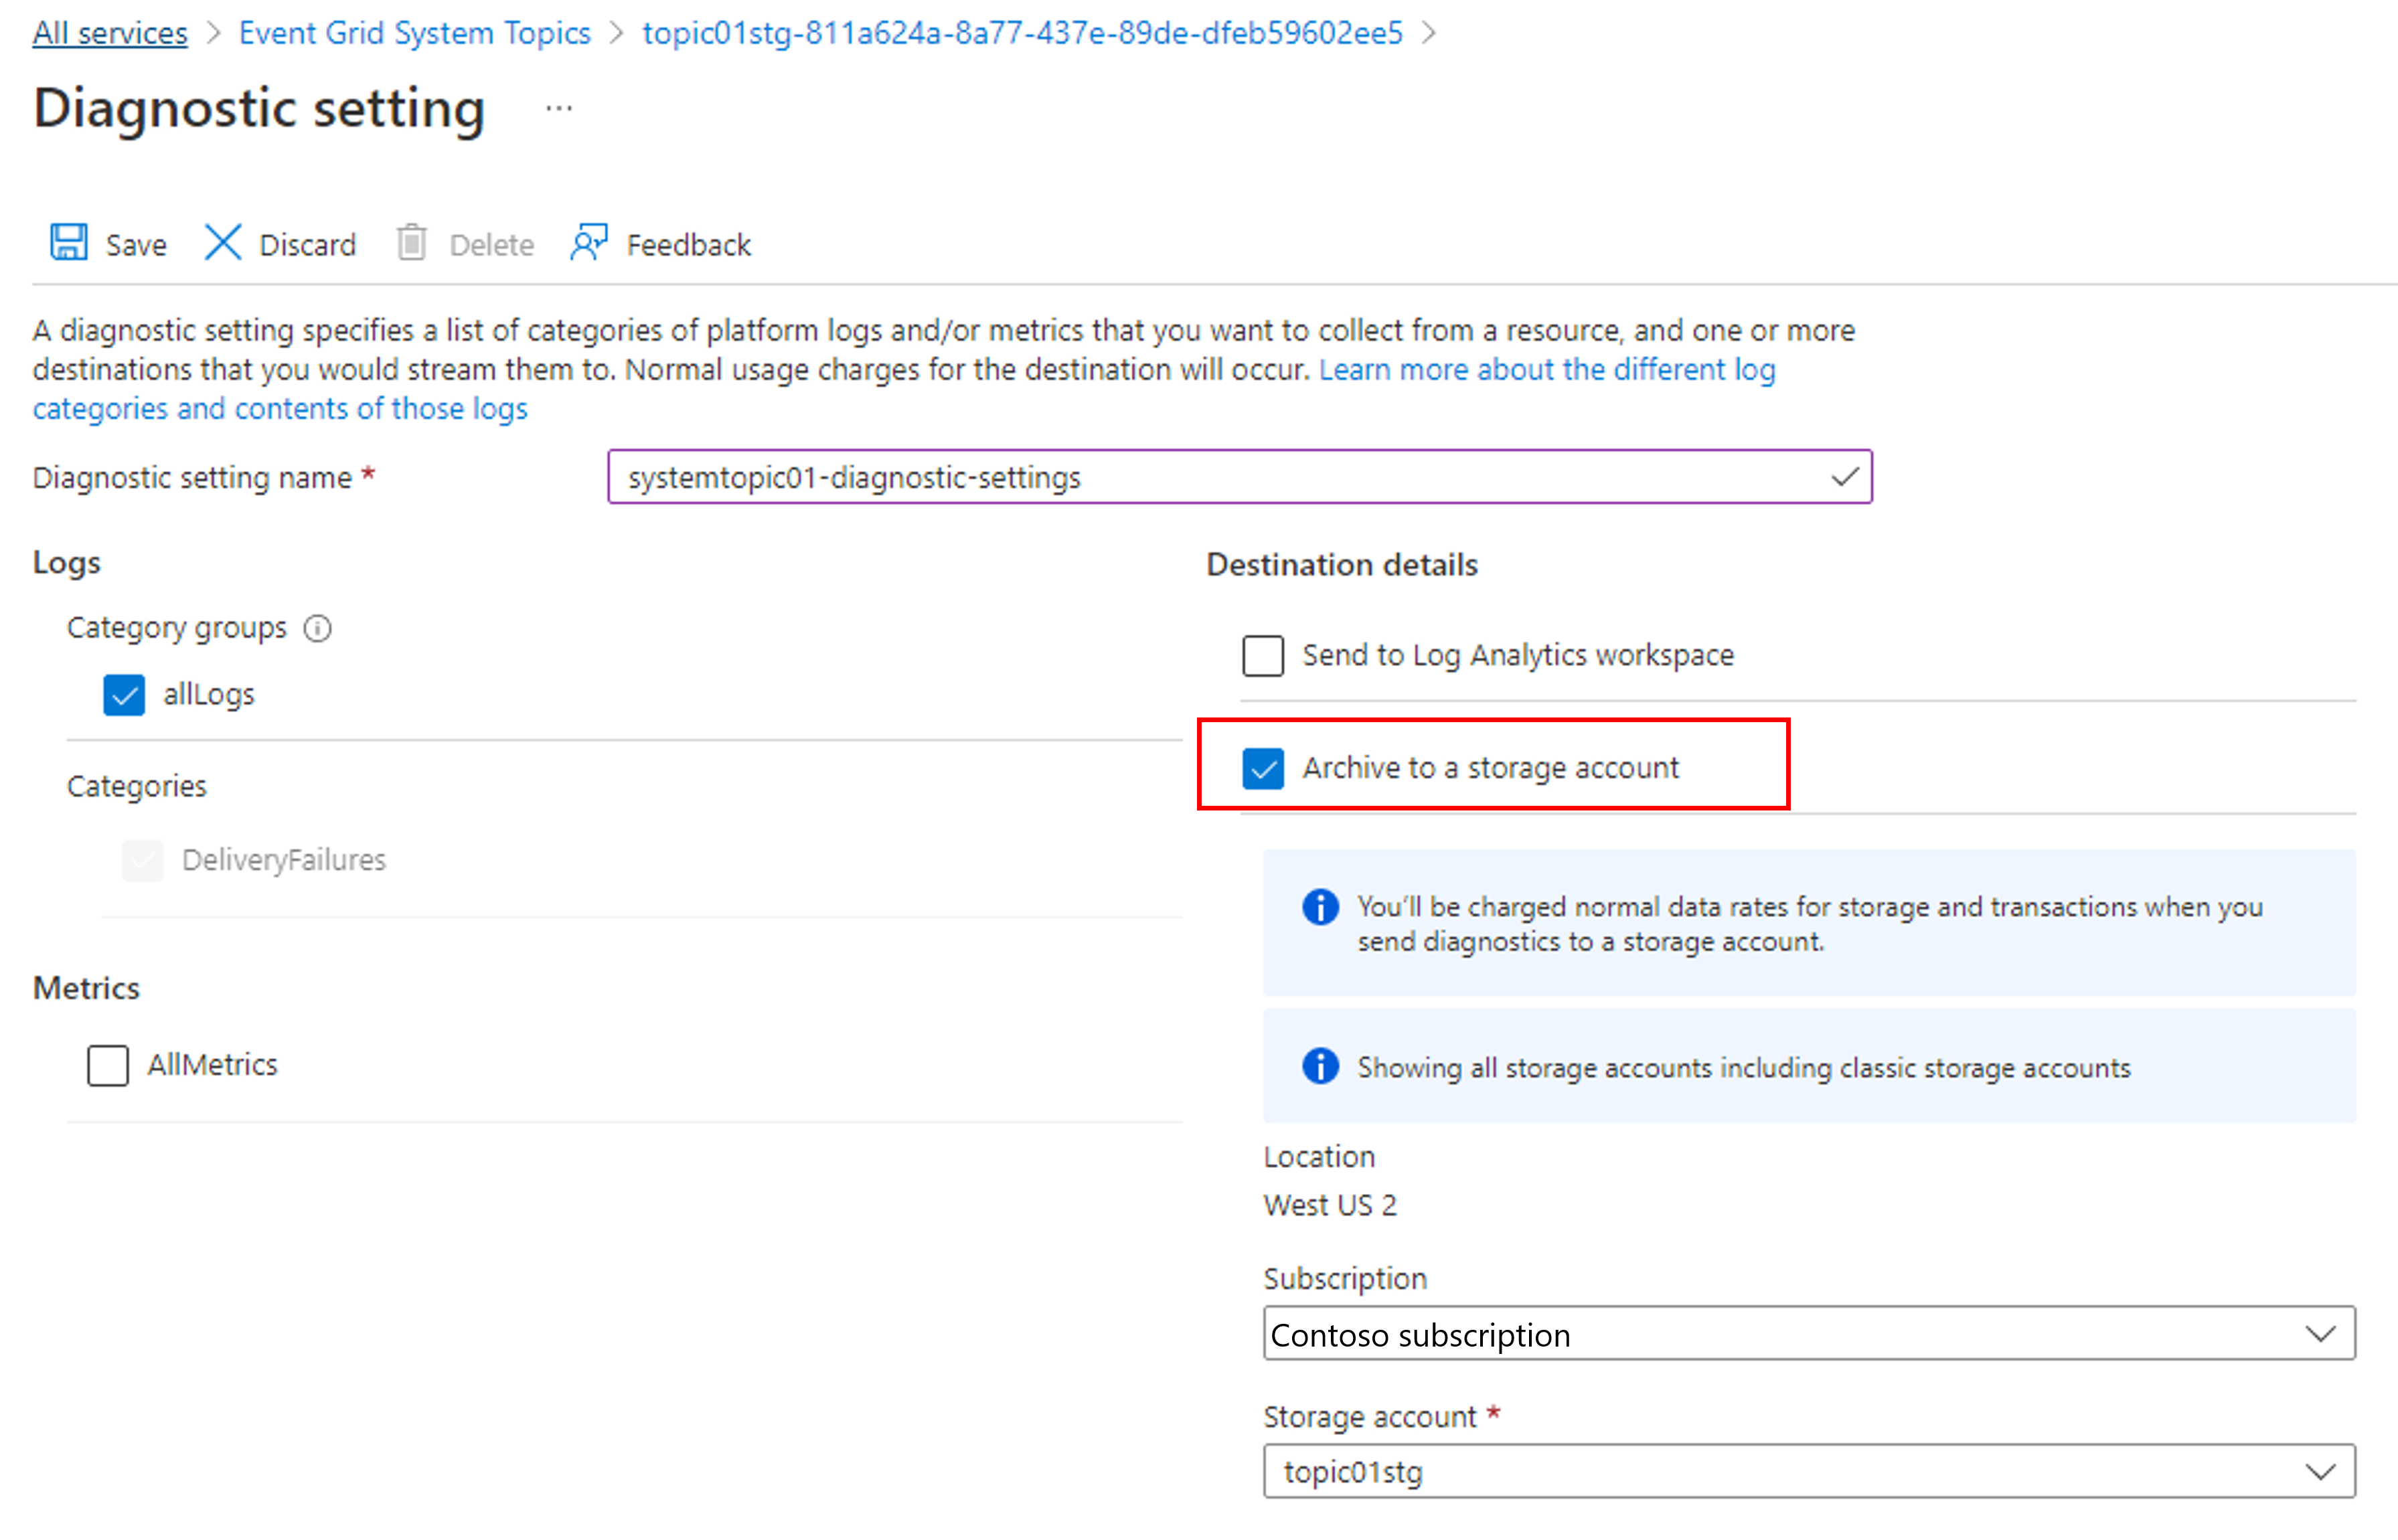
- 如果选择“存档到存储帐户”,请选择“存储帐户 - 配置”,然后选择你的 Azure 订阅中的存储帐户。
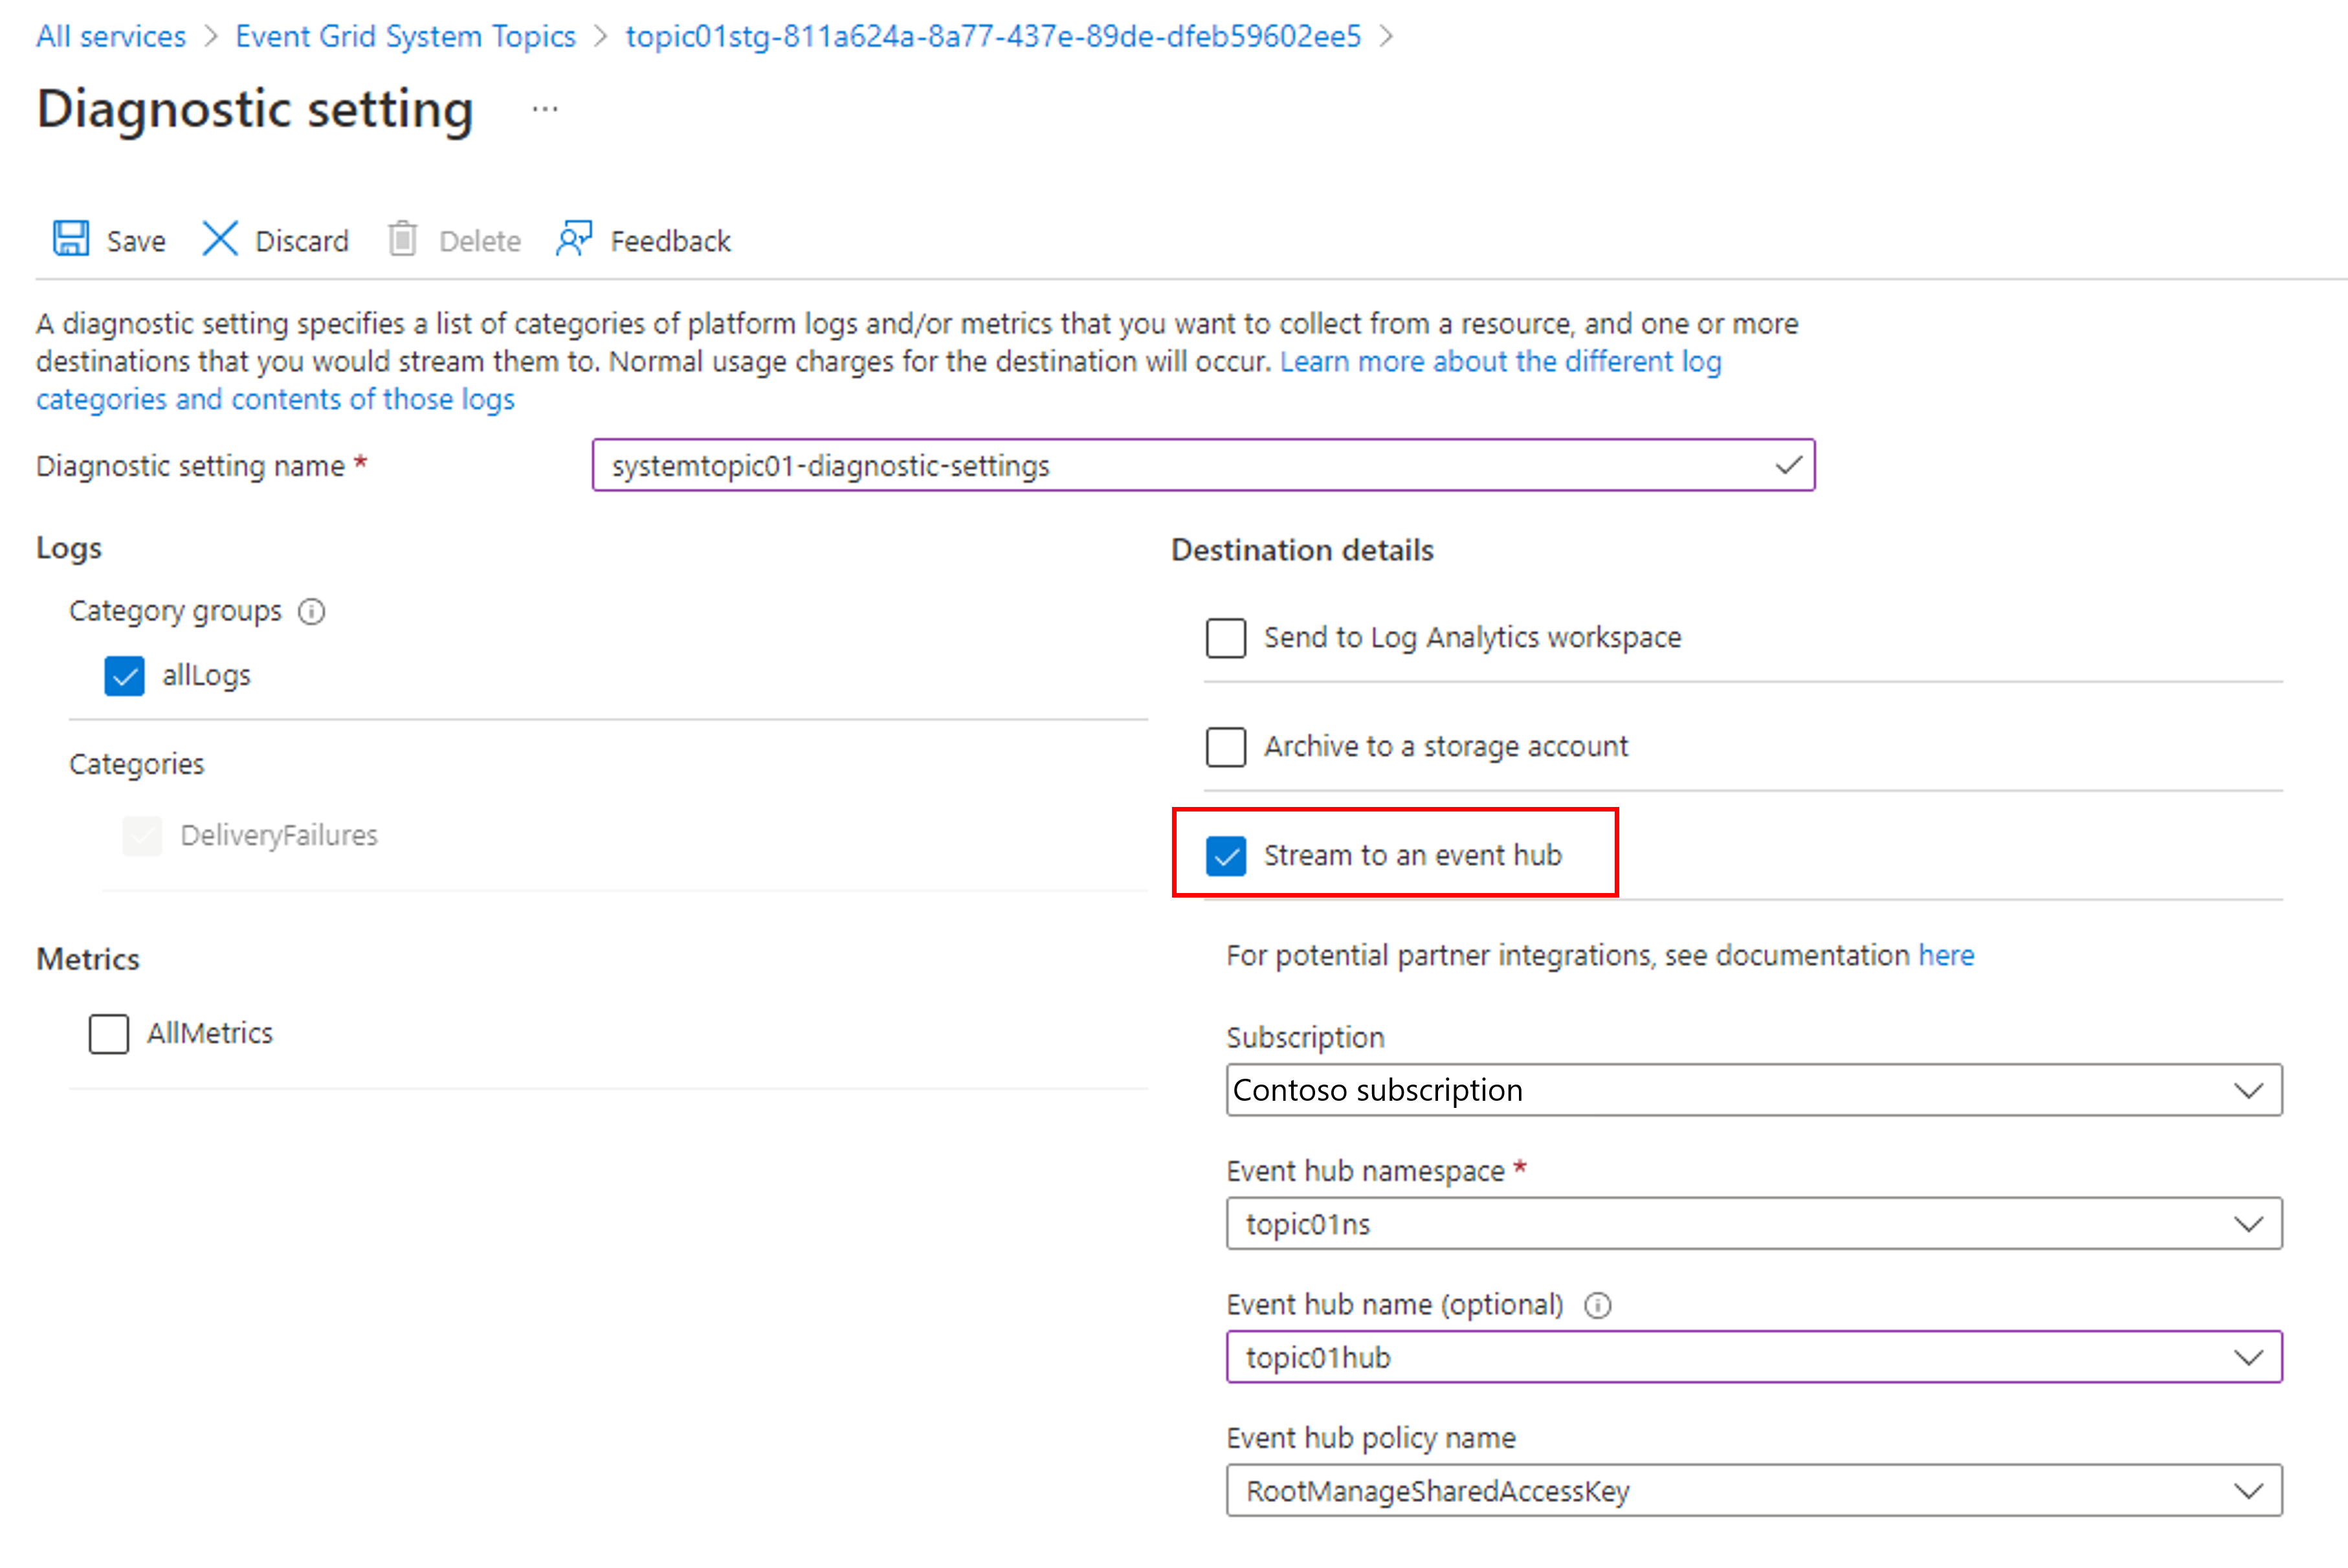
- 如果选择“流式传输到事件中心”,请选择“事件中心 - 配置”,然后选择事件中心命名空间、事件中心和访问策略 。
- 如果选择“发送到 Log Analytics”,请选择 Log Analytics 工作区。
- 选择“保存”。 然后,选择右上角的 X 以关闭页面。
- 现在,返回“诊断设置”页面,确认在“诊断设置”表中看到了一个新条目。
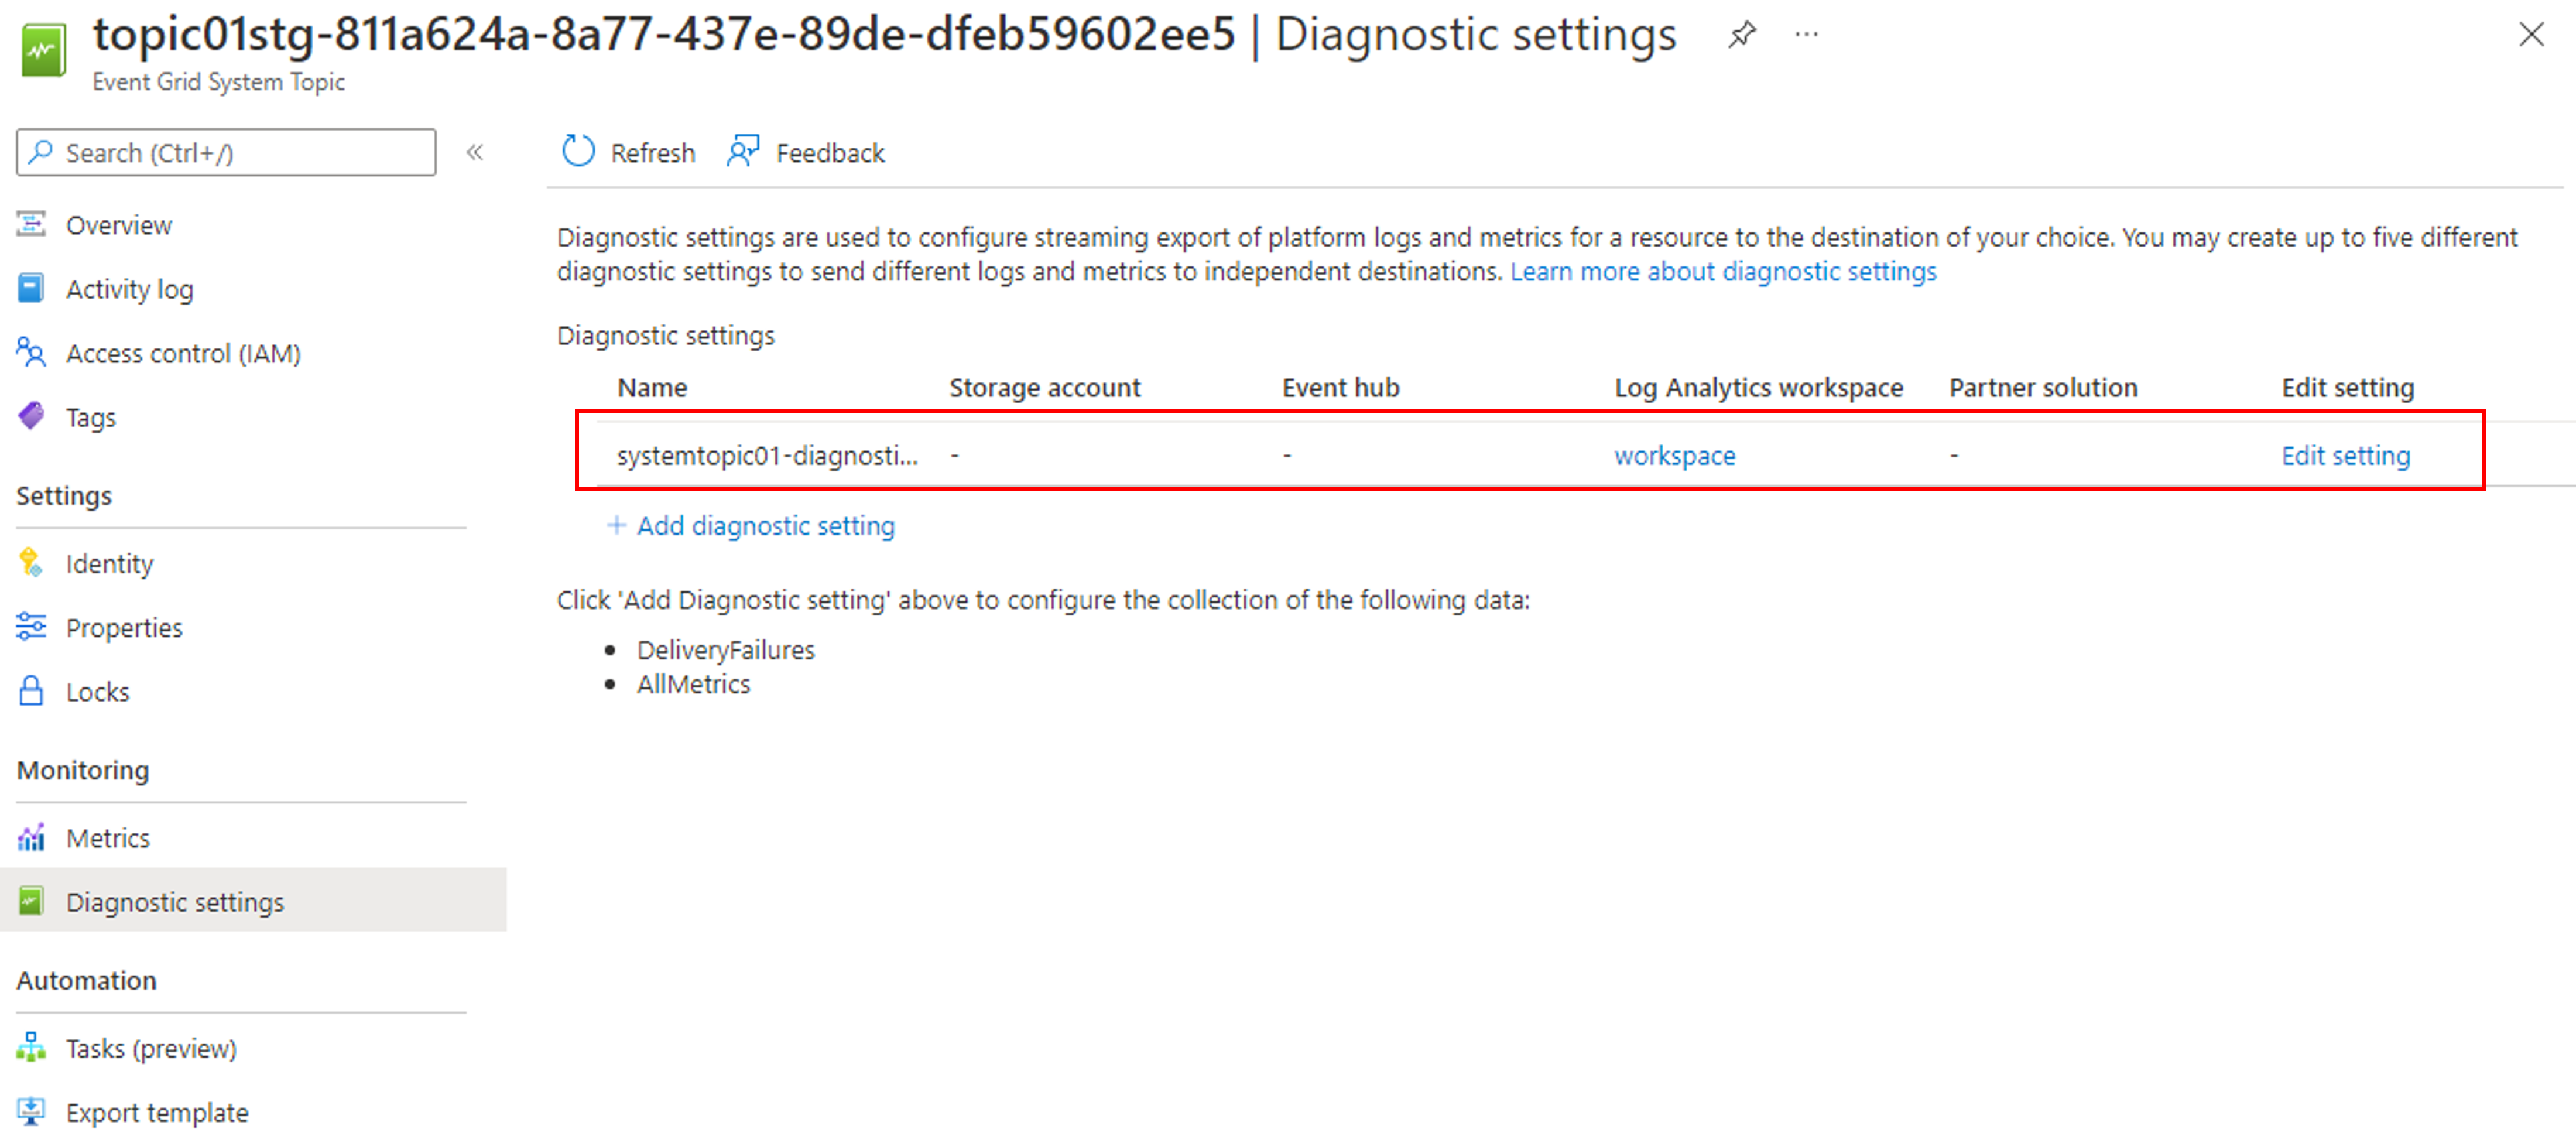
还可以为系统主题启用收集所有指标的功能。
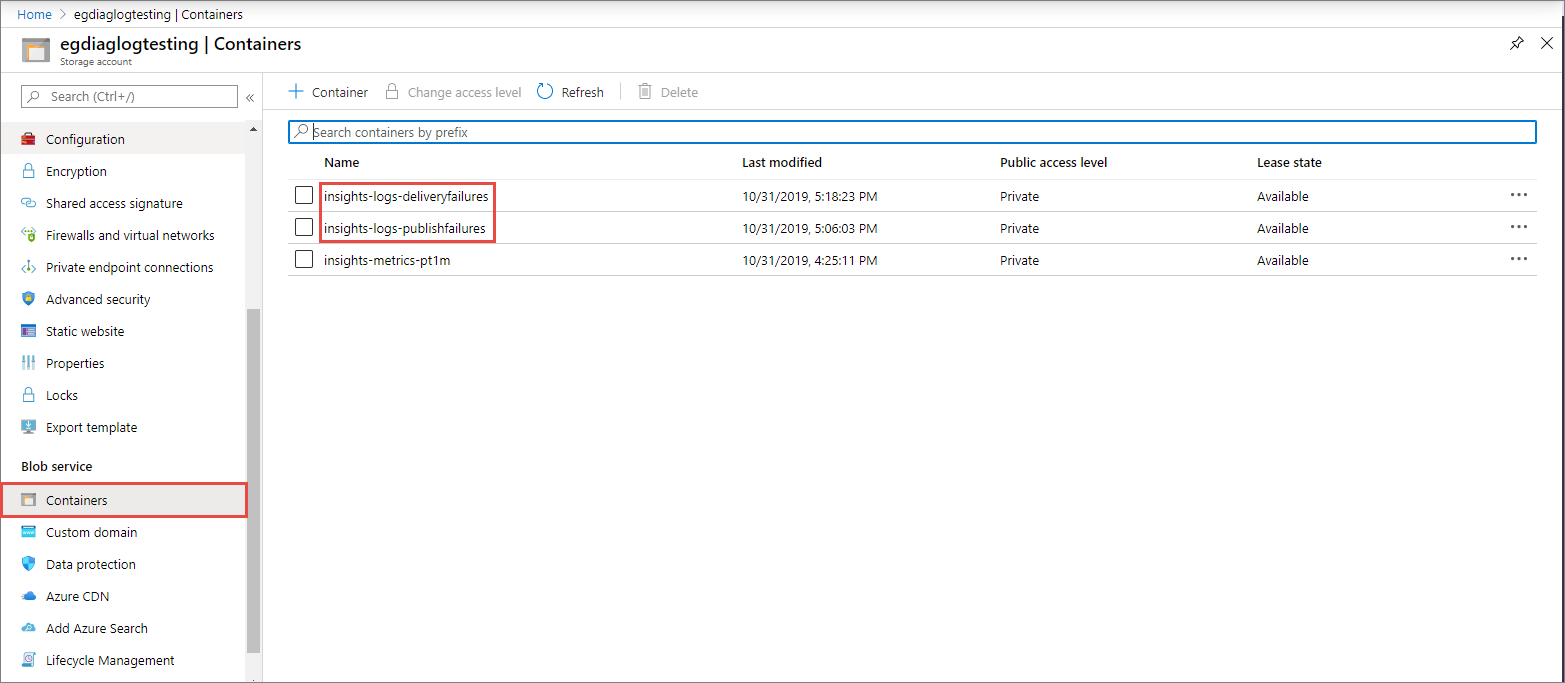
查看 Azure 存储中的诊断日志
启用存储帐户作为捕获目标后,事件网格会开始发出诊断日志。 应在存储帐户中看到名为“insights-logs-deliveryfailures”和“insights-logs-publishfailures”的新容器。
当你在其中一个容器中导航时,最终将停在一个 JSON 格式的 blob 中。 该文件包含传递失败或发布失败的日志条目。 导航路径表示事件网格主题的 ResourceId 以及有关何时发出日志条目的时间戳(分钟级别)。 该 blob/JSON 文件(可下载)在结尾处遵循下一节中所述的架构。
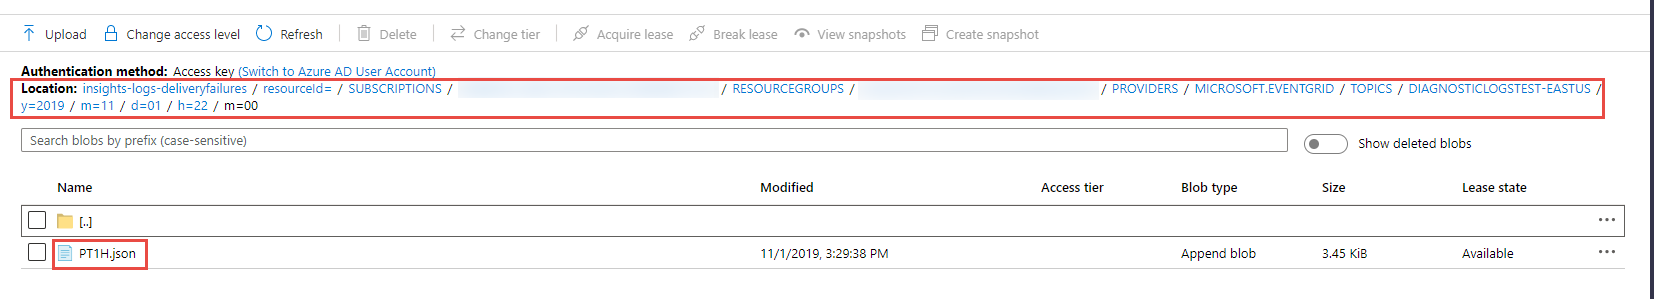
你应该在 JSON 文件中看到类似于以下示例的内容:
{
    "time": "2019-11-01T00:17:13.4389048Z",
    "resourceId": "/SUBSCRIPTIONS/SAMPLE-SUBSCTIPTION-ID /RESOURCEGROUPS/SAMPLE-RESOURCEGROUP-NAME/PROVIDERS/MICROSOFT.EVENTGRID/TOPICS/SAMPLE-TOPIC-NAME ",
    "eventSubscriptionName": "SAMPLEDESTINATION",
    "category": "DeliveryFailures",
    "operationName": "Deliver",
    "message": "Message:outcome=NotFound, latencyInMs=2635, id=xxxxxxxx-xxxx-xxxx-xxxx-xxxxxxxxxxxxx, systemId=xxxxxxx-xxxx-xxxx-xxxx-xxxxxxxxxxxx, state=FilteredFailingDelivery, deliveryTime=11/1/2019 12:17:10 AM, deliveryCount=0, probationCount=0, deliverySchema=EventGridEvent, eventSubscriptionDeliverySchema=EventGridEvent, fields=InputEvent, EventSubscriptionId, DeliveryTime, State, Id, DeliverySchema, LastDeliveryAttemptTime, SystemId, fieldCount=, requestExpiration=1/1/0001 12:00:00 AM, delivered=False publishTime=11/1/2019 12:17:10 AM, eventTime=11/1/2019 12:17:09 AM, eventType=Type, deliveryTime=11/1/2019 12:17:10 AM, filteringState=FilteredWithRpc, inputSchema=EventGridEvent, publisher=DIAGNOSTICLOGSTEST-EASTUS.EASTUS-1.EVENTGRID.AZURE.NET, size=363, fields=Id, PublishTime, SerializedBody, EventType, Topic, Subject, FilteringHashCode, SystemId, Publisher, FilteringTopic, TopicCategory, DataVersion, MetadataVersion, InputSchema, EventTime, fieldCount=15, url=sb://diagnosticlogstesting-eastus.servicebus.windows.net/, deliveryResponse=NotFound: The messaging entity 'sb://diagnosticlogstesting-eastus.servicebus.windows.net/eh-diagnosticlogstest' could not be found. TrackingId:c98c5af6-11f0-400b-8f56-c605662fb849_G14, SystemTracker:diagnosticlogstesting-eastus.servicebus.windows.net:eh-diagnosticlogstest, Timestamp:2019-11-01T00:17:13, referenceId: ac141738a9a54451b12b4cc31a10dedc_G14:"
}
使用 Azure Resource Manager 模板
下面是一个示例 Azure 资源管理器模板,用于为事件网格主题启用诊断设置。 部署此示例模板时,将创建以下资源。
- 事件网格主题
- Log Analytics 工作区
然后,它会针对该主题创建诊断设置,以将诊断信息发送到 Log Analytics 工作区。
{
    "$schema": "https://schema.management.azure.com/schemas/2019-04-01/deploymentTemplate.json#",
    "contentVersion": "1.0.0.0",
    "parameters": {
        "topic_name": {
            "defaultValue": "spegrid0917topic",
            "type": "String"
        },
        "log_analytics_workspace_name": {
            "defaultValue": "splogaw0625",
            "type": "String"
        },
        "location": {
            "defaultValue": "eastus",
            "type": "String"
        },
        "sku": {
            "defaultValue": "Free",
            "type": "String"
        }
    },
    "variables": {},
    "resources": [
        {
            "type": "Microsoft.EventGrid/topics",
            "apiVersion": "2020-10-15-preview",
            "name": "[parameters('topic_name')]",
            "location": "[parameters('location')]",
            "sku": {
                "name": "Basic"
            },
            "kind": "Azure",
            "identity": {
                "type": "None"
            },
            "properties": {
                "inputSchema": "EventGridSchema",
                "publicNetworkAccess": "Enabled"
            }
        },
        {
            "apiVersion": "2017-03-15-preview",
            "name": "[parameters('log_analytics_workspace_name')]",
            "location": "[parameters('location')]",
            "type": "Microsoft.OperationalInsights/workspaces",
            "properties": {
                "sku": {
                    "name": "[parameters('sku')]"
                }
            }
        },
        {
            "type": "Microsoft.EventGrid/topics/providers/diagnosticSettings",
            "apiVersion": "2017-05-01-preview",
            "name": "[concat(parameters('topic_name'), '/', 'Microsoft.Insights/', parameters('log_analytics_workspace_name'))]",
            "location": "[parameters('location')]",
            "dependsOn": [
                "[resourceId('Microsoft.EventGrid/topics', parameters('topic_name'))]",
                "[resourceId('Microsoft.OperationalInsights/workspaces', parameters('log_analytics_workspace_name'))]"
            ],
            "properties": {
                "workspaceId": "[resourceId('Microsoft.OperationalInsights/workspaces', parameters('log_analytics_workspace_name'))]",
                "metrics": [
                    {
                        "category": "AllMetrics",
                        "enabled": true
                    }
                ],
                "logs": [
                    {
                        "category": "DeliveryFailures",
                        "enabled": true
                    },
                    {
                        "category": "PublishFailures",
                        "enabled": true
                    }
                ]
            }
        }
    ]
}
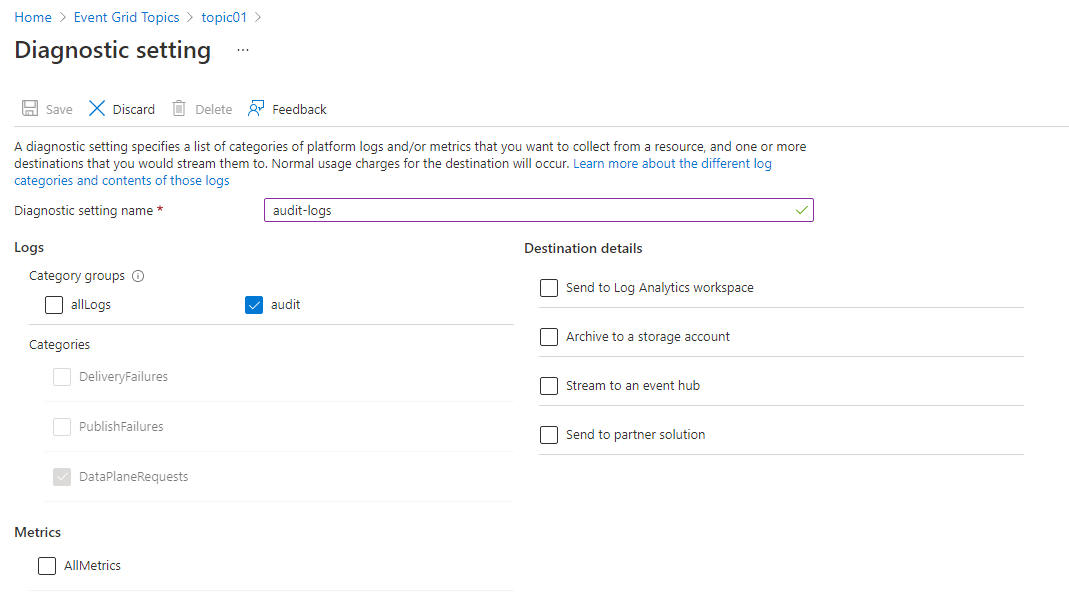
为审核跟踪启用诊断日志
事件网格可以发布数据平面操作的审核跟踪。 若要启用此功能,请在“类别组”部分选择“审核”,或在“类别”部分中选择“DataPlaneRequests”。
审核跟踪可确保仅允许用于已授权目的的数据访问。 它收集有关安全控制的信息,例如资源名称、操作类型、网络访问、级别、区域等。 有关如何启用诊断设置的详细信息,请参阅事件网格主题和事件域中的诊断日志。
重要
有关 DataPlaneRequests 架构的详细信息,请参阅诊断日志。
后续步骤
有关主题或域的诊断日志的日志架构和其他概念性信息,请参阅诊断日志。