教程:为 Power BI 视觉对象项目添加单元测试
本文介绍了为 Power BI 视觉对象编写单元测试的相关基础知识,包括如何:
- 设置 Karma JavaScript 测试运行程序测试框架 Jasmine。
- 使用 powerbi-visuals-utils-testutils 包。
- 借助 Mocks 和 Fakes 来简化 Power BI 视觉对象的单元测试。
先决条件
- 已安装的 Power BI 视觉对象项目
- 经过配置的 Node.JS 环境
本文中的示例使用条形图视觉对象进行测试。
安装和配置 Karma JavaScript 测试运行程序和 Jasmine
将所需的库添加到 devDependencies 部分中的 package.json 文件中:
"@types/d3": "5.7.2",
"@types/d3-selection": "^1.0.0",
"@types/jasmine": "^3.10.2",
"@types/jasmine-jquery": "^1.5.34",
"@types/jquery": "^3.5.8",
"@types/karma": "^6.3.1",
"@types/lodash-es": "^4.17.5",
"coveralls": "^3.1.1",
"d3": "5.12.0",
"jasmine": "^3.10.0",
"jasmine-core": "^3.10.1",
"jasmine-jquery": "^2.1.1",
"jquery": "^3.6.0",
"karma": "^6.3.9",
"karma-chrome-launcher": "^3.1.0",
"karma-coverage": "^2.0.3",
"karma-coverage-istanbul-reporter": "^3.0.3",
"karma-jasmine": "^4.0.1",
"karma-junit-reporter": "^2.0.1",
"karma-sourcemap-loader": "^0.3.8",
"karma-typescript": "^5.5.2",
"karma-typescript-preprocessor": "^0.4.0",
"karma-webpack": "^5.0.0",
"powerbi-visuals-api": "^3.8.4",
"powerbi-visuals-tools": "^3.3.2",
"powerbi-visuals-utils-dataviewutils": "^2.4.1",
"powerbi-visuals-utils-formattingutils": "^4.7.1",
"powerbi-visuals-utils-interactivityutils": "^5.7.1",
"powerbi-visuals-utils-tooltiputils": "^2.5.2",
"puppeteer": "^11.0.0",
"style-loader": "^3.3.1",
"ts-loader": "~8.2.0",
"ts-node": "^10.4.0",
"tslint": "^5.20.1",
"tslint-microsoft-contrib": "^6.2.0"
若要详细了解 package.json,请参阅 npm-package.json 中的说明。
保存 package.json 文件,并在 package.json 文件位置运行以下命令:
npm install
包管理器安装已添加到 package.json 的所有新包。
要运行单元测试,请配置测试运行程序和 webpack 配置。
以下代码是 test.webpack.config.js 文件的示例:
const path = require('path');
const webpack = require("webpack");

module.exports = {
    devtool: 'source-map',
    mode: 'development',
    optimization : {
        concatenateModules: false,
        minimize: false
    },
    module: {
        rules: [
            {
                test: /\.tsx?$/,
                use: 'ts-loader',
                exclude: /node_modules/
            },
            {
                test: /\.json$/,
                loader: 'json-loader'
            },
            {
                test: /\.tsx?$/i,
                enforce: 'post',
                include: /(src)/,
                exclude: /(node_modules|resources\/js\/vendor)/,
                loader: 'istanbul-instrumenter-loader',
                options: { esModules: true }
            },
            {
                test: /\.less$/,
                use: [
                    {
                        loader: 'style-loader'
                    },
                    {
                        loader: 'css-loader'
                    },
                    {
                        loader: 'less-loader',
                        options: {
                            paths: [path.resolve(__dirname, 'node_modules')]
                        }
                    }
                ]
            }
        ]
    },
    externals: {
        "powerbi-visuals-api": '{}'
    },
    resolve: {
        extensions: ['.tsx', '.ts', '.js', '.css']
    },
    output: {
        path: path.resolve(__dirname, ".tmp/test")
    },
    plugins: [
        new webpack.ProvidePlugin({
            'powerbi-visuals-api': null
        })
    ]
};
以下代码是 karma.conf.ts 文件的示例:
"use strict";

const webpackConfig = require("./test.webpack.config.js");
const tsconfig = require("./test.tsconfig.json");
const path = require("path");

const testRecursivePath = "test/visualTest.ts";
const srcOriginalRecursivePath = "src/**/*.ts";
const coverageFolder = "coverage";

process.env.CHROME_BIN = require("puppeteer").executablePath();

import { Config, ConfigOptions } from "karma";

module.exports = (config: Config) => {
    config.set(<ConfigOptions>{
        mode: "development",
        browserNoActivityTimeout: 100000,
        browsers: ["ChromeHeadless"], // or specify Chrome to use the locally installed Chrome browser
        colors: true,
        frameworks: ["jasmine"],
        reporters: [
            "progress",
            "junit",
            "coverage-istanbul"
        ],
        junitReporter: {
            outputDir: path.join(__dirname, coverageFolder),
            outputFile: "TESTS-report.xml",
            useBrowserName: false
        },
        singleRun: true,
        plugins: [
            "karma-coverage",
            "karma-typescript",
            "karma-webpack",
            "karma-jasmine",
            "karma-sourcemap-loader",
            "karma-chrome-launcher",
            "karma-junit-reporter",
            "karma-coverage-istanbul-reporter"
        ],
        files: [
            "node_modules/jquery/dist/jquery.min.js",
            "node_modules/jasmine-jquery/lib/jasmine-jquery.js",
            {
                pattern: './capabilities.json',
                watched: false,
                served: true,
                included: false
            },
            testRecursivePath,
            {
                pattern: srcOriginalRecursivePath,
                included: false,
                served: true
            }
        ],
        preprocessors: {
            [testRecursivePath]: ["webpack", "coverage"]
        },
        typescriptPreprocessor: {
            options: tsconfig.compilerOptions
        },
        coverageIstanbulReporter: {
            reports: ["html", "lcovonly", "text-summary", "cobertura"],
            dir: path.join(__dirname, coverageFolder),
            'report-config': {
                html: {
                    subdir: 'html-report'
                }
            },
            combineBrowserReports: true,
            fixWebpackSourcePaths: true,
            verbose: false
        },
        coverageReporter: {
            dir: path.join(__dirname, coverageFolder),
            reporters: [
                // reporters not supporting the `file` property
                { type: 'html', subdir: 'html-report' },
                { type: 'lcov', subdir: 'lcov' },
                // reporters supporting the `file` property, use `subdir` to directly
                // output them in the `dir` directory
                { type: 'cobertura', subdir: '.', file: 'cobertura-coverage.xml' },
                { type: 'lcovonly', subdir: '.', file: 'report-lcovonly.txt' },
                { type: 'text-summary', subdir: '.', file: 'text-summary.txt' },
            ]
        },
        mime: {
            "text/x-typescript": ["ts", "tsx"]
        },
        webpack: webpackConfig,
        webpackMiddleware: {
            stats: "errors-only"
        }
    });
};
如有需要,可修改此配置。
karma.conf.js 中的代码包含以下变量:
recursivePathToTests:定位测试代码。srcRecursivePath:编译后,定位输出 JavaScript 代码。srcCssRecursivePath:在使用样式编译较少的文件后定位输出 CSS。srcOriginalRecursivePath:定位视觉对象的源代码。coverageFolder:确定要创建覆盖率报表的位置。
配置文件包含以下属性:
singleRun: true:测试在持续集成 (CI) 系统上运行,或者可以运行一次。 可将设置更改为 false 以调试测试false。 Karma 框架保持浏览器运行,以便可以使用控制台进行调试。files: [...]:在本数组中,可以指定要加载到浏览器的文件。 加载的文件通常是源文件、测试用例和库(如 Jasmine 或测试实用工具)。 如有必要,你可以添加更多的文件。preprocessors:在本部分中,你将配置运行单元测试之前运行的操作。 这些操作包括将 TypeScript 预编译为 JavaScript、准备源映射文件以及生成代码覆盖率报表。 可以在调试测试时禁用coverage。coverage会为代码覆盖率测试生成更多代码,这会导致测试调试变得复杂。
如需了解所有 Karma 配置的说明,请转到 Karma 配置文件页。
为方便起见,可以将一个测试命令添加到 package.json 中的 scripts:
{
    "scripts": {
        "pbiviz": "pbiviz",
        "start": "pbiviz start",
        "typings":"node node_modules/typings/dist/bin.js i",
        "lint": "tslint -r \"node_modules/tslint-microsoft-contrib\"  \"+(src|test)/**/*.ts\"",
        "pretest": "pbiviz package --resources --no-minify --no-pbiviz --no-plugin",
        "test": "karma start"
    }
    ...
}
现在可以开始编写单元测试了。
检查视觉对象的 DOM 元素
要测试视觉对象,首先须创建一个视觉对象实例。
创建视觉对象实例生成器
使用以下代码将 visualBuilder.ts 文件添加到“测试”文件夹:
import { VisualBuilderBase } from "powerbi-visuals-utils-testutils";

import { BarChart as VisualClass } from "../src/barChart";

import powerbi from "powerbi-visuals-api";
import VisualConstructorOptions = powerbi.extensibility.visual.VisualConstructorOptions;

export class BarChartBuilder extends VisualBuilderBase<VisualClass> {
  constructor(width: number, height: number) {
    super(width, height);
  }

  protected build(options: VisualConstructorOptions) {
    return new VisualClass(options);
  }

  public get mainElement() {
    return $(this.element).children("svg.barChart");
  }
}
build 方法创建视觉对象的实例。 mainElement 是一个 get 方法,可在视觉对象中返回 root 文档对象模型 (DOM) 元素的实例。 Getter(可选)可使编写单元测试更容易。
现在已经生成了视觉对象实例。 现在来编写测试用例。 示例测试用例检查显示视觉对象时创建的 SVG 元素。
创建用于编写测试用例的 TypeScript 文件
使用以下代码为测试用例添加 visualTest.ts 文件:
import powerbi from "powerbi-visuals-api";

import { BarChartBuilder } from "./visualBuilder";
import { SampleBarChartDataBuilder } from "./visualData";

import DataView = powerbi.DataView;

describe("BarChart", () => {
  let visualBuilder: BarChartBuilder;
  let dataView: DataView;
  let defaultDataViewBuilder: SampleBarChartDataBuilder;

  beforeEach(() => {
    visualBuilder = new BarChartBuilder(500, 500);
    defaultDataViewBuilder = new SampleBarChartDataBuilder();
    dataView = defaultDataViewBuilder.getDataView();
  });

  it("root DOM element is created", () => {
    visualBuilder.updateRenderTimeout(dataView, () => {
      expect(visualBuilder.mainElement[0]).toBeInDOM();
    });
  });
});
调用了多个 Jasmine 方法:
describe:描述测试用例。 在 Jasmine 框架的上下文中,describe通常描述一套或一组规范。beforeEach:在每次调用it方法之前调用,该方法在describe方法中定义。it:定义单个规范。it方法应包含一个或多个expectations。expect:创建规范预期。如果所有预期均通过而未发生任何失败,规范成功。toBeInDOM:是匹配程序的方法之一。 有关匹配程序的详细信息,请参阅 Jasmine 命名空间:匹配程序。
有关 Jasmine 的详细信息,请参阅Jasmine 框架文档页。
启动单元测试
此测试检查视觉对象的根 SVG 元素在视觉对象运行时是否存在。 要运行单元测试,请在命令行工具中输入以下命令:
npm run test
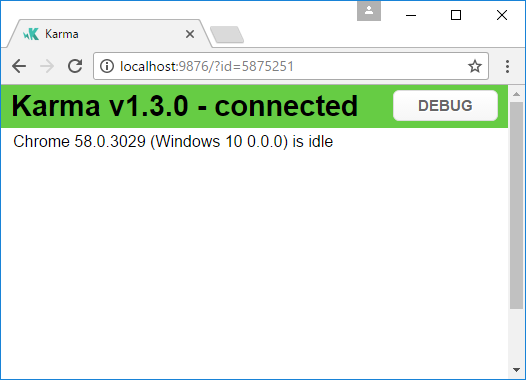
karma.js 在 Chrome 浏览器中运行测试用例。
注意
必须在本地安装 Google Chrome。
在命令行窗口,将得到以下输出:
> karma start

23 05 2017 12:24:26.842:WARN [watcher]: Pattern "E:/WORKSPACE/PowerBI/PowerBI-visuals-sampleBarChart/data/*.csv" does not match any file.
23 05 2017 12:24:30.836:WARN [karma]: No captured browser, open https://localhost:9876/
23 05 2017 12:24:30.849:INFO [karma]: Karma v1.3.0 server started at https://localhost:9876/
23 05 2017 12:24:30.850:INFO [launcher]: Launching browser Chrome with unlimited concurrency
23 05 2017 12:24:31.059:INFO [launcher]: Starting browser Chrome
23 05 2017 12:24:33.160:INFO [Chrome 58.0.3029 (Windows 10 0.0.0)]: Connected on socket /#2meR6hjXFmsE_fjiAAAA with id 5875251
Chrome 58.0.3029 (Windows 10 0.0.0): Executed 1 of 1 SUCCESS (0.194 secs / 0.011 secs)

=============================== Coverage summary ===============================
Statements   : 27.43% ( 65/237 )
Branches     : 19.84% ( 25/126 )
Functions    : 43.86% ( 25/57 )
Lines        : 20.85% ( 44/211 )
================================================================================
如何为单元测试添加静态数据
使用以下代码在“测试”文件夹中创建 visualData.ts 文件:
import powerbi from "powerbi-visuals-api";
import DataView = powerbi.DataView;

import { testDataViewBuilder } from "powerbi-visuals-utils-testutils";

import TestDataViewBuilder = testDataViewBuilder.TestDataViewBuilder;

export class SampleBarChartDataBuilder extends TestDataViewBuilder {
  public static CategoryColumn: string = "category";
  public static MeasureColumn: string = "measure";

  public getDataView(columnNames?: string[]): DataView {
    let dateView: any = this.createCategoricalDataViewBuilder(
      [
          ...
      ],
      [
          ...
      ],
      columnNames
    ).build();

    // there's client side computed maxValue
    let maxLocal = 0;
    this.valuesMeasure.forEach((item) => {
      if (item > maxLocal) {
        maxLocal = item;
      }
    });
    (<any>dataView).categorical.values[0].maxLocal = maxLocal;

    return dataView;
  }
}
SampleBarChartDataBuilder 类扩展 TestDataViewBuilder 并实现抽象方法 getDataView。
将数据放入数据字段存储桶时,Power BI 会生成基于数据的类别 dataview 对象。
在单元测试中,你无法访问通常用于重现数据的 Power BI 核心功能。 但你需要将静态数据映射到类别 dataview。 使用 TestDataViewBuilder 类映射静态数据。
有关数据视图映射的详细信息,请参阅 DataViewMappings。
在 getDataView 方法中,使用数据调用 createCategoricalDataViewBuilder 方法。
在 sampleBarChart 视觉对象 capabilities.json 文件中,我们有 dataRoles 和 dataViewMapping 对象:
"dataRoles": [
    {
        "displayName": "Category Data",
        "name": "category",
        "kind": "Grouping"
    },
    {
        "displayName": "Measure Data",
        "name": "measure",
        "kind": "Measure"
    }
],
"dataViewMappings": [
    {
        "conditions": [
            {
                "category": {
                    "max": 1
                },
                "measure": {
                    "max": 1
                }
            }
        ],
        "categorical": {
            "categories": {
                "for": {
                    "in": "category"
                }
            },
            "values": {
                "select": [
                    {
                        "bind": {
                            "to": "measure"
                        }
                    }
                ]
            }
        }
    }
],
若要生成相同的映射,必须将以下参数设置为 createCategoricalDataViewBuilder 方法:
([
    {
        source: {
            displayName: "Category",
            queryName: SampleBarChartDataBuilder.CategoryColumn,
            type: ValueType.fromDescriptor({ text: true }),
            roles: {
                Category: true
            },
        },
        values: this.valuesCategory
    }
],
[
    {
        source: {
            displayName: "Measure",
            isMeasure: true,
            queryName: SampleBarChartDataBuilder.MeasureColumn,
            type: ValueType.fromDescriptor({ numeric: true }),
            roles: {
                Measure: true
            },
        },
        values: this.valuesMeasure
    },
], columnNames)
其中,this.valuesCategory 是类别的数组:
public valuesCategory: string[] = ["Monday", "Tuesday", "Wednesday", "Thursday", "Friday", "Saturday", "Sunday"];
this.valuesMeasure 是每个类别的度量值数组:
public valuesMeasure: number[] = [742731.43, 162066.43, 283085.78, 300263.49, 376074.57, 814724.34, 570921.34];
visualData.ts 的最终版本包含以下代码:
import powerbi from "powerbi-visuals-api";
import DataView = powerbi.DataView;

import { testDataViewBuilder } from "powerbi-visuals-utils-testutils";
import { valueType } from "powerbi-visuals-utils-typeutils";
import ValueType = valueType.ValueType;

import TestDataViewBuilder = testDataViewBuilder.TestDataViewBuilder;

export class SampleBarChartDataBuilder extends TestDataViewBuilder {
  public static CategoryColumn: string = "category";
  public static MeasureColumn: string = "measure";
  public valuesCategory: string[] = [
    "Monday",
    "Tuesday",
    "Wednesday",
    "Thursday",
    "Friday",
    "Saturday",
    "Sunday",
  ];
  public valuesMeasure: number[] = [
    742731.43, 162066.43, 283085.78, 300263.49, 376074.57, 814724.34, 570921.34,
  ];

  public getDataView(columnNames?: string[]): DataView {
    let dataView: any = this.createCategoricalDataViewBuilder(
      [
        {
          source: {
            displayName: "Category",
            queryName: SampleBarChartDataBuilder.CategoryColumn,
            type: ValueType.fromDescriptor({ text: true }),
            roles: {
              category: true,
            },
          },
          values: this.valuesCategory,
        },
      ],
      [
        {
          source: {
            displayName: "Measure",
            isMeasure: true,
            queryName: SampleBarChartDataBuilder.MeasureColumn,
            type: ValueType.fromDescriptor({ numeric: true }),
            roles: {
              measure: true,
            },
          },
          values: this.valuesMeasure,
        },
      ],
      columnNames
    ).build();

    // there's client side computed maxValue
    let maxLocal = 0;
    this.valuesMeasure.forEach((item) => {
      if (item > maxLocal) {
        maxLocal = item;
      }
    });
    (<any>dataView).categorical.values[0].maxLocal = maxLocal;

    return dataView;
  }
}
现在,可在单元测试中使用 SampleBarChartDataBuilder 类。
ValueType 类在 powerbi-visuals-utils-testutils 包中定义。
将 powerbi-visuals-utils-testutils 包添加到依赖项。 在 package.json 文件中,找到 dependencies 部分并添加以下代码:
"powerbi-visuals-utils-testutils": "^2.4.1",
调用
npm install
以安装 powerbi-visuals-utils-testutils 包。
现在,可再次运行单元测试。 必获得以下输出:
> karma start

23 05 2017 16:19:54.318:WARN [watcher]: Pattern "E:/WORKSPACE/PowerBI/PowerBI-visuals-sampleBarChart/data/*.csv" does not match any file.
23 05 2017 16:19:58.333:WARN [karma]: No captured browser, open https://localhost:9876/
23 05 2017 16:19:58.346:INFO [karma]: Karma v1.3.0 server started at https://localhost:9876/
23 05 2017 16:19:58.346:INFO [launcher]: Launching browser Chrome with unlimited concurrency
23 05 2017 16:19:58.394:INFO [launcher]: Starting browser Chrome
23 05 2017 16:19:59.873:INFO [Chrome 58.0.3029 (Windows 10 0.0.0)]: Connected on socket /#NcNTAGH9hWfGMCuEAAAA with id 3551106
Chrome 58.0.3029 (Windows 10 0.0.0): Executed 1 of 1 SUCCESS (1.266 secs / 1.052 secs)

=============================== Coverage summary ===============================
Statements   : 56.72% ( 135/238 )
Branches     : 32.54% ( 41/126 )
Functions    : 66.67% ( 38/57 )
Lines        : 52.83% ( 112/212 )
================================================================================
摘要显示覆盖范围有所增加。 若要详细了解当前代码覆盖率,请打开 coverage/html-report/index.html 文件。
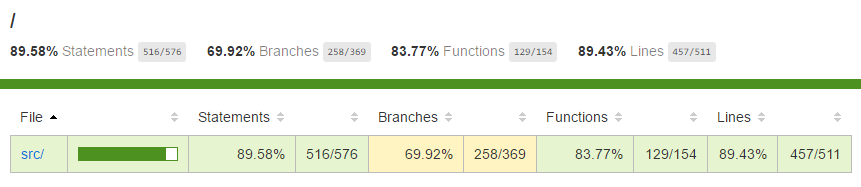
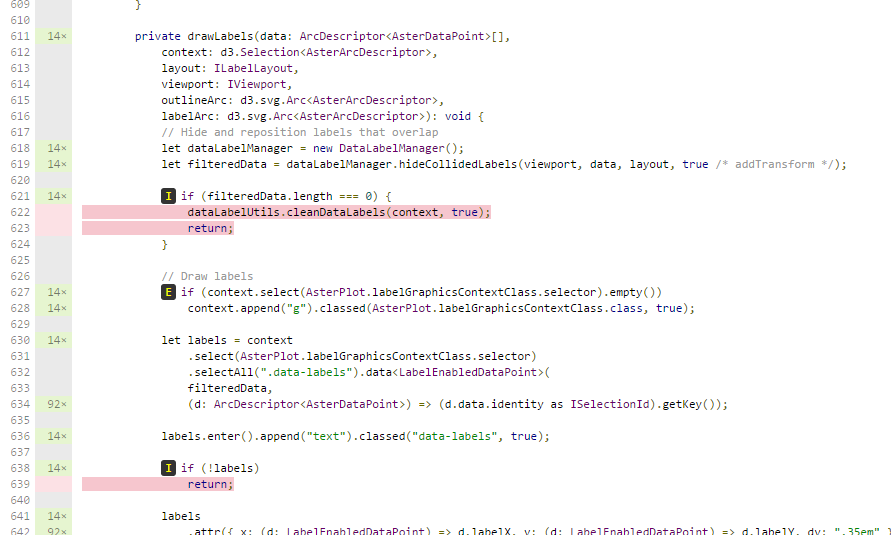
或查看 src 文件夹的范围:
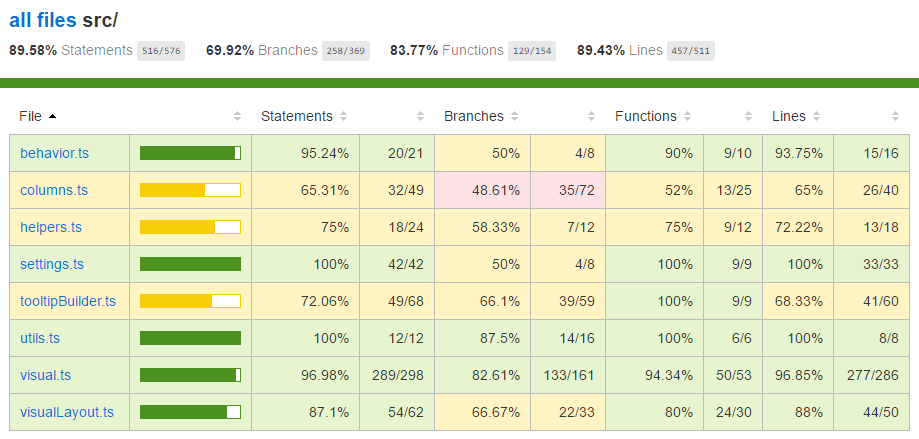
在文件范围内,可查看源代码。 如果在单元测试期间未运行某些代码行,coverage 实用程序将以红色突出显示该行。
重要
代码覆盖并不意味会实现好的视觉对象功能覆盖。 一个简单的单元测试可以在 src/barChart.ts 中提供超过 96% 的覆盖率。
调试
若要通过浏览器控制台调试测试,请在 karma.conf.ts 中将 singleRun 值更改为 false。 当浏览器在测试运行后启动时,此设置将使浏览器保持运行。
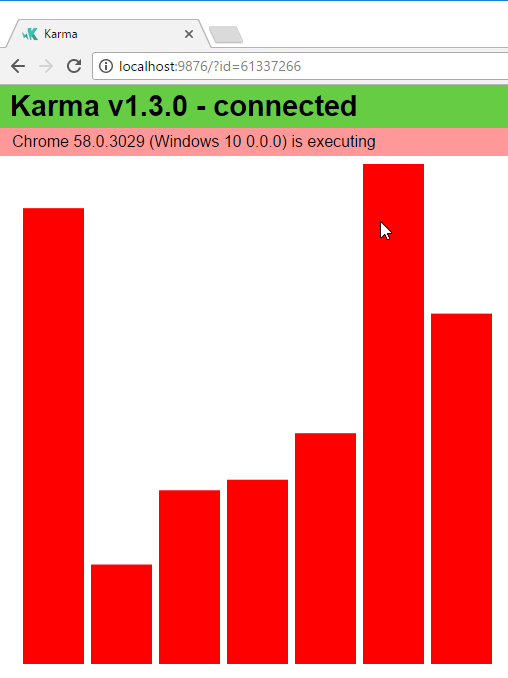
视觉对象将在 Chrome 浏览器中打开。
相关内容
当视觉对象就绪时,你可以提交并发布它。 有关详细信息,请参阅将 Power BI 视觉对象发布到 AppSource。
反馈
即将发布:在整个 2024 年,我们将逐步淘汰作为内容反馈机制的“GitHub 问题”,并将其取代为新的反馈系统。 有关详细信息,请参阅:https://aka.ms/ContentUserFeedback。
提交和查看相关反馈