On-premises diagnostics
The Microsoft Dynamics 365 team monitors the health and performance of the Azure Services that provide functionality for our cloud-based customers by using state-of-the-art Azure diagnostic tools. For customers who have implemented Finance + Operations (on-premises) and would like to have the ability to monitor the health and performance of their on-premises solution, there are several third-party offerings available.
This article describes the setup and configuration of Elastic Stack, a third-party product, and one of many choices that can provide diagnostic monitoring of your on-premises solution.
When you consider a diagnostic solution, consider the following fundamentals of your implementation:
- Your diagnostic system should be able to collect and store 30 days' worth of diagnostic information.
- Your diagnostic repository should be set up in a central location that is sharable among many client computers.
- Create structured diagnostics events, including event type, classification, and data.
- Events stored in raw text (deserialized) can be easily queried and searched.
- Avoid storing sensitive or personal data in events.
Note
By default, communication in an Elastic Stack cluster is not sent over HTTPS. Don't set up the Elastic Stack unless you've considered the risks, and prepared or implemented mitigations for those risks. The paid version of X-Pack can be used to encrypt communication in the Elastic Stack. For setup information, see Setting up TLS on a cluster. There is also an open source Elasticsearch plug-in. Although Microsoft hasn't tested this plug-in, according to the documentation, it can enable HTTPS. Microsoft recommends that you always utilize encrypted communication using HTTPs, VPN, or another secure, encrypted protocol. Many industry certifications and laws require the use of encrypted transmission if your content includes end user, customer, personal, or sensitive data.
Diagnostic data guidelines
To diagnose the deployment and execution of Finance + Operations (on-premises), you must have access to diagnostic data. For a cloud deployment, Microsoft stores and monitors the diagnostic data from services to help keep the environment healthy. For an on-premises deployment, the customer is responsible for this task.
You can select the diagnostic data store and query tool that you prefer to use. However, at a minimum, the tool should perform the following tasks:
- The store should be able to store 30 days' worth of diagnostic data.
- The events should be stored in a centralized location, so that support engineers don't have to switch between multiple machines to find events that are relevant to an issue.
- The events should be discoverable based on event type and event data.
- The event data (in XML format) should be deserialized so that the event data can be queried on and traversed.
Elastic Stack example
To meet the diagnostic data guidelines that are listed in the previous section, Microsoft tested the Elastic Stack setup. This setup includes the following components:
- Elasticsearch – For storage, event indexing, and event querying. For more information about Elasticsearch, see the Elastic website.
- Logstash – For load distribution and event data transformation.
- Winlogbeat – For diagnostic data collection.
- Kibana – An interface for querying the data that is stored in Elasticsearch.
Note
By default, communication in an Elastic Stack cluster is not sent over HTTPS. Don't set up the Elastic Stack unless you've considered the risks, and prepared or implemented mitigations for those risks. The paid version of X-Pack can be used to encrypt communication in the Elastic Stack. For setup information, see Setting up TLS on a cluster. There is also an open source Elasticsearch plug-in. Although Microsoft hasn't tested this plug-in, according to the documentation, it can enable HTTPS.
If you deploy the Elastic Stack, your experience might vary if you follow the steps that are described in this article. For its tests, Microsoft used version 6.2.3 of the Elastic Stack components and Microsoft Dynamics 365 Finance 7.3 with platform update 12.
This article describes how Microsoft handled the setup and configuration steps that are required for the Elastic Stack to work for an on-premises deployment. For guidance that isn't related to Finance + Operations (on-premises), see the documentation on Elastic.co.
Install and configure the Elastic Stack
All hosted components of the Elastic Stack, except Winlogbeat, run on Java. For the test scenario, Microsoft first downloaded and installed the latest version of Java Runtime Environment (JRE) 8 (64-bit) on each node that will run Elasticsearch, Logstash, or Kibana (that is, all the Orchestrator nodes). You can get Java 8 from https://www.oracle.com/technetwork/java/javase/downloads/index.html.
As of June 2018, the Elastic Stack runs on Java 8. Any attempt to run it on a newer version of Java might not work.
Note
The whole Elastic Stack, except Winlogbeat, can be hosted on Linux. For its tests, Microsoft hosted the stack on Microsoft Windows Server 2016 virtual machines (VMs).
Remember to open ports in the firewall for the various components on each node.
If you get stuck during setup, Elastic.co has extensive and well-written documentation about the installation and configuration of the Elastic Stack. For help with specific types of errors, web searches yield reliable results from both the Elastic.co forum and StackOverflow.
Component matrix
For its tests, Microsoft used the following setup for a small to medium-sized deployment.
| Node | Elasticsearch | Logstash | Kibana | Winlogbeat |
|---|---|---|---|---|
| Orchestrator #1 | X | X | ||
| Orchestrator #2 | X | X | X | |
| Orchestrator #3 | X | X | X | |
| AOS #1...n | X |
Important
For testing purposes, Microsoft used the Orchestrator machines for the ELK installation. Because it can take up critical resources from the Orchestration services, don't use the Orchestrator machines for ELK installations on production environments or critical Sandbox Environments. Instead, use separate machines to host the ELK services.
Elasticsearch
The installation of Elasticsearch is fairly straightforward. For its tests, Microsoft downloaded the Microsoft Windows Installer (MSI) file onto the Orchestrator #1 and Orchestrator #2 nodes. Most of the default settings in the installer can be left as is. This section describes the settings that Microsoft changed.
To facilitate Elasticsearch to start running again if the operating system (OS) is restarted, Microsoft installed it as a service on Windows. The installer can be used to set up the service.
On the Configuration page of the installer, Microsoft used the same cluster name when it installed each Elasticsearch node in the cluster.
Microsoft set every Elasticsearch node to perform all three roles: Data, Master, and Ingest.
Depending on the amount that you expect Kibana and Elasticsearch to be used, consider increasing the memory usage. You can change this setting later by modifying the -Xm options in the C:\ProgramData\Elastic\Elasticsearch\config\jvm.options file and restarting Elasticsearch.
Depending on the number of Elasticsearch nodes that you set up, you can set the Discovery minimum master nodes appropriately. If you aren't sure, you can keep the master nodes empty. For more information about discovery and nodes, see Node.
For discoverability, in Network settings, Microsoft set the Network host value of each node to that node's IP address and added the IP addresses of all Elasticsearch nodes to the Unicast Hosts list for each node. For example, for Orchestrator #1, which has the IP address 10.0.0.12, Microsoft set the Network host value to 10.0.0.12 and added the following IP addresses to the Unicast Hosts list: 10.0.0.12 and 10.0.0.13, where 10.0.0.13 is Orchestrator #2.
If you're installing Elasticsearch version 6.3 or higher, you can disregard this paragraph. You can install X-Pack either now or later. For more information about setup and whether you should install X-Pack, see the "X-Pack" section of this article. For now, unless you know what X-Pack is for, don't install it.
Important
Open the HTTP port (by default, port 9200) and the node communication port (by default, port 9300) in your firewall.
To verify that the installation was successful, start a browser, and open the application address. You should see some JavaScript Object Notation (JSON) output.
Logstash
In its test setup, Microsoft found that some events from Winlogbeat required adjustments. Logstash provides that functionality.
Microsoft downloaded Logstash to C:\ELK\Logstash on the Orchestrator #2 and Orchestrator #3 nodes.
To help ensure that Logstash runs on startup, we used the Non-Sucking Service Manager (NSSM) to set up a service for the Logstash batch script.
Copy nssm.exe to the Logstash bin folder (for example, C:\ELK\Logstash\6.2.4\bin\).
Open Windows PowerShell from the bin folder, and run the following command.
.\nssm.exe install LogstashOn the Application tab, set the following fields, and then click Save:
- Path: C:\ELK\Logstash\6.2.4\bin\logstash.bat
- Startup directory: C:\ELK\Logstash\6.2.4
- Arguments: -f C:\ELK\Logstash\config\logstash-dyn365finops.conf
(There are more settings that you can set. However, these settings suffice for now.)
Run the following command.
.\nssm.exe start Logstash
In the tests that Microsoft performed, NSSM had trouble restarting the installed services. Because NSSM wasn't 100-percent reliable for Logstash and Kibana, the service was treated as an OS startup service and little else.
Microsoft created a configuration file for Logstash called logstash-dyn365finops.conf. This file is available in the LCS Shared Asset library, under the Model asset type in a zipped file called "LBD Diagnostic configurations". Go to the LCS Shared Asset library to download this file. After you extract it, you need to put it in C:\ELK\Logstash\6.2.4\config. This file performs useful transformations on diagnostics.
To make the configuration work for your setup, you must change the hosts fields in the output section so that they point to the Elasticsearch nodes in your cluster. For example, change hosts to ["ORCH1:9200", "ORCH2:9200"].
The configuration was tested by using the Winlogbeat configuration from the next section.
Remember to open the Winlogbeat port (by default, port 5044) in your firewall on the machine that is hosting Logstash, so that Beats can send data to Logstash.
Winlogbeat
Microsoft downloaded Winlogbeat to each Application Object Server (AOS) and Orchestrator node at C:\ELK\Winlogbeat, and configured the winlogbeat.yml file. The sample configuration file for Winlogbeat is available in the LCS Shared Asset library, under the Model asset type in a zipped file called "LBD Diagnostic configurations". Go to the LCS Shared Asset library to download this file.
To make the configuration work for your set up, you must change the output.logstash.hosts fields so that they point to all your Logstash nodes. Winlogbeat handles the load balancing.
When Winlogbeat runs on an Orchestrator node, the Tags field can be changed from AOS to ORCH or a similar value. Microsoft also used the fields.env field to set the environment of the deployment (sandbox, sandbox-n, or production). In this way, there is a cleaner separation when data from multiple environments and node types is queried.
Winlogbeat includes a service installer. Microsoft used this installer to set up Winlogbeat as a service on each node. Press the Windows logo key+R to start the Run tool, and then run the following command.
powershell.exe -ExecutionPolicy Bypass -File C:\ELK\Winlogbeat\install-service-winlogbeat.ps1
Kibana
Kibana provides the interface to query the diagnostic data in Elasticsearch.
Microsoft downloaded Kibana to C:\ELK\Kibana and configured the kibana.yml file in the following manner.
server.host: "10.0.0.14"
server.name: "Dyn365FinOps On-Premises Diagnostics"
elasticsearch.url: "http://ORCH1:9200"
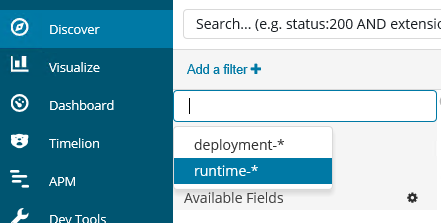
From Kibana, Microsoft had to define index patterns on the Management tab. Because index patterns group indexes by name, an index pattern was required for the two indexes that were made: deployment-* and runtime-*. The index names are case-sensitive.
Microsoft set the runtime-* index pattern as the default pattern. When you're looking at the index patterns on the Management tab, click the asterisk (*). The index pattern will then appear on the Discover tab.
Microsoft ran Kibana as a service in the same manner as Logstash, so that Kibana is started at OS startup. Unlike Logstash, kibana.bat doesn't need the path of the configuration files. Therefore, you can just install an NSSM service that points to C:\ELK\Kibana\6.2.4\bin\kibana.bat.
If you want users to browse Kibana on your network, remember to open the port for Kibana. The default port is 5601.
Example queries on the Discover tab in Kibana
The following sample queries can help you start probing the diagnostic data. If you require something more than the examples show, you can try one of the following queries:
Find slow database queries: Enter slow in the search field to find events that have the word "slow" somewhere in the event data. If you want to be more precise, you can find events that have a task name of AosDatabaseSlowQuery and then enter TaskName:AosDatabaseSlowQuery in the search field.
Find recent exceptions: Enter exception in the search field to find events that have either thrown an exception, or handled an exception and logged it. In the upper-right corner of Kibana, you can select the time frame that the search should be limited to. The time frame that you set there is persisted between tabs. Therefore, the data on the Visualize tab will reflect the selected time frame.

Find events from an AOS node: Enter host:AOS1 in the search field to find all events from that node.
Find events with proximity, in time, to another: When you've found an event that you're interested in, click View surrounding documents next to the header of that event to find events that occurred at the same time. If you see events that occurred at around the same time but from different AOS nodes, you can add additional filtering to view only events from the node that you want.

Thirty-day data retention
To keep its hard disks free from stale data, Microsoft used Curator v5.5 to clean up indexes that were older than 30 days.
Microsoft downloaded Curator to one of the Orchestrator nodes at C:\ELK\Curator. The sample configuration file, curator.yml, available in the LCS Shared Asset library, under the Model asset type in zipped file "LBD Diagnostic configurations", was then put in C:\ELK\Curator to connect Curator to its Elasticsearch cluster. You'll need to edit the file to reference your specific servers.
Curator runs actions, and Microsoft created an action configuration file called "30day_data_retention_actions.yml" to clean up 30-day-old indexes in C:\ELK\Curator. The retention configuration file is available in the LCS Shared Asset Library, under the Model asset type in a zipped file called "LBD Diagnostic configurations". Go to the LCS Shared Asset Library to download this file.
Microsoft created a basic task in Windows Task Scheduler. This task has a weekly trigger on Saturday and Sunday, and the trigger has the following settings to start a program:
- Program/script: C:\ELK\Curator\curator.exe
- Add arguments: --config curator.yml .\30day_data_retention_actions.yml
- Start in: C:\ELK\Curator
X-Pack
Important
As of June 2018, Elastic Stack components have been released that start with version 6.3. This updated version handles X-Pack in a more graceful manner, by enabling the free features of X-Pack by default, without requiring that you update the license every year, and by letting you opt in to the paid features afterward. If you install an Elastic Stack version that is earlier than 6.3, the content in this section only partially applies to the setup.
You can select to install X-Pack when you install Elasticsearch. Alternatively, you can install it later.
X-Pack has a free basic license that must be updated every year.
Microsoft installed the free version to enable query data to be exported from Kibana in comma-separated value (CSV) format. There are other useful features in X-Pack, but some are available only in a paid subscription.
To enable only the free features and avoid using other X-Pack trial features, Microsoft added the following settings to our elasticsearch.yml and kibana.yml configuration files:
xpack.graph.enabled: false
xpack.ml.enabled: false
xpack.security.enabled: false
xpack.watcher.enabled: false
These settings also stop Kibana and Elasticsearch from asking for credentials because the security module is no longer enabled.
For X-Pack to work, the logstash.yml configuration file must also be configured in the following manner.
xpack.monitoring.elasticsearch.url: "http://orch1:9200"
The paid version of X-Pack includes HTTPS encryption for connections throughout the cluster, password-protected data access, and more. For more information about X-Pack, see the Elastic website.
Export a query to a CSV file
In Kibana, on the Discover tab, write a query, and save it. After you save the query, on the Reporting tab at the top of the Discover page, click Generate CSV.
Troubleshooting
You don't receive any data in Kibana
If you don't receive any data in Kibana, review the logs from Winlogbeat to Logstash, Elasticsearch, and Kibana. Note that the Winlogbeat installation puts its logs in C:\ProgramData\winlogbeat\Logs, whereas the other Elastic Stack components put their logs close to the installation path (for example, in C:\ELK\Elasticsearch\logs).
意見反映
即將推出:我們會在 2024 年淘汰 GitHub 問題,並以全新的意見反應系統取代並作為內容意見反應的渠道。 如需更多資訊,請參閱:https://aka.ms/ContentUserFeedback。
提交及檢視以下的意見反映: