在 Grafana 中使用 Prometheus 監視應用程式路由附加元件中的 ingress-nginx 控制器計量 (預覽)
應用程式路由附加元件中的 ingress-nginx 控制器會公開許多要求、nginx 程序和控制器的計量,可協助分析應用程式的效能和使用。
應用程式路由附加元件會在連接埠 10254 上的 /metrics 公開 Prometheus 計量端點。
重要
AKS 預覽功能可透過自助服務,以加入方式使用。 預覽會以「現狀」和「可供使用時」提供,其其不受服務等級協定和有限瑕疵擔保所保護。 客戶支援部門會盡最大努力,部分支援 AKS 預覽。 因此,這些功能不適合實際執行用途。 如需詳細資訊,請參閱下列支援文章:
必要條件
- 已啟用應用程式路由附加元件的 Azure Kubernetes Service (AKS) 叢集。
- Prometheus 執行個體,例如適用於 Prometheus 的 Azure 監視器受管理服務。
- Grafana 執行個體,例如 Azure 受控 Grafana。
驗證計量端點
若要驗證正在收集的計量,您可以設定連接埠,將計量資料轉送至其中一個 ingress-nginx 控制器 Pod。
kubectl get pods -n app-routing-system
NAME                            READY   STATUS    RESTARTS   AGE
external-dns-667d54c44b-jmsxm   1/1     Running   0          4d6h
nginx-657bb8cdcf-qllmx          1/1     Running   0          4d6h
nginx-657bb8cdcf-wgcr7          1/1     Running   0          4d6h
現在,將本機連接埠的計量資料轉送至其中一個 nginx Pod 上的連接埠 10254。
kubectl port-forward nginx-657bb8cdcf-qllmx -n app-routing-system :10254
Forwarding from 127.0.0.1:43307 -> 10254
Forwarding from [::1]:43307 -> 10254
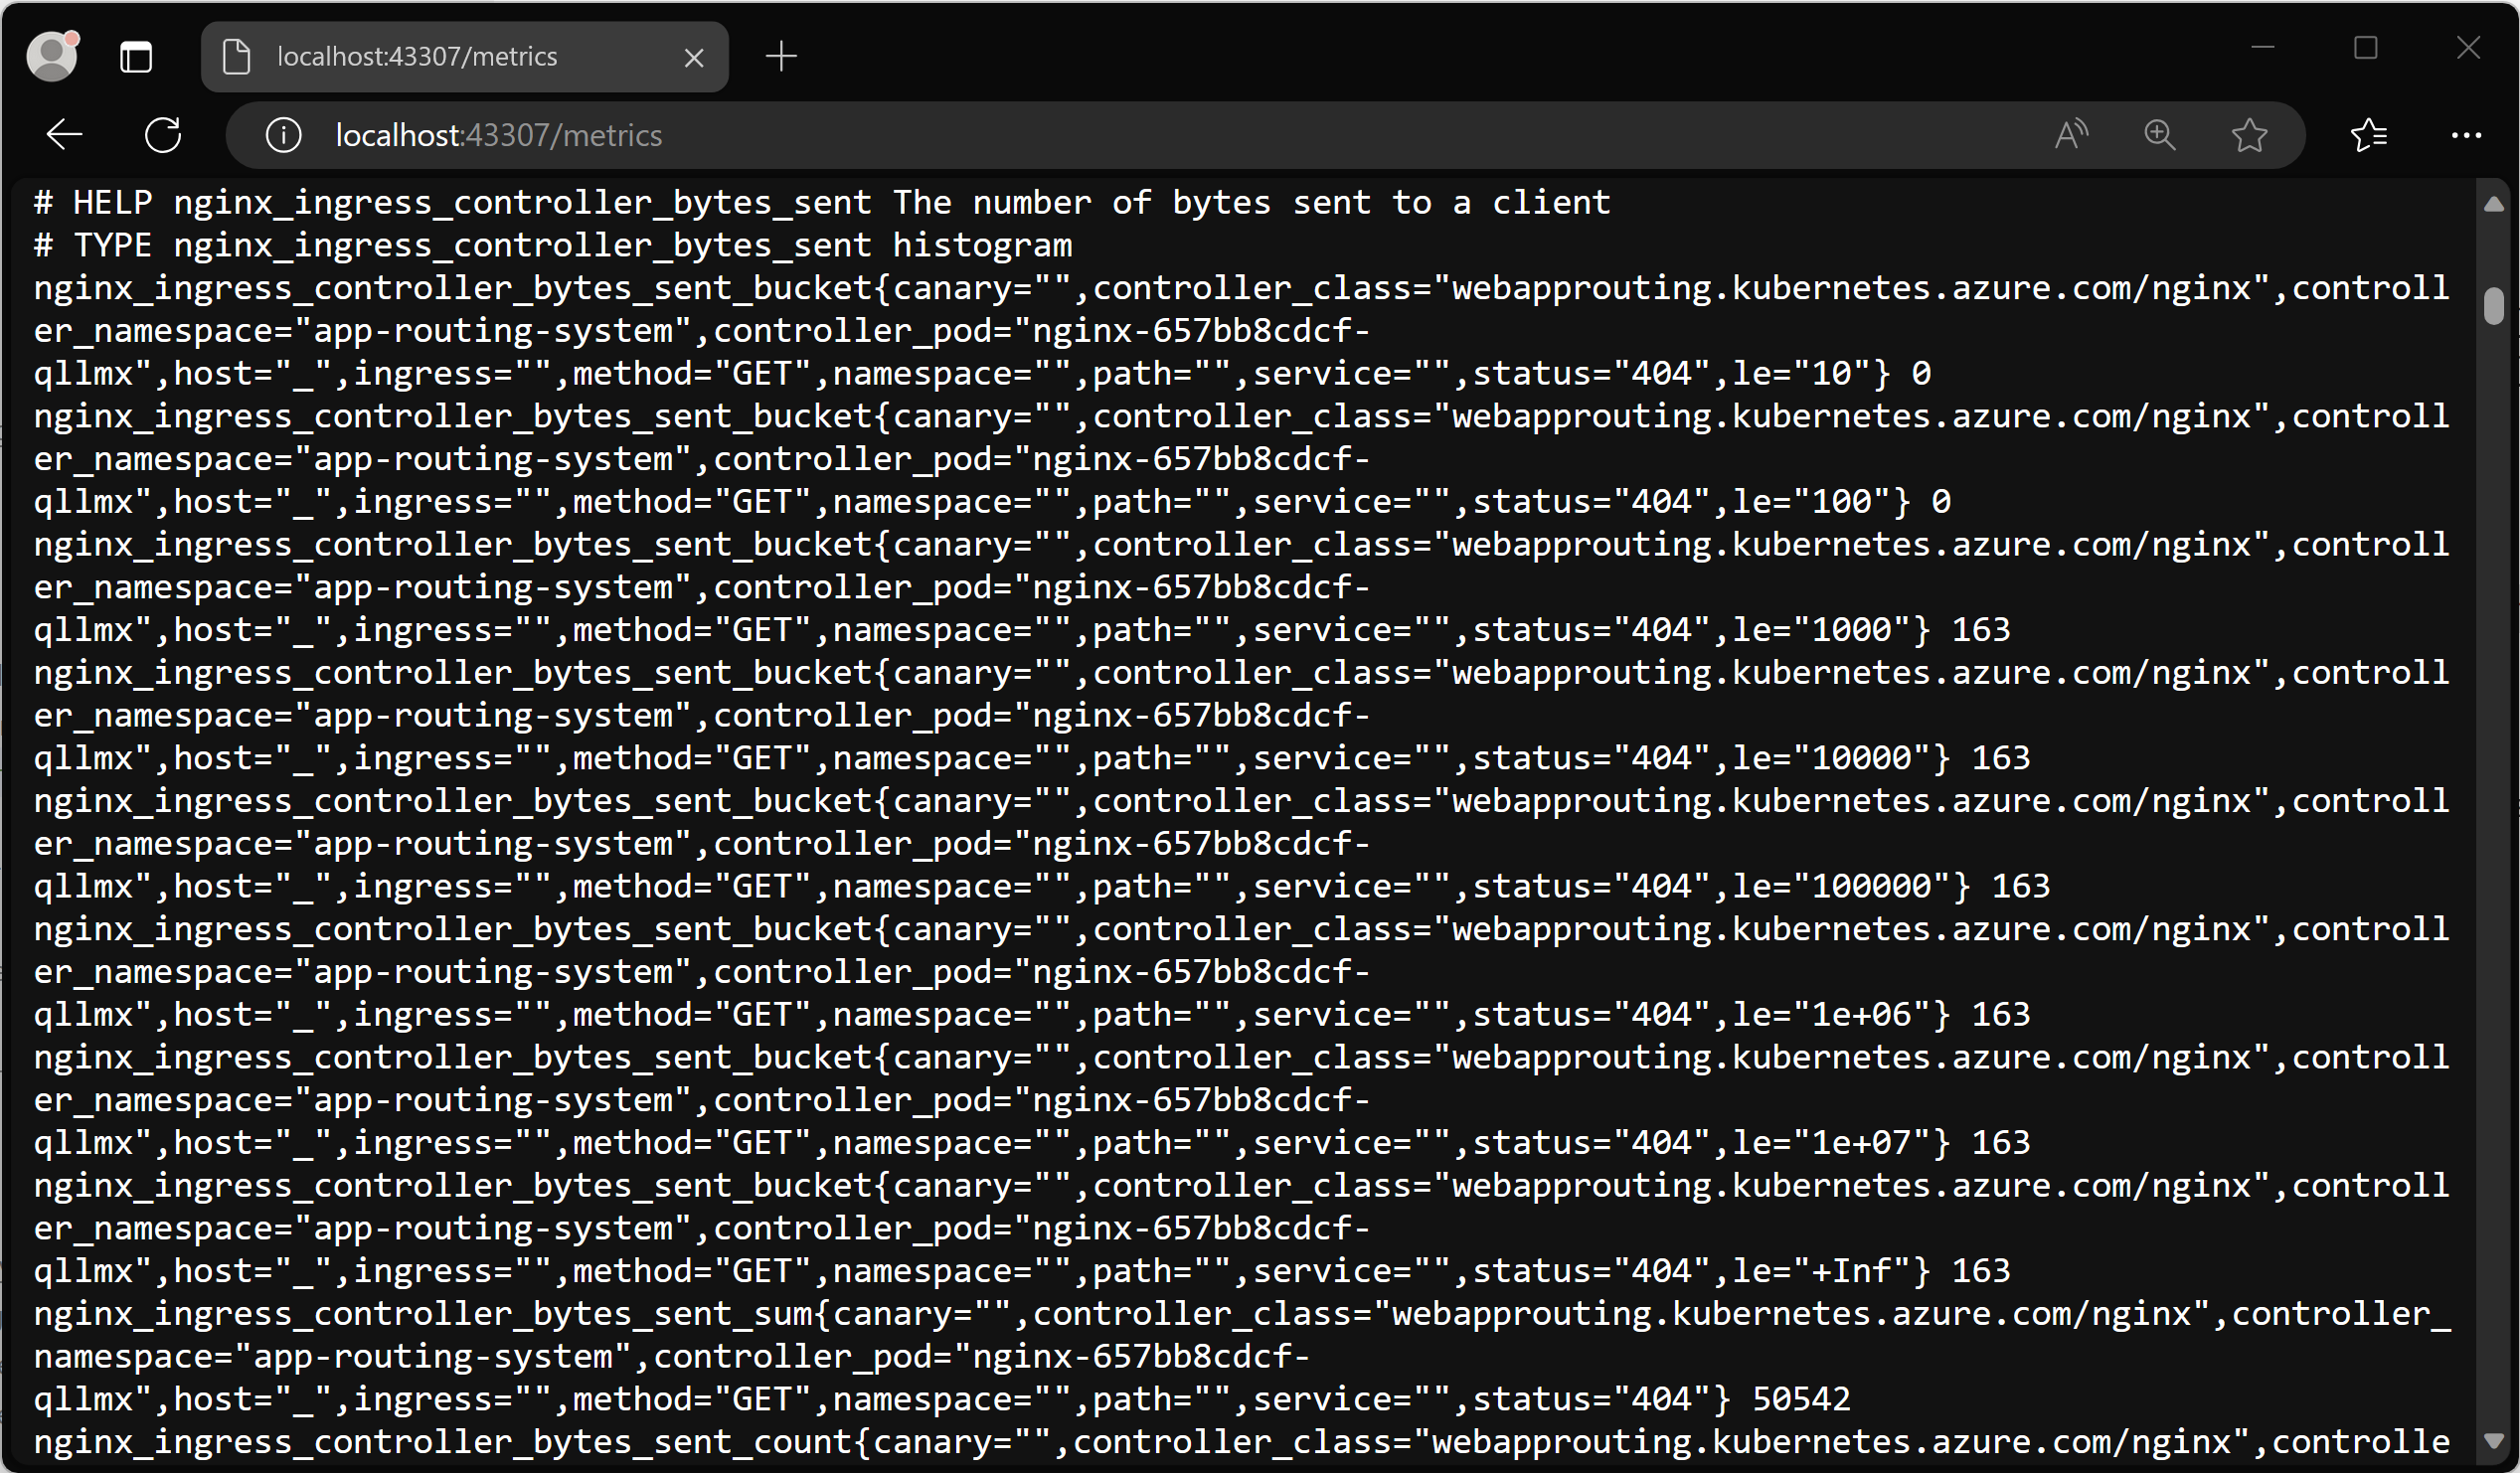
請記下本機連接埠 (在此案例中為 43307),然後在瀏覽器中開啟 http://localhost:43307/metrics。 您應該會看到 ingress-nginx 控制器計量載入。
您現在可以終止 port-forward 程序以關閉轉送。
使用容器深入解析設定適用於 Prometheus 和 Azure 受控 Grafana 的 Azure 監視器受管理服務
適用於 Prometheus 的 Azure 監視器受管理服務是完全受控的 Prometheus 相容服務,支援業界標準功能,例如 PromQL、Grafana 儀表板,以及 Prometheus 警示。 此服務需要設定 Azure 監視器代理程式的計量附加元件,將資料傳送至 Prometheus。 如果叢集未使用附加元件設定,您可以遵循本文中的指示來設定 Azure Kubernetes Service (AKS) 叢集,將資料傳送至適用於 Prometheus 的 Azure 監視器受管理服務,並將收集的計量傳送至 Azure 受控 Grafana 執行個體。
啟用以 Pod 註釋為基礎的抓取
使用 Azure 監視器代理程式更新叢集後,您必須設定代理程式以根據 Pod 註釋來啟用抓取,這些註釋會新增至 ingress-nginx Pod。 設定此設定的其中一種方式是在 kube-system 命名空間中使用 ama-metrics-settings-configmap ConfigMap。
警告
這會取代 kube-system 中現有的 ama-metrics-settings-configmap ConfigMap。 如果您已經有設定,可以建立備份或與此設定合併。
若要備份現有的 ama-metrics-settings-config ConfigMap (如果存在),請執行 kubectl get configmap ama-metrics-settings-configmap -n kube-system -o yaml > ama-metrics-settings-configmap-backup.yaml
下列設定會將 podannotationnamespaceregex 參數設為 .* 以抓取所有命名空間。
kubectl apply -f - <<EOF
kind: ConfigMap
apiVersion: v1
metadata:
  name: ama-metrics-settings-configmap
  namespace: kube-system
data:
  schema-version:
    #string.used by agent to parse config. supported versions are {v1}. Configs with other schema versions will be rejected by the agent.
    v1
  config-version:
    #string.used by customer to keep track of this config file's version in their source control/repository (max allowed 10 chars, other chars will be truncated)
    ver1
  prometheus-collector-settings: |-
    cluster_alias = ""
  default-scrape-settings-enabled: |-
    kubelet = true
    coredns = false
    cadvisor = true
    kubeproxy = false
    apiserver = false
    kubestate = true
    nodeexporter = true
    windowsexporter = false
    windowskubeproxy = false
    kappiebasic = true
    prometheuscollectorhealth = false
  # Regex for which namespaces to scrape through pod annotation based scraping.
  # This is none by default. Use '.*' to scrape all namespaces of annotated pods.
  pod-annotation-based-scraping: |-
    podannotationnamespaceregex = ".*"
  default-targets-metrics-keep-list: |-
    kubelet = ""
    coredns = ""
    cadvisor = ""
    kubeproxy = ""
    apiserver = ""
    kubestate = ""
    nodeexporter = ""
    windowsexporter = ""
    windowskubeproxy = ""
    podannotations = ""
    kappiebasic = ""
    minimalingestionprofile = true
  default-targets-scrape-interval-settings: |-
    kubelet = "30s"
    coredns = "30s"
    cadvisor = "30s"
    kubeproxy = "30s"
    apiserver = "30s"
    kubestate = "30s"
    nodeexporter = "30s"
    windowsexporter = "30s"
    windowskubeproxy = "30s"
    kappiebasic = "30s"
    prometheuscollectorhealth = "30s"
    podannotations = "30s"
  debug-mode: |-
    enabled = false
EOF
幾分鐘後,kube-system 命名空間中的 ama-metrics Pod 應該會重新啟動並挑選新的設定。
檢閱 Azure 受控 Grafana 中計量的視覺效果
既然您已設定適用於 Prometheus 的 Azure 監視器受管理服務和 Azure 受控 Grafana,則應存取您的受控 Grafana 執行個體。
您可以下載並匯入 Grafana 執行個體的官方 ingress-nginx 儀表板有兩個:
- Ingress-nginx 控制器儀表板
- 要求處理效能儀表板
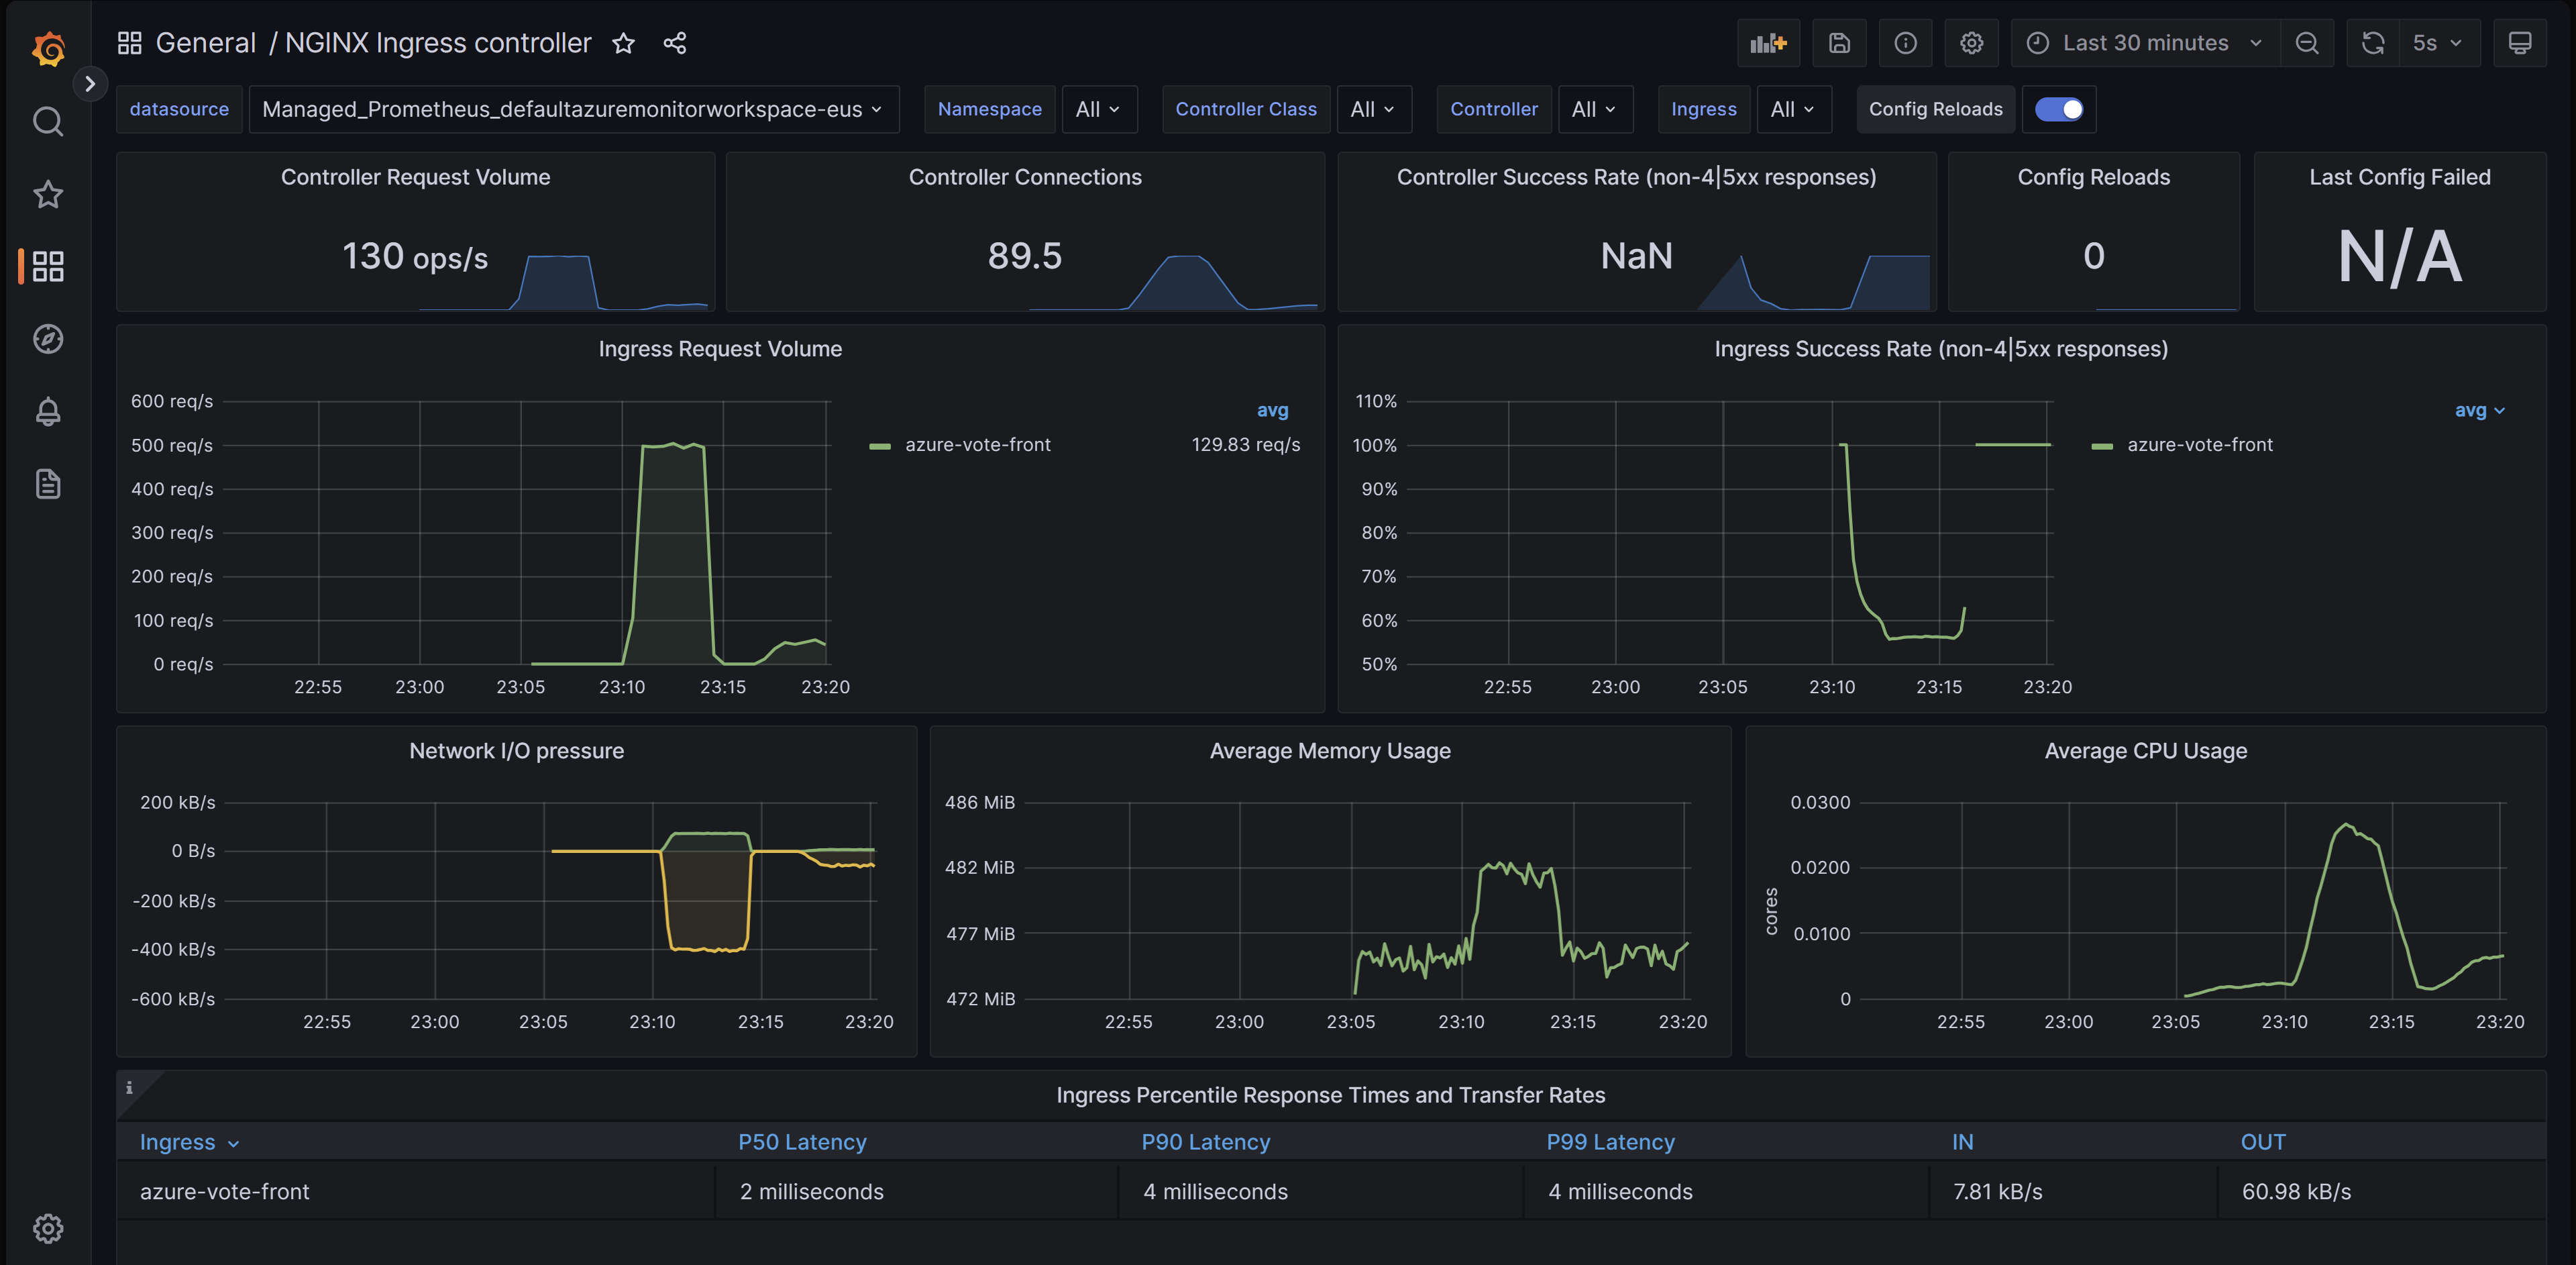
Ingress-nginx 控制器儀表板
此儀表板可讓您查看要求磁碟區、連線、成功率、設定重新載入和設定不同步。您也可以使用它來檢視輸入控制器的網路 IO 壓力、記憶體和 CPU 使用量。 最後,它還可以顯示輸入的 P50、P95 和 P99 百分位數回應時間及其輸送量。
您可以從 GitHub 下載此儀表板。
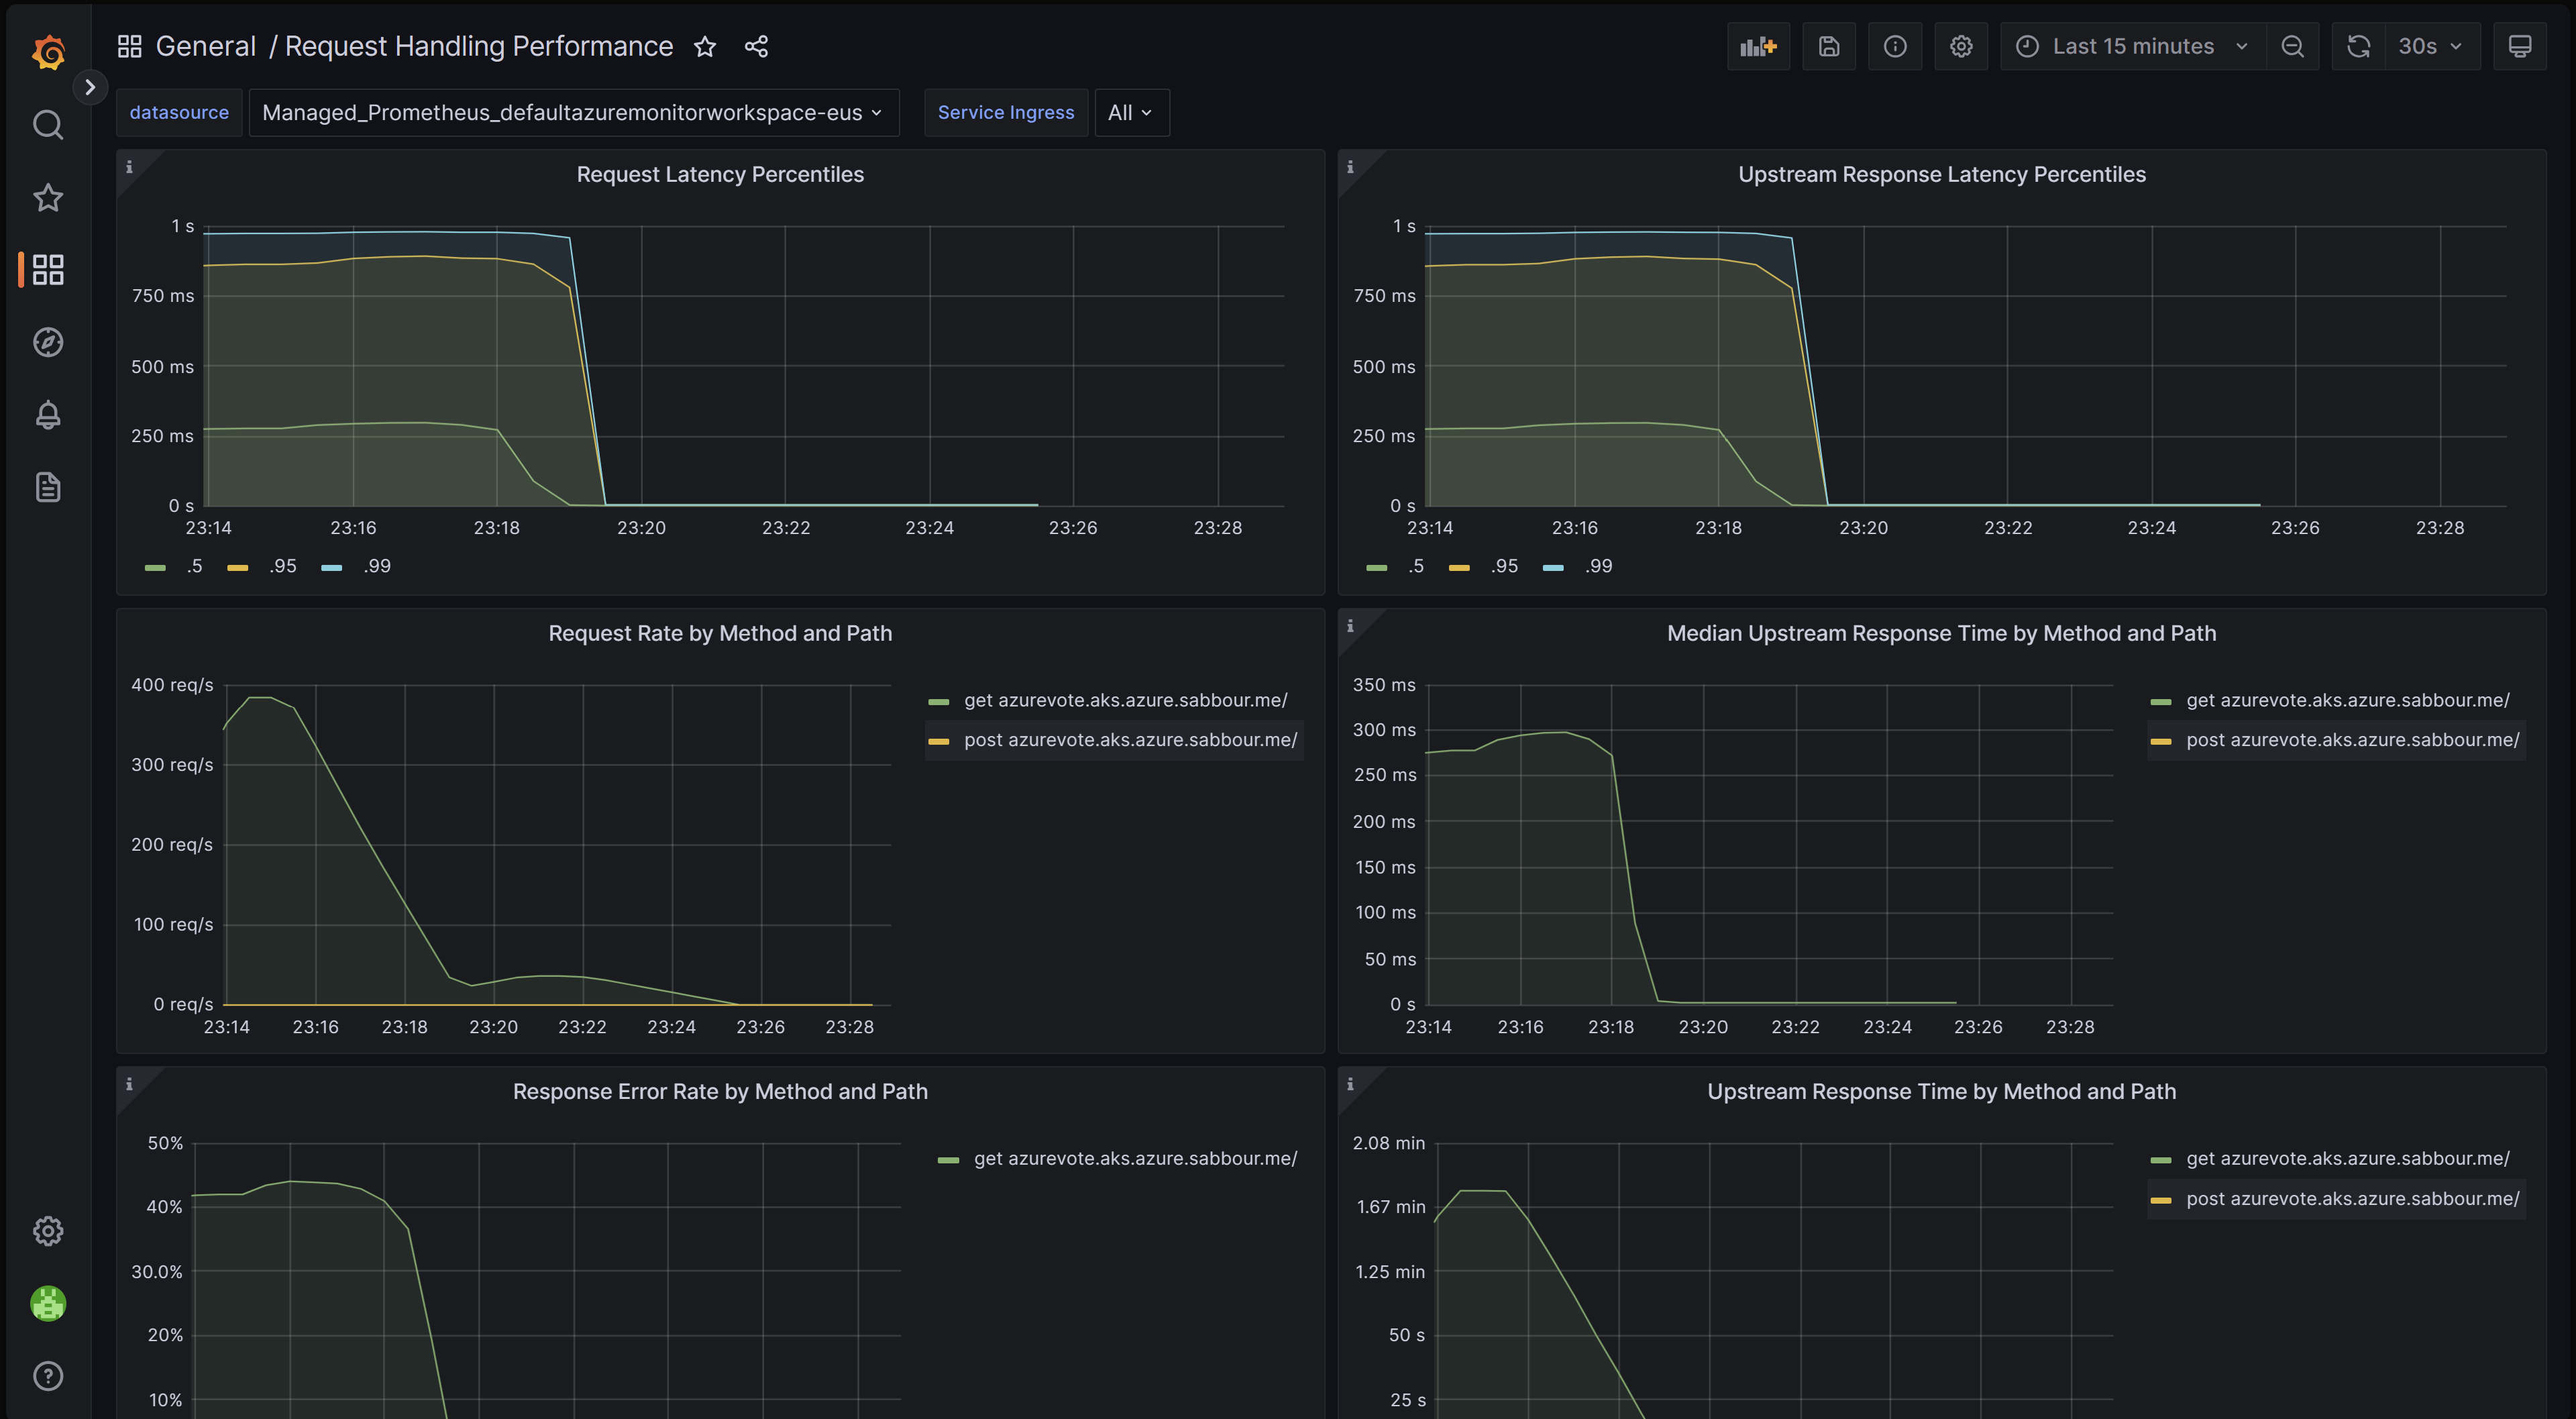
要求處理效能儀表板
此儀表板可讓您查看不同輸入上游目的地的要求處理效能,這是要接收輸入控制器流量轉送的應用程式端點。 它會顯示要求總計和上游回應時間的 P50、P95 和 P99 百分位數。 您也可以檢視要求錯誤和延遲的彙總。 使用此儀表板來檢閱及改善應用程式的效能和可擴縮性。
您可以從 GitHub 下載此儀表板。
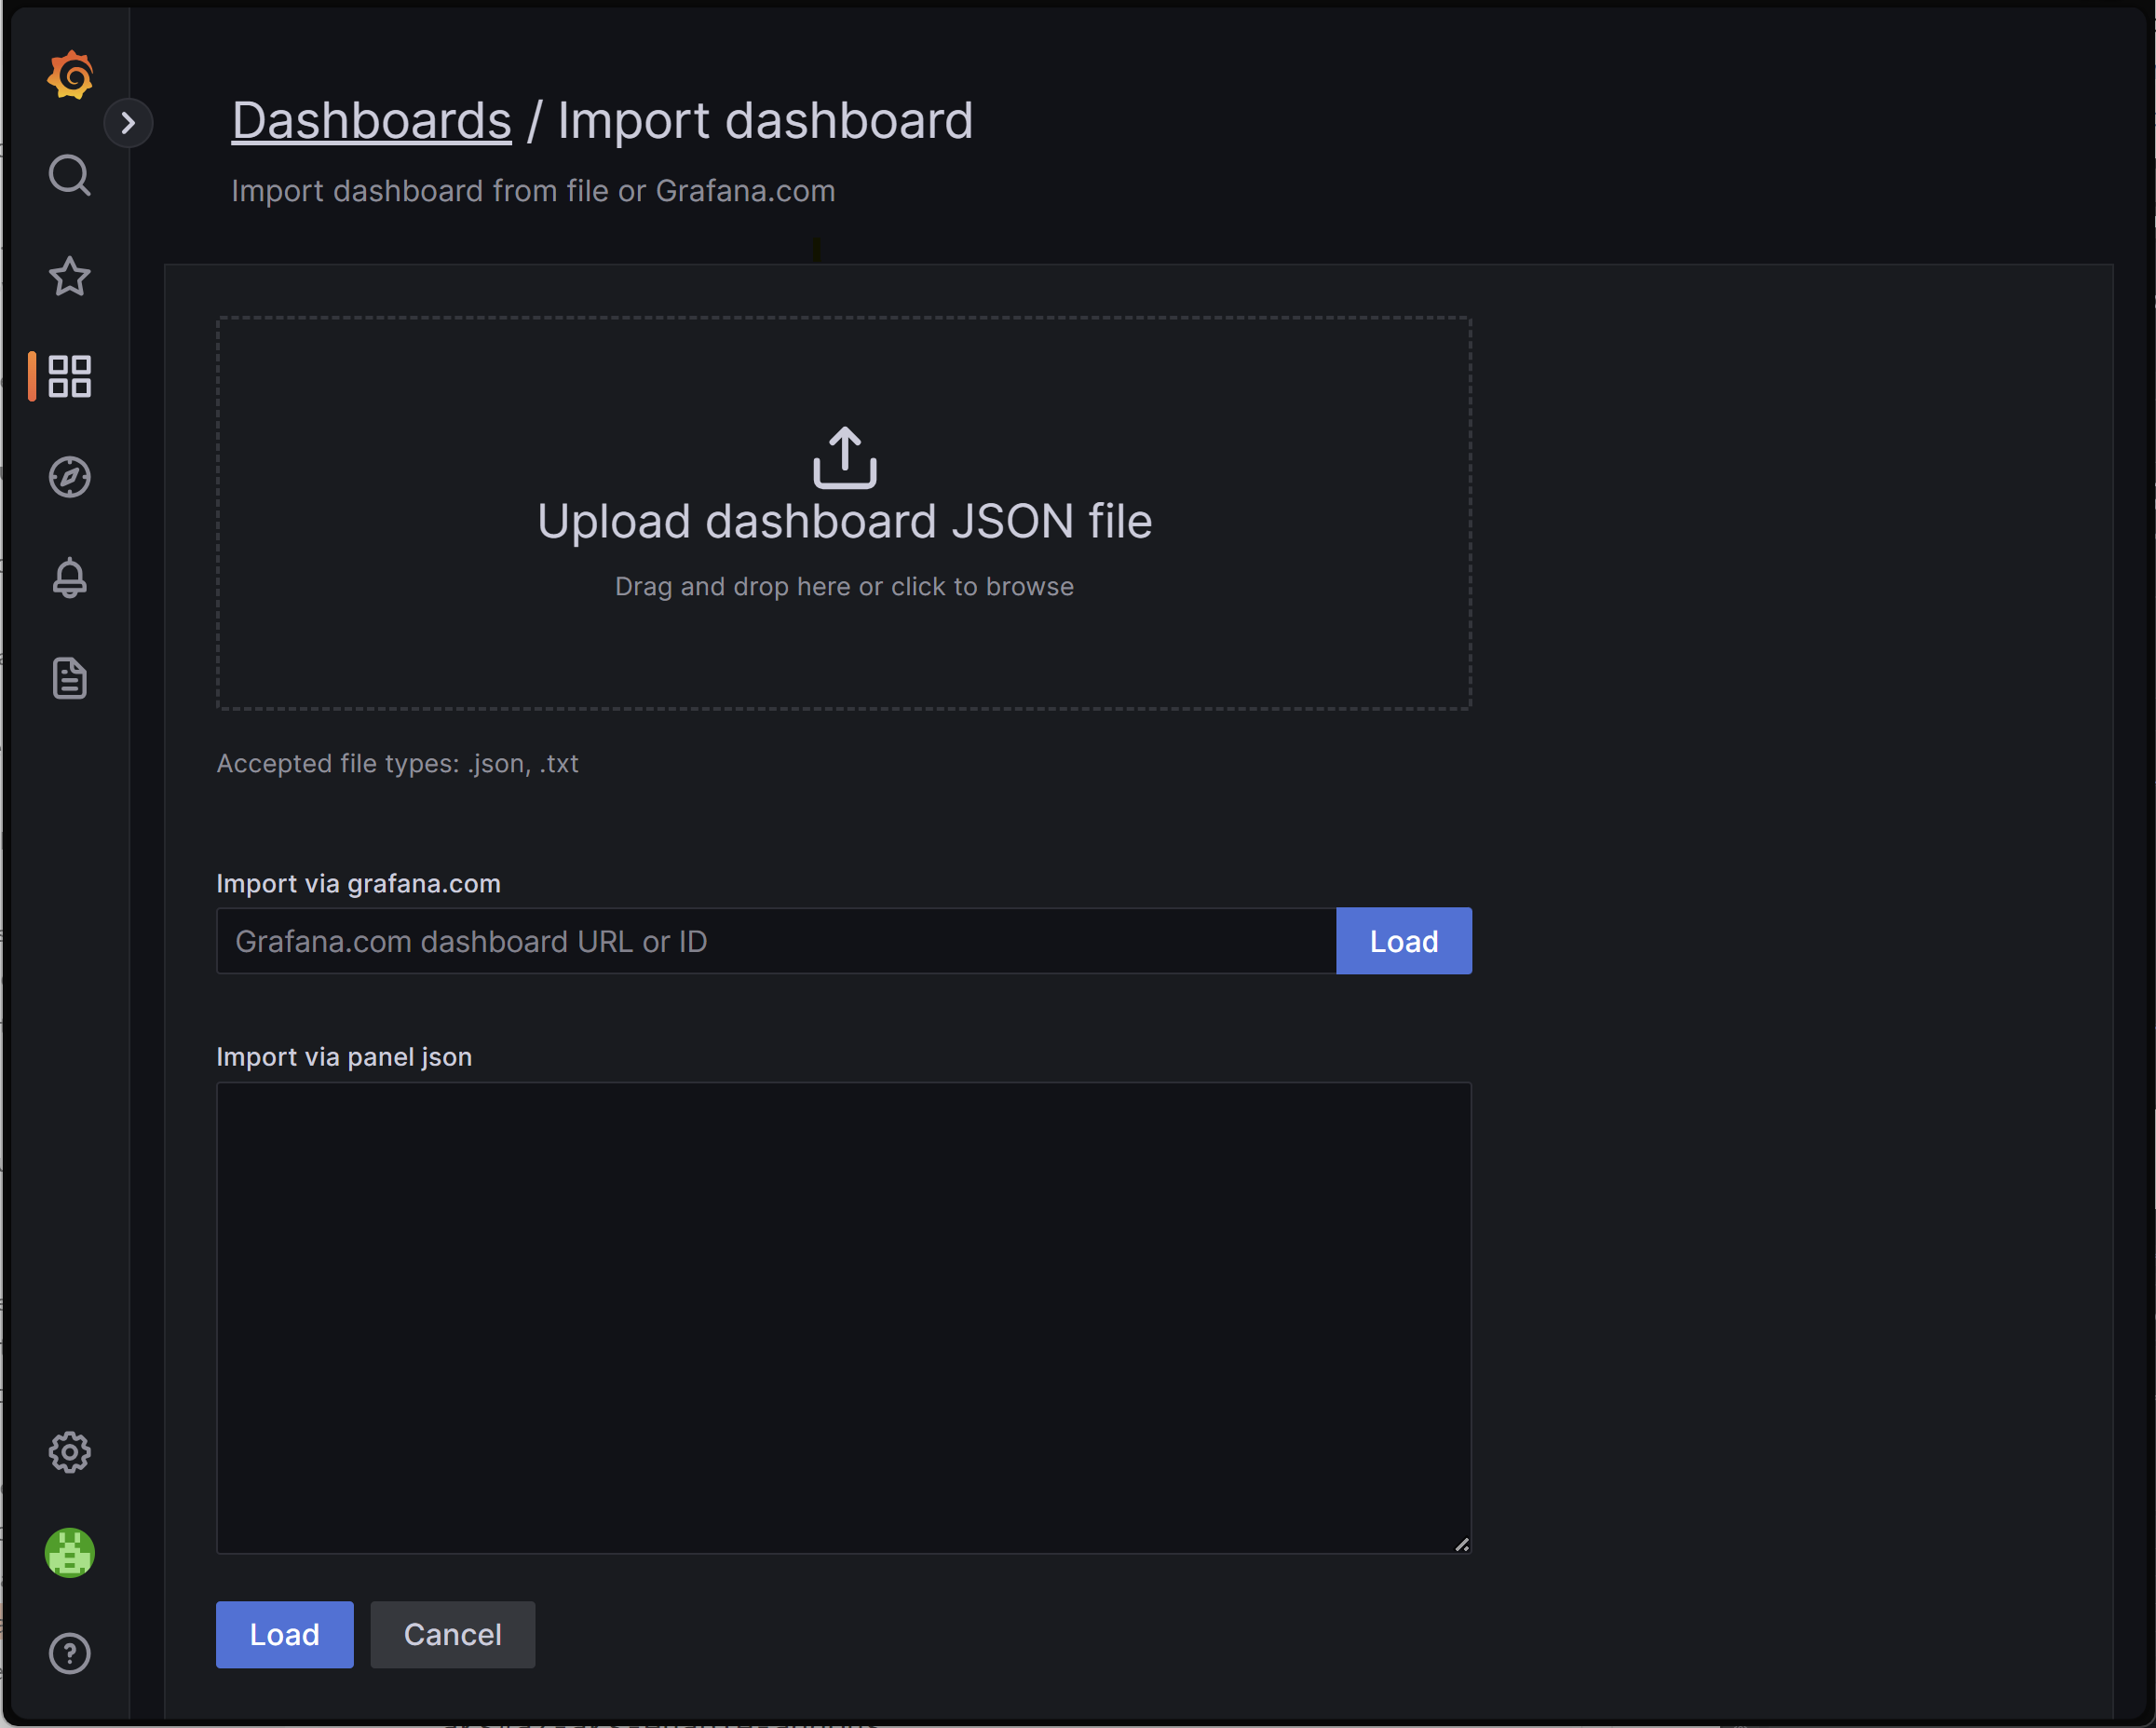
匯入儀表板
若要匯入 Grafana 儀表板,請展開左側功能表,然後按一下 [儀表板] 下方的 [匯入]。
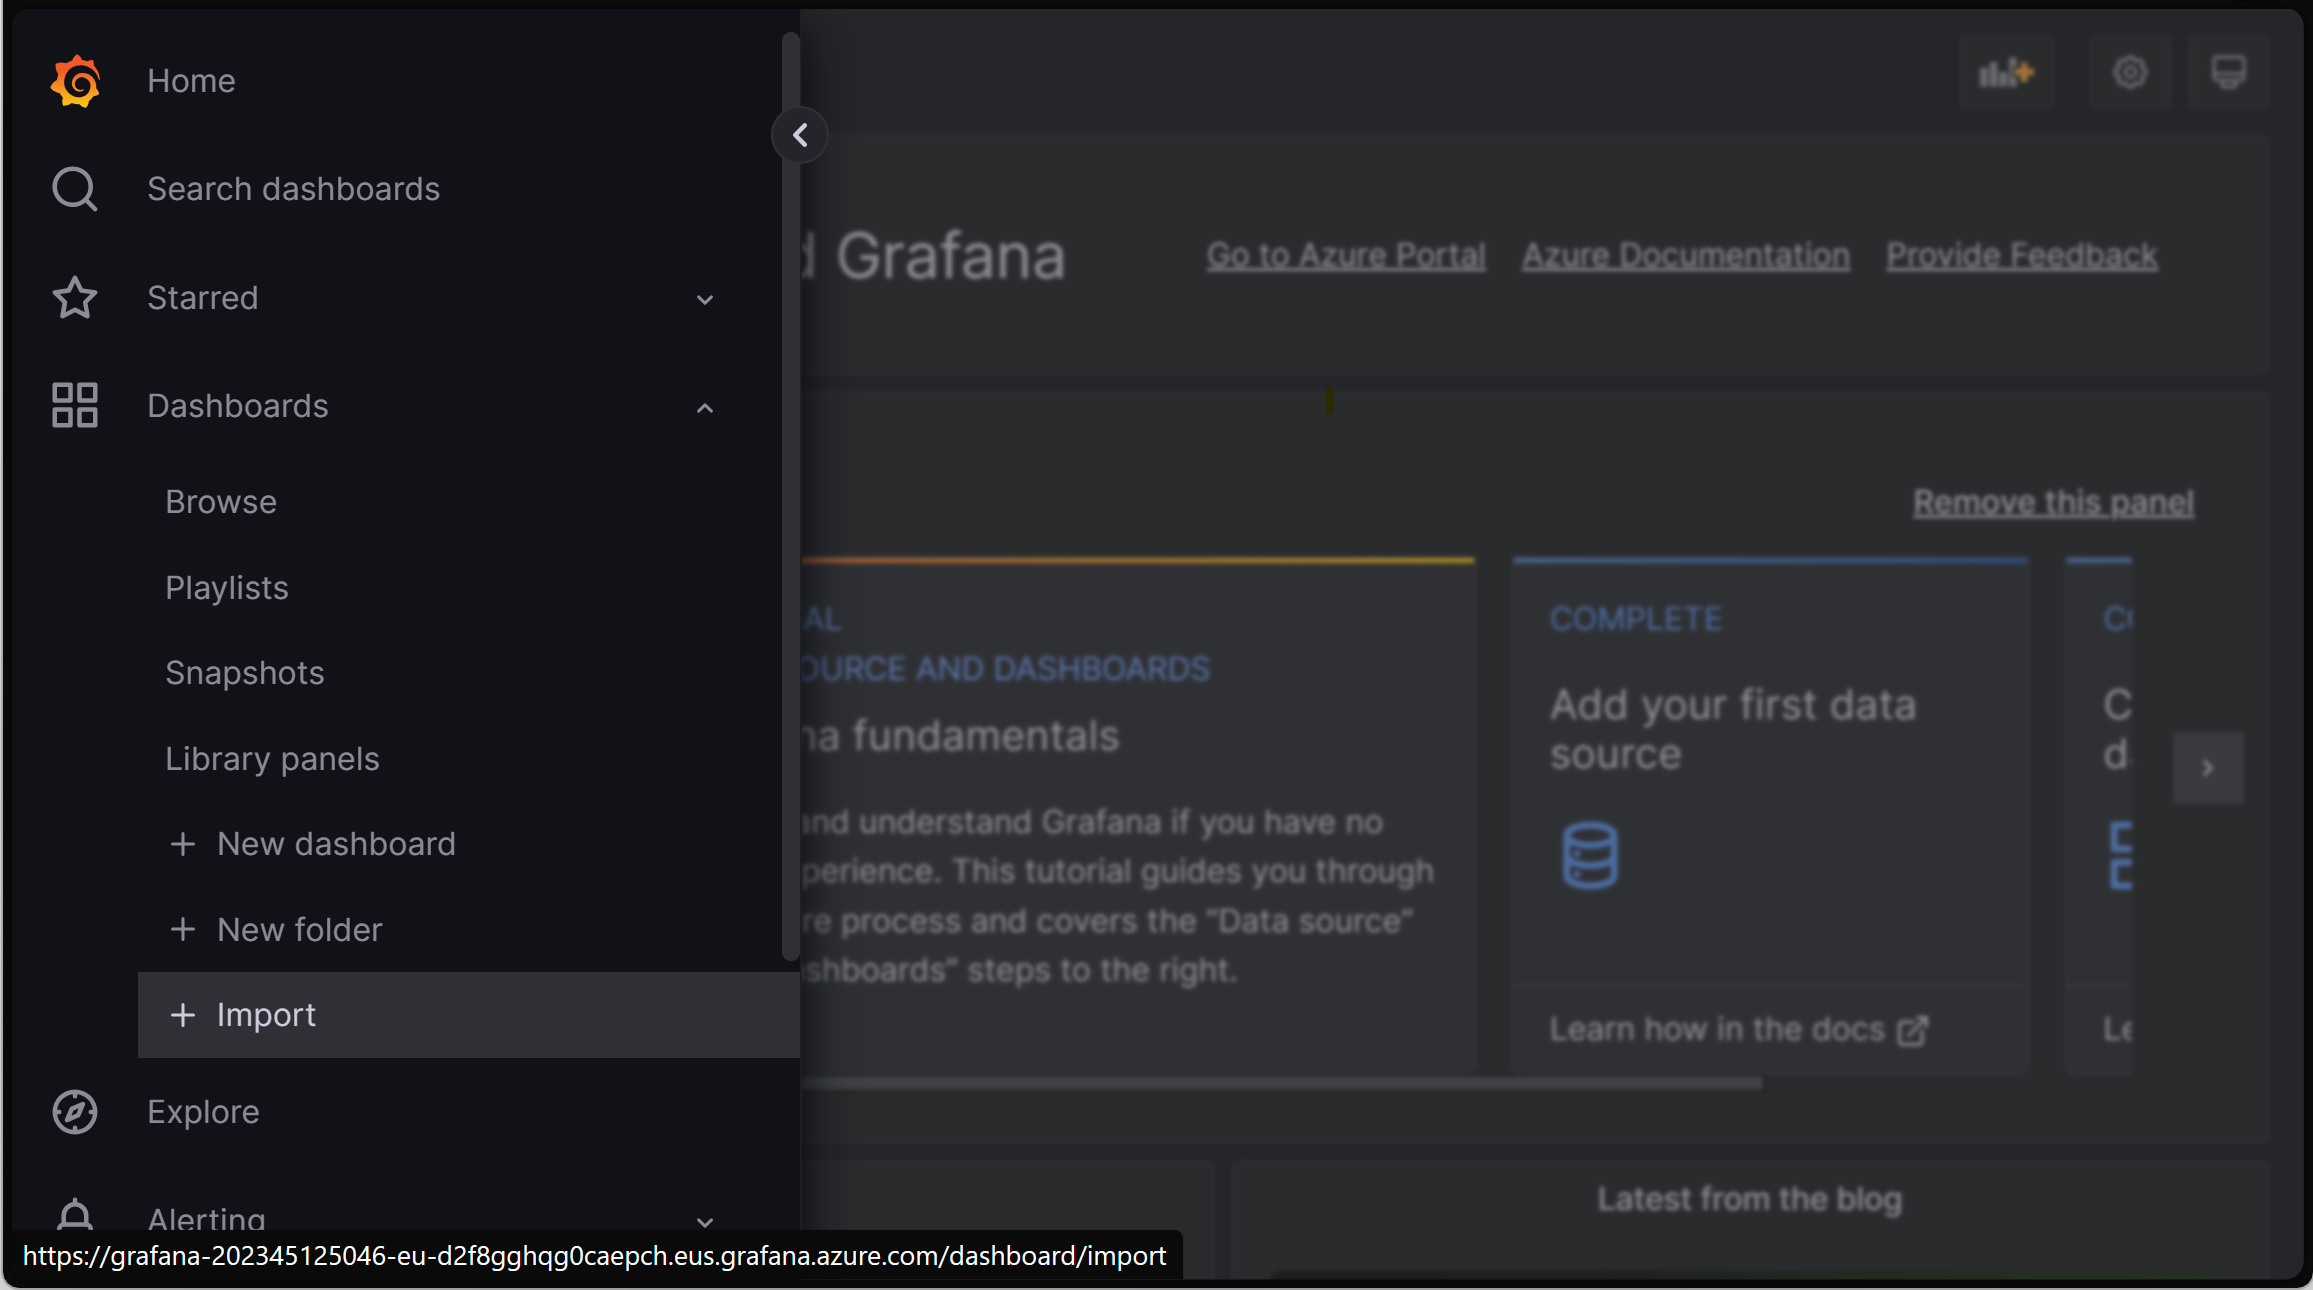
然後上傳所需的儀表板檔案,並按一下 [載入]。
下一步
- 您可以使用 Kubernetes 事件驅動自動調整程式 (KEDA) 並利用使用 Prometheus 所抓取的輸入計量來設定調整工作負載。 深入了解整合 KEDA 與 AKS。
- 使用 Azure 負載測試來建立和執行負載測試,以測試工作負載效能並最佳化應用程式的可擴縮性。