監視 GitOps (Flux v2) 狀態和活動
若要在已啟用 Azure Arc 的 Kubernetes 叢集或 Azure Kubernetes Service (AKS) 叢集中監視 GitOps 與 Flux v2 相關的狀態和活動,您有幾個選項:
- 使用 Azure 入口網站來監視個別叢集上的 Flux 組態和資源。
- 使用 Grafana 儀表板來監視部署和合規性狀態。
- 使用 Flux 控制平面和 Flux 叢集統計資料儀表板來監視資源使用量和對帳。
- 啟用 Prometheus 從叢集擷取,並使用 Azure 監視器工作區中的資料建立自己的儀表板。
- 使用透過 Prometheus 抓取所提供的資料,在 Azure 監視器上建立警示。
本主題描述監視 Flux 活動和狀態的一些方式。
在 Azure 入口網站中監視 Flux 設定
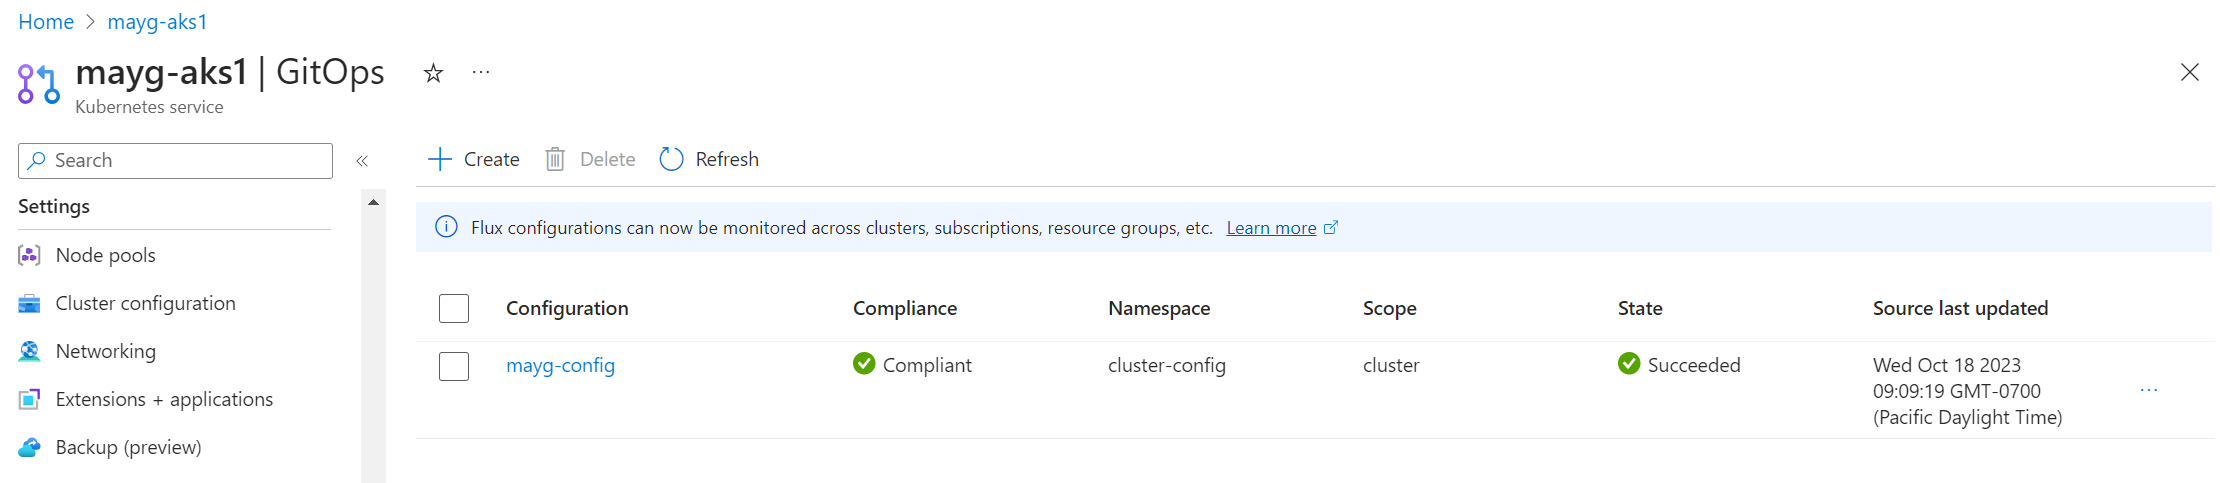
在叢集上建立 Flux 設定之後,您可以瀏覽至叢集並選取 GitOps,在 Azure 入口網站中檢視狀態資訊。
檢視叢集合規性和物件的詳細資料
[合規性] 狀態會顯示叢集的目前狀態是否符合所需的狀態。 可能的值:
- 符合規範:叢集的狀態符合所需的狀態。
- 擱置中:偵測到更新的所需狀態,但該狀態尚未在叢集上協調。
- 不符合規範:目前的狀態不符合所需的狀態。
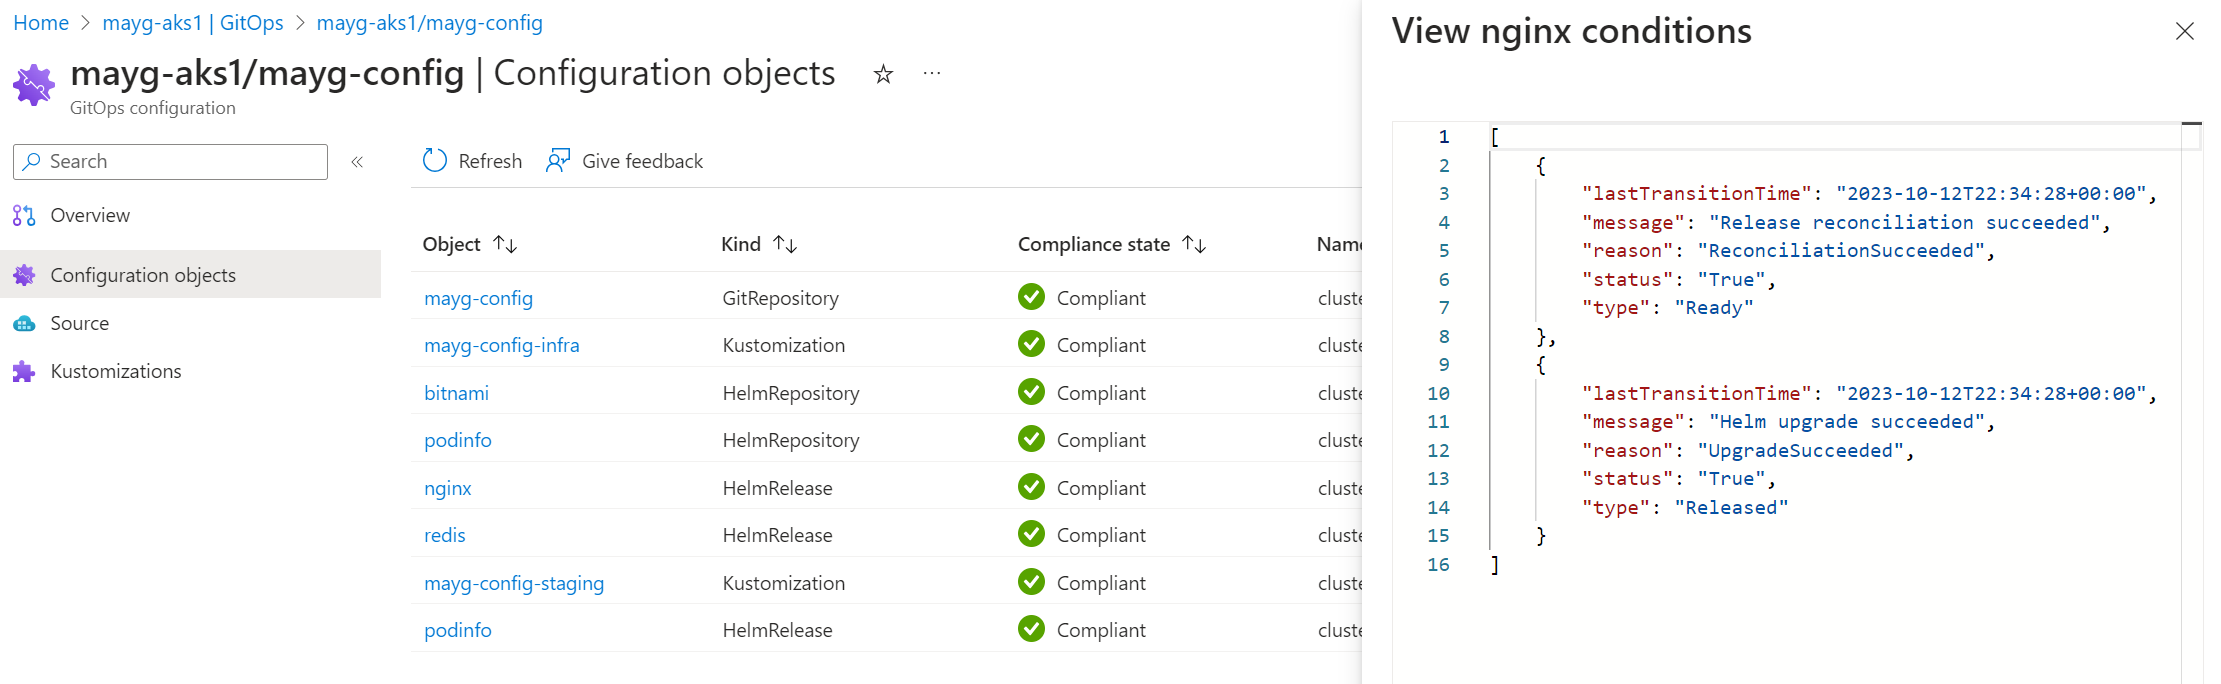
若要協助偵錯叢集的協調問題,請選取 [設定物件]。 在這裡,您可以檢視 Flux 為每個 Flux 設定建立的每個設定物件的記錄。 選取物件名稱以檢視其記錄檔。
若要檢視因套用 Flux 設定而建立的 Kubernetes 物件,請在叢集左側瀏覽窗格的 [Kubernetes 資源] 區段中選取 [工作負載]。 在這裡,您可以檢視叢集上已建立的任何資源的所有詳細資料。
依預設,您可以依命名空間和服務名稱進行篩選。 您也可以新增可在應用程式中使用的任何標籤篩選,以協助縮小搜尋範圍。
檢視 Flux 設定狀態和詳細資料
針對每個 Flux 設定,[狀態] 資料行會指出是否已成功在叢集上建立 Flux 設定物件。
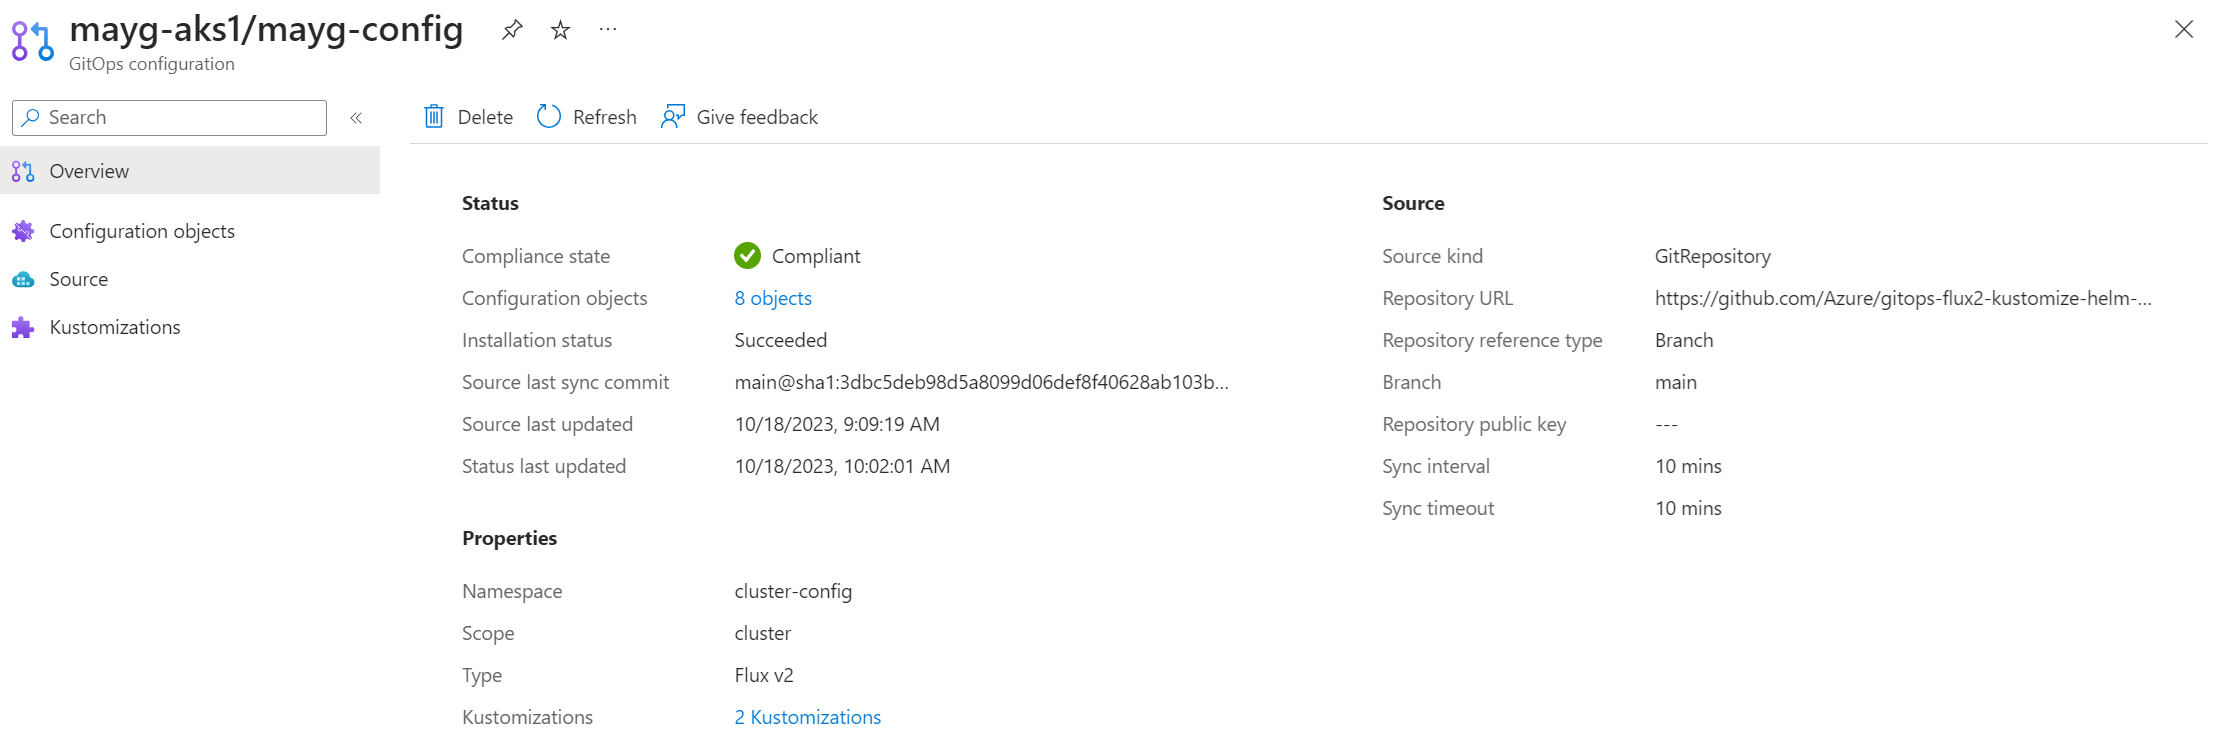
選取任何 Flux 設定以查看其 [概觀] 頁面,包括下列資訊:
- 上次同步的來源認可識別碼
- 最新來源更新的時間戳記
- 狀態更新時間戳記 (指出何時取得最新的統計資料)
- 存放庫 URL 和分支
- 檢視不同 Kustomization 的連結
使用儀表板來監視 GitOps 狀態和活動
我們提供儀表板,協助您監視 GitOps 搭配 Flux v2 的狀態、合規性、資源使用量和協調活動。 可以將這些 JSON 儀表板匯入 Grafana,以協助您即時檢視和分析資料。 您也可以設定此資訊的警示。
若要匯入和使用這些儀表板,您需要:
- 一或多個已啟用 Arc 的現有 Kubernetes 叢集或 AKS 叢集。
- 安裝在叢集上的 microsoft.flux 延伸模組。
- 至少在叢集上建立一個 Flux 設定。
監視部署和合規性狀態
遵循下列步驟來匯入儀表板,讓您監視跨叢集的 Flux 延伸模組部署和狀態,以及這些叢集上 Flux 設定的合規性狀態。
注意
這些步驟描述將儀表板匯入至 Azure 受控 Grafana 的程序。 您也可以將此儀表板匯入任何 Grafana 執行個體。 使用此選項時,必須使用服務主體;Azure 受控 Grafana 外部的資料連線不支援受控識別。
使用 Azure 入口網站或 Azure CLI 建立 Azure 受控 Grafana 執行個體。 在 [概觀] 頁面上選取其端點,以確保您可以存取 Grafana。 您至少需要 Grafana 編輯器層級權限,才能檢視和編輯儀表板。 您可以移至 Grafana 執行個體上的存取控制 (IAM) 來檢查您的存取權。
如果您使用 Azure 受控 Grafana 執行個體的受控識別,請遵循下列步驟,為其指派訂用帳戶上的監視讀取者角色:
- 在 Azure 入口網站中,瀏覽至您想要新增的訂用帳戶。
- 選取 [存取控制 (IAM)]。
- 選取 [新增角色指派]。
- 選取 [監視讀取者] 角色,然後選取 [下一步]。
- 在 [成員] 索引標籤上,選取 [受控識別],然後選擇 [選取成員]。
- 從 [受控識別] 清單,選取您建立 Azure 受控 Grafana 執行個體的訂用帳戶。 然後選取 [Azure 受控 Grafana] 和您的 Azure 受控 Grafana 執行個體的名稱。
- 選取 [檢閱 + 指派]。
如果您使用服務主體,請將監視讀取者角色授與您將用於資料來源連線的服務主體。 遵循這些相同的步驟,但在 [成員] 索引標籤中選取 [使用者、群組或服務主體],然後選取您的服務主體。 (如果您未使用 Azure 受控 Grafana,則必須使用服務主體進行資料連線存取。)
在您的 Azure 受控 Grafana 執行個體中建立 Azure 監視器資料來源連線。 此連線可讓儀表板存取 Azure Resource Graph 資料。
遵循步驟以將 JSON 儀表板匯入 Grafana。
匯入儀表板之後,它會顯示您正在監視的叢集資訊,並顯示數個提供詳細資料的面板。 如需項目的詳細資料,請選取連結以瀏覽 Azure 入口網站,您可以在其中找到設定、錯誤和記錄的詳細資訊。

Flux 延伸模組部署狀態資料表會列出所有叢集,其中已部署 Flux 延伸模組,以及目前的部署狀態。

Flux 設定合規性狀態資料表會列出叢集上建立的所有 Flux 設定,以及其合規性狀態。 若要查看 Helm 版本和 Kustomization 等設定物件的狀態和錯誤記錄,請從 ComplianceState 資料行選取 [不符合規範] 連結。

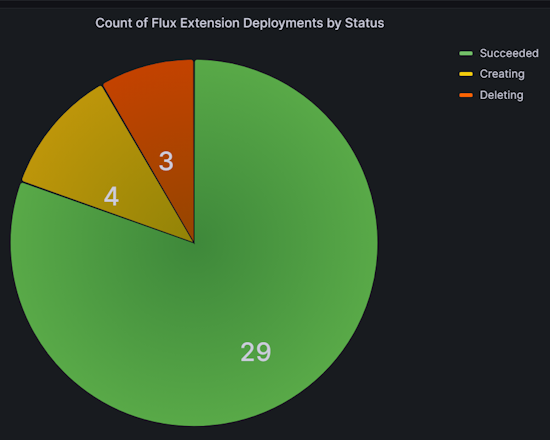
依狀態部署的 Flux 延伸模組計數圖表會根據叢集的佈建狀態顯示叢集計數。
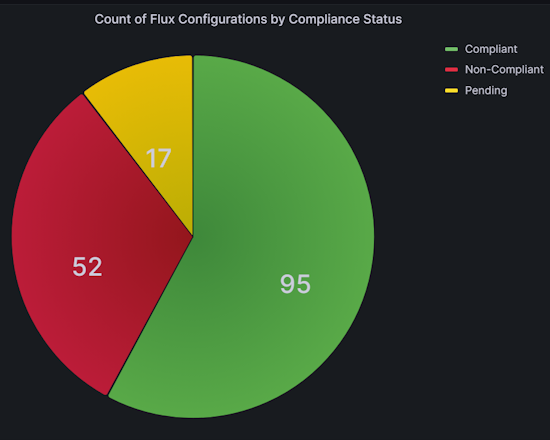
依合規性狀態設定的 Flux 設定計數圖表會根據與來源存放庫的合規性狀態,顯示 Flux 設定的計數。
篩選儀表板資料以追蹤應用程式部署
您可以在 [GitOps Flux - 應用程式部署儀表板] 中篩選資料,以變更顯示的資訊。 例如,您可以只顯示特定訂用帳戶或資源群組的資料,或將資料限制在特定叢集。 若要這樣做,請從最上層下拉式清單或資料表中的任何資料行標頭選取篩選選項。
例如,在 Flux 設定合規性狀態資料表中,您可以從 SourceLastSyncCommit 資料行選取特定認可。 如此一來,您就可以追蹤受該認可影響的所有叢集的設定部署狀態。
建立延伸模組和設定失敗的警示
如上一節所述匯入儀表板之後,您可以設定警示。 當 Flux 延伸模組或 Flux 設定發生失敗時,這些警示會通知您。
遵循下列步驟來建立警示。 提供範例查詢來偵測延伸模組佈建或延伸模組升級失敗,或偵測合規性狀態失敗。
在儀表板的左側導覽功能表中,選取 [警示]。
選取 [警示規則]。
選取 [+ 建立警示規則]。 新的警示規則頁面隨即開啟,預設會選取 [Grafana 受控警示] 選項。
在 [規則名稱] 中,新增描述性名稱。 此名稱會在警示規則清單中顯示,而且會作為從此規則建立的每個警示執行個體的
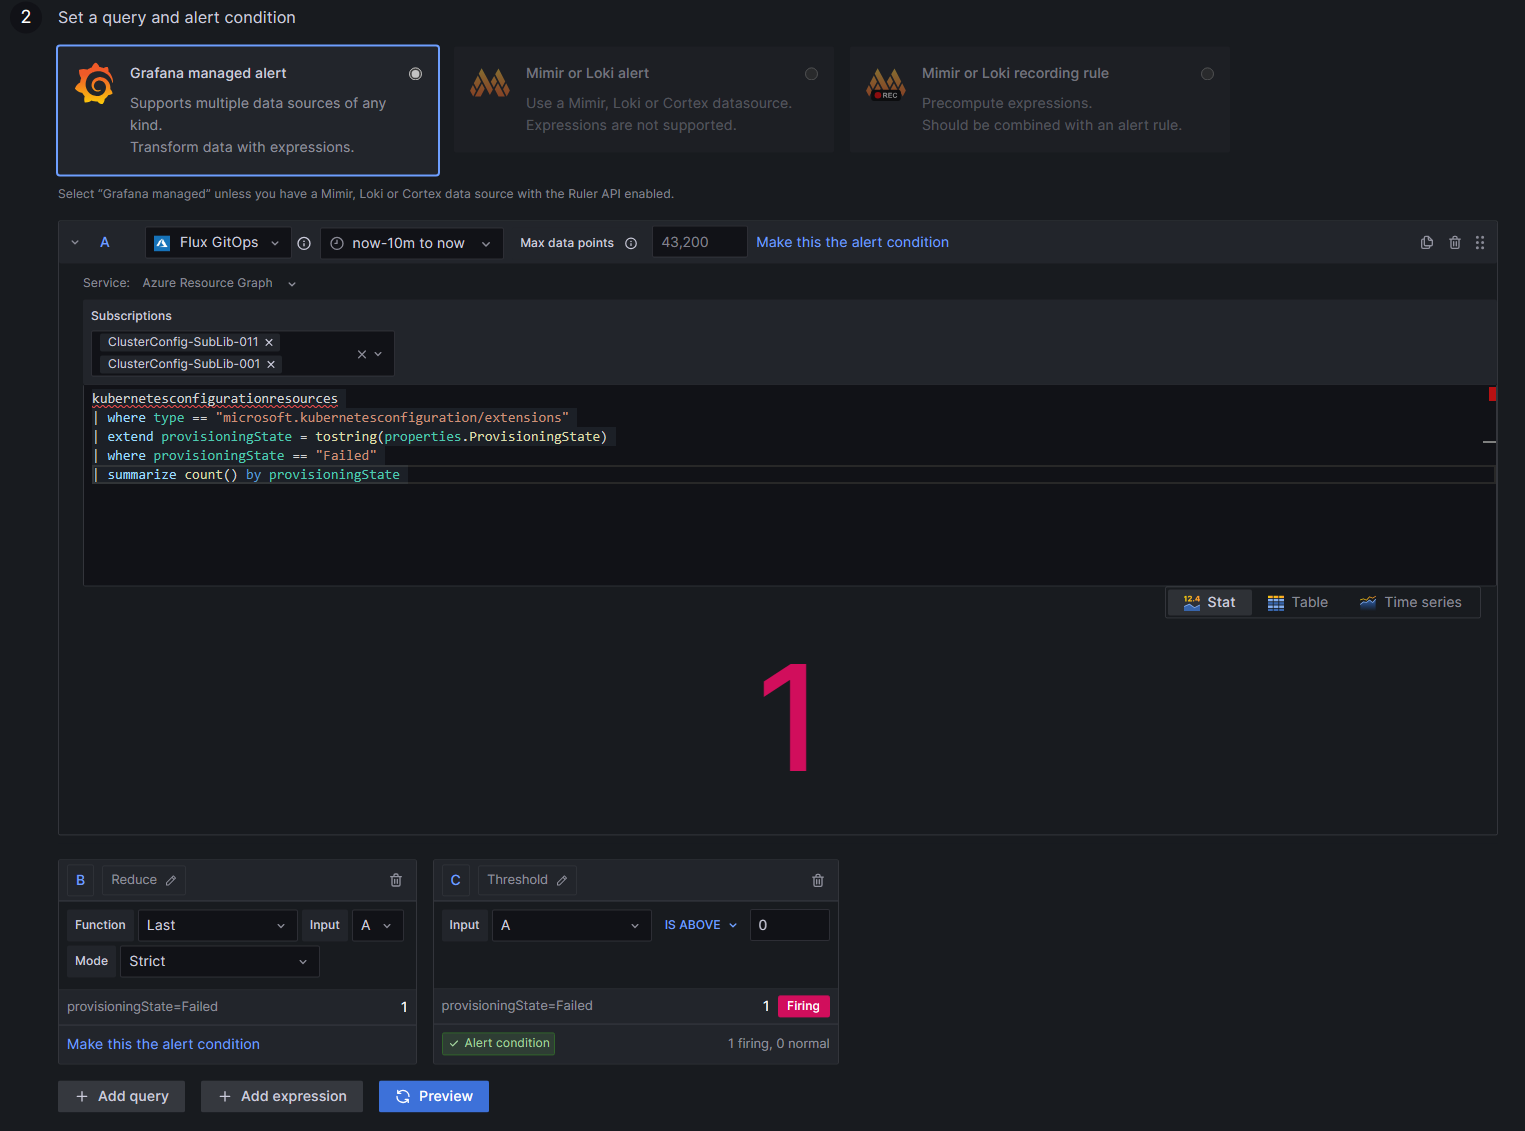
alertname標籤。在 [設定查詢和警示條件] 底下:
選取資料來源。 可以在這裡使用儀表板所使用的相同資料來源。
針對 [服務],選取 [Azure Resource Graph]。
從下拉式清單選取訂用帳戶。
輸入您要使用的查詢。 例如,針對延伸模組佈建或升級失敗,您可以輸入此查詢:
kubernetesconfigurationresources
| where type == "microsoft.kubernetesconfiguration/extensions"
| extend provisioningState = tostring(properties.ProvisioningState)
| where provisioningState == "Failed"
| summarize count() by provisioningState
或者,針對合規性狀態失敗,您可以輸入此查詢:
kubernetesconfigurationresources
| where type == "microsoft.kubernetesconfiguration/fluxconfigurations"
| extend complianceState=tostring(properties.complianceState)
| where complianceState == "Non-Compliant"
| summarize count() by complianceState
針對 [閾值] 方塊,針對輸入類型選取 A,並將閾值設定為 0 以接收警示,即使叢集上只有一個延伸模組失敗亦然。 將此標示為 [警示條件]。
指定警示評估間隔:
- 針對 [條件],選取要觸發警示規則的查詢或運算式。
- 針對 [評估間隔],以 10 秒的倍數輸入評估頻率。
- 針對 [評估期間],指定在建立警示之前,條件必須成立多久的時間。
- 在 [設定沒有資料和錯誤處理] 中,指出當警示規則傳回任何資料或傳回錯誤時,應該發生什麼動作。
- 若要檢查執行查詢的結果,請選取 [預覽]。
新增儲存體位置、規則群組,以及您想要與規則建立關聯的任何其他中繼資料。
- 針對 [資料夾],選取應儲存規則的資料夾。
- 針對 [群組],指定預先定義的群組。
- 如有需要,請新增描述和摘要來自訂警示訊息。
- 視需要新增 Runbook URL、面板、儀表板和警示識別碼。
如有需要,請新增任何自訂標籤。 然後選取儲存。

監視資源使用量和協調
遵循下列步驟來匯入儀表板,讓您監視 Flux 資源使用量、協調、API 要求和協調器狀態。
遵循步驟來建立 Azure 監視器工作區。
使用 Azure 入口網站或 Azure CLI 建立 Azure 受控 Grafana 執行個體。
在您想要監視的 AKS 叢集和/或已啟用 Arc 的 Kubernetes 叢集上啟用 Prometheus 計量集合。
藉由建立 configmap,設定 Azure 監視器代理程式以抓取 Azure 受控 Flux 計量:
kind: ConfigMap
apiVersion: v1
data:
  schema-version:
      #string.used by agent to parse config. supported versions are {v1}. Configs with other schema versions will be rejected by the agent.
    v1
  config-version:
    #string.used by customer to keep track of this config file's version in their source control/repository (max allowed 10 chars, other chars will be truncated)
    ver1
  default-scrape-settings-enabled: |-
    kubelet = true
    coredns = false
    cadvisor = true
    kubeproxy = false
    apiserver = false
    kubestate = true
    nodeexporter = true
    windowsexporter = false
    windowskubeproxy = false
    kappiebasic = true
    prometheuscollectorhealth = false
  # Regex for which namespaces to scrape through pod annotation based scraping.
  # This is none by default. Use '.*' to scrape all namespaces of annotated pods.
  pod-annotation-based-scraping: |-
    podannotationnamespaceregex = "flux-system"
  default-targets-scrape-interval-settings: |-
    kubelet = "30s"
    coredns = "30s"
    cadvisor = "30s"
    kubeproxy = "30s"
    apiserver = "30s"
    kubestate = "30s"
    nodeexporter = "30s"
    windowsexporter = "30s"
    windowskubeproxy = "30s"
    kappiebasic = "30s"
    prometheuscollectorhealth = "30s"
    podannotations = "30s"
metadata:
  name: ama-metrics-settings-configmap
  namespace: kube-system
下載 Flux 控制平面和 Flux 叢集統計資料儀表板。
將受控 Prometheus 工作區連結至受控 Grafana 執行個體。 這需要幾分鐘的時間來完成。
遵循步驟以將這些 JSON 儀表板匯入 Grafana。
匯入儀表板之後,它們會顯示您正在監視的叢集資訊。 若要只顯示特定叢集或命名空間的資訊,請使用每個儀表板頂端附近的篩選。
Flux 控制平面儀表板會顯示狀態資源使用量、叢集層級的協調,以及 Kubernetes API 要求的詳細資料。

[Flux 叢集統計資料] 儀表板會顯示協調器數目,以及每個協調器的狀態和執行持續時間的詳細資料。

建立資源使用量和協調問題的警示
如上一節所述匯入儀表板之後,您可以設定警示。 這些警示會通知您可能需要注意的資源使用量和協調問題。
若要啟用這些警示,您可以部署類似此處所示的 Bicep 範本。 此範本中的警示規則是可視需要修改的範例。
下載 Bicep 範本並進行變更之後,請遵循這些步驟來部署範本。
param azureMonitorWorkspaceName string
param alertReceiverEmailAddress string

param kustomizationLookbackPeriodInMinutes int = 5
param helmReleaseLookbackPeriodInMinutes int = 5
param gitRepositoryLookbackPeriodInMinutes int = 5
param bucketLookbackPeriodInMinutes int = 5
param helmRepoLookbackPeriodInMinutes int = 5
param timeToResolveAlerts string = 'PT10M'
param location string = resourceGroup().location

resource azureMonitorWorkspace 'Microsoft.Monitor/accounts@2023-04-03' = {
  name: azureMonitorWorkspaceName
  location: location
}

resource fluxRuleActionGroup 'Microsoft.Insights/actionGroups@2023-01-01' = {
  name: 'fluxRuleActionGroup'
  location: 'global'
  properties: {
    enabled: true
    groupShortName: 'fluxGroup'
    emailReceivers: [
      {
        name: 'emailReceiver'
        emailAddress: alertReceiverEmailAddress
      }
    ]
  }
}

resource fluxRuleGroup 'Microsoft.AlertsManagement/prometheusRuleGroups@2023-03-01' = {
  name: 'fluxRuleGroup'
  location: location
  properties: {
    description: 'Flux Prometheus Rule Group'
    scopes: [
      azureMonitorWorkspace.id
    ]
    enabled: true
    interval: 'PT1M'
    rules: [
      {
        alert: 'KustomizationNotReady'
        expression: 'sum by (cluster, namespace, name) (gotk_reconcile_condition{type="Ready", status="False", kind="Kustomization"}) > 0'
        for: 'PT${kustomizationLookbackPeriodInMinutes}M'
        labels: {
          description: 'Kustomization reconciliation failing for last ${kustomizationLookbackPeriodInMinutes} minutes.'
        }
        annotations: {
          description: 'Kustomization reconciliation failing for last ${kustomizationLookbackPeriodInMinutes} minutes.'
        }
        enabled: true
        severity: 3
        resolveConfiguration: {
          autoResolved: true
          timeToResolve: timeToResolveAlerts
        }
        actions: [
          {
            actionGroupId: fluxRuleActionGroup.id
          }
        ]
      }
      {
        alert: 'HelmReleaseNotReady'
        expression: 'sum by (cluster, namespace, name) (gotk_reconcile_condition{type="Ready", status="False", kind="HelmRelease"}) > 0'
        for: 'PT${helmReleaseLookbackPeriodInMinutes}M'
        labels: {
          description: 'HelmRelease reconciliation failing for last ${helmReleaseLookbackPeriodInMinutes} minutes.'
        }
        annotations: {
          description: 'HelmRelease reconciliation failing for last ${helmReleaseLookbackPeriodInMinutes} minutes.'
        }
        enabled: true
        severity: 3
        resolveConfiguration: {
          autoResolved: true
          timeToResolve: timeToResolveAlerts
        }
        actions: [
          {
            actionGroupId: fluxRuleActionGroup.id
          }
        ]
      }
      {
        alert: 'GitRepositoryNotReady'
        expression: 'sum by (cluster, namespace, name) (gotk_reconcile_condition{type="Ready", status="False", kind="GitRepository"}) > 0'
        for: 'PT${gitRepositoryLookbackPeriodInMinutes}M'
        labels: {
          description: 'GitRepository reconciliation failing for last ${gitRepositoryLookbackPeriodInMinutes} minutes.'
        }
        annotations: {
          description: 'GitRepository reconciliation failing for last ${gitRepositoryLookbackPeriodInMinutes} minutes.'
        }
        enabled: true
        severity: 3
        resolveConfiguration: {
          autoResolved: true
          timeToResolve: timeToResolveAlerts
        }
        actions: [
          {
            actionGroupId: fluxRuleActionGroup.id
          }
        ]
      }
      {
        alert: 'BucketNotReady'
        expression: 'sum by (cluster, namespace, name) (gotk_reconcile_condition{type="Ready", status="False", kind="Bucket"}) > 0'
        for: 'PT${bucketLookbackPeriodInMinutes}M'
        labels: {
          description: 'Bucket reconciliation failing for last ${bucketLookbackPeriodInMinutes} minutes.'
        }
        annotations: {
          description: 'Bucket reconciliation failing for last ${bucketLookbackPeriodInMinutes} minutes.'
        }
        enabled: true
        severity: 3
        resolveConfiguration: {
          autoResolved: true
          timeToResolve: timeToResolveAlerts
        }
        actions: [
          {
            actionGroupId: fluxRuleActionGroup.id
          }
        ]
      }
      {
        alert: 'HelmRepositoryNotReady'
        expression: 'sum by (cluster, namespace, name) (gotk_reconcile_condition{type="Ready", status="False", kind="HelmRepository"}) > 0'
        for: 'PT${helmRepoLookbackPeriodInMinutes}M'
        labels: {
          description: 'HelmRepository reconciliation failing for last ${helmRepoLookbackPeriodInMinutes} minutes.'
        }
        annotations: {
          description: 'HelmRepository reconciliation failing for last ${helmRepoLookbackPeriodInMinutes} minutes.'
        }
        enabled: true
        severity: 3
        resolveConfiguration: {
          autoResolved: true
          timeToResolve: timeToResolveAlerts
        }
        actions: [
          {
            actionGroupId: fluxRuleActionGroup.id
          }
        ]
      }
    ]
  }
}
下一步
- 檢閱使用 GitOps 搭配 Flux v2 來管理設定和應用程式部署的教學課程。
- 了解 Azure 監視器容器深入解析。