教學課程:使用適用於 MySQL 的 Azure 資料庫 - 彈性伺服器設定稽核記錄
適用於: 適用於 MySQL 的 Azure 資料庫 - 彈性伺服器
您可以使用適用於 MySQL 的 Azure 資料庫彈性伺服器來設定稽核記錄。 稽核記錄可用來追蹤資料庫層級活動,包括連線、管理、資料定義語言 (Data Definition Language,DDL) 及資料操作語言 (DML) 事件。 這些記錄類型通常用於合規性用途。 您通常會使用資料庫稽核:
- 考慮在特定結構描述、資料表或資料列內發生的所有動作,或者影響特定內容的所有動作。
- 防止使用者 (或其他人) 根據其責任採取不適當的動作。
- 調查可疑的活動。
- 監視並收集特定資料庫活動的相關資料。
此文章討論如何使用 MySQL 稽核記錄、Log Analytics 工具或活頁簿範本,將適用於 MySQL 的 Azure 資料庫彈性伺服器的稽核資訊視覺化。
在本教學課程中,您將了解如何:
- 使用 Azure 入口網站或 Azure CLI 設定稽核
- 設定診斷記錄
- 使用 Log Analytics 檢視稽核記錄
- 使用活頁簿檢視稽核記錄
必要條件
使用 Azure 入口網站設定稽核
登入 Azure 入口網站。
選取彈性伺服器執行個體。
在左側窗格的 [設定] 下方,選取 [伺服器參數]。

針對 audit_log_enabled 參數,選取 [ON]。

針對 audit_log_events 參數,在下拉式清單中,選取要記錄事件類型。

針對 audit_log_exclude_users 和 audit_log_include_users 參數,透過提供 MySQL 使用者名稱,來指定要在記錄中包含或排除的任何 MySQL 使用者。

選取 [儲存]。

使用 Azure CLI 設定稽核
或者,您可以執行下列命令,從 Azure CLI 為您的彈性伺服器啟用和設定稽核:
# Enable audit logs
az mysql flexible-server parameter set \
--name audit_log_enabled \
--resource-group myresourcegroup \
--server-name mydemoserver \
--value ON
設定診斷記錄
稽核記錄會與 Azure 監視器診斷設定整合,可讓您將記錄管線傳送至三個資料接收器的任一個:
- Log Analytics 工作區
- 事件中樞
- 儲存體帳戶
注意
您應該先建立資料接收器,然後再設定診斷設定。 您可以在已設定的資料接收器中存取稽核記錄。 最多可能需要 10 分鐘,記錄才會顯示。
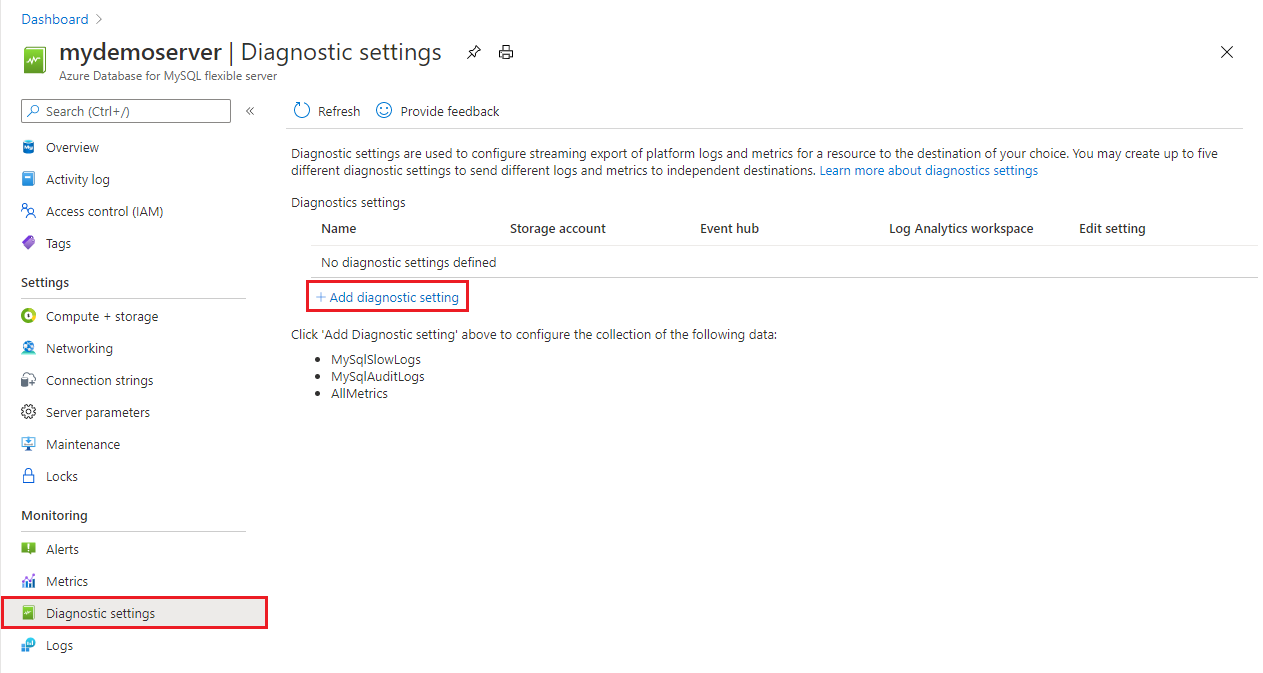
在左側窗格的 [監視] 下方,選取 [診斷設定]。
在 [診斷設定] 窗格上,選取 [新增診斷設定]。
在 [名稱] 方塊中,輸入診斷設定的名稱。

透過選取目的地對應的核取方塊,來指定要將稽核記錄傳送到哪些目的地 (Log Analytics 工作區、事件中樞或儲存體帳戶)。
注意
在此教學課程中,您會將稽核記錄傳送至 Log Analytics 工作區。
在 [記錄] 下方,針對記錄類型,選取 [MySqlAuditLogs] 核取方塊。
當您設定將稽核記錄管線輸送至資料接收器之後,選取 [儲存]。
使用 Log Analytics 檢視稽核記錄
在 Log Analytics 左側窗格的 [監視] 下方,選取 [記錄]。
關閉 [查詢] 視窗。

在查詢視窗中,您可以撰寫要執行的查詢。 例如,為了尋找特定伺服器上稽核事件的摘要,我們使用了下列查詢:
AzureDiagnostics
    |where Category =='MySqlAuditLogs'
    |project TimeGenerated, Resource, event_class_s, event_subclass_s, event_time_t, user_s ,ip_s , sql_text_s
    |summarize count() by event_class_s,event_subclass_s
    |order by event_class_s
使用活頁簿檢視稽核記錄
您用於稽核的活頁簿範本需要您建立診斷設定來傳送平台記錄。
在 Azure 監視器的左側窗格中,選取 [活動記錄],然後選取 [診斷設定]。

在 [診斷設定] 窗格中,您可以新增設定或編輯現有設定。 每個設定的每種目的地類型都只能有一個。

注意
您可以在已設定的資料接收器 (Log Analytics 工作區、儲存體帳戶或事件中樞) 存取慢速查詢記錄。 最多可能需要 10 分鐘,記錄才會顯示。
在 Azure 入口網站的左側窗格中,在適用於 MySQL 的 Azure 資料庫彈性伺服器執行個體的 [監視] 下方,選取 [活頁簿]。
選取 [稽核] 活頁簿。

在活頁簿中,您可以檢視下列視覺效果:
- 對服務的管理動作
- 稽核摘要
- 稽核連線事件摘要
- 稽核連線事件
- 資料表存取摘要
- 發現的錯誤


注意
- 您也可以編輯這些範本,並根據自己的需求進行自訂。 如需詳細資訊,請參閱 Azure 活頁簿的〈編輯模式〉一節。
- 如需快速檢視,您也可以將活頁簿或 Log Analytics 查詢釘選到儀表板。 如需詳細資訊,請參閱在 Azure 入口網站中建立儀表板。
[對服務的系統管理動作] 檢視會為您提供在服務上執行之活動的詳細資料。 其有助於決定在您訂用帳戶的資源上執行之任何寫入作業 (PUT、POST、DELETE) 的「內容、人員及時機」。
您可以使用其他視覺效果來協助您了解資料庫活動的詳細資料。 資料庫安全性有四個部分:
- 伺服器安全性:負責防止未經授權的人員存取資料庫。
- 資料庫連線:管理員應該檢查是否已由授權人員執行任何資料庫更新。
- 資料表存取控制:顯示已獲授權使用者的存取金鑰,以及每個資料庫內哪些資料表已獲授權來處理。
- 資料庫存取限制:對於已將資料庫上傳至網際網路的人員特別重要,並可協助防止外部來源存取您的資料庫。
下一步
- 深入了解 Azure 監視器活頁簿及其豐富的視覺效果選項。
- 深入了解稽核記錄。