在 Visual Studio 中閱讀及了解 C++ 程式碼
C++ 程式碼編輯器和 Visual Studio IDE 提供許多程式碼撰寫的輔助工具。 有些是 C++ 獨有,有些則基本上對所有 Visual Studio 語言都相同。 如需編輯器的詳細資訊,請參閱在程式碼和文字編輯器中撰寫程式碼。
顏色標示
Visual Studio 會以顏色標示語法元素來區別符號類型,例如語言關鍵字、類型名稱、變數名稱、函式參數、字串常值等等。

未使用程式碼 (例如 #if 0 底下的程式碼) 的顏色較淡。

您可以在 [快速啟動] 中鍵入「字型」,然後選擇 [字型和色彩] 來自訂色彩。 在 [ 字型和色彩 ] 對話框中,向下捲動至 C/C++ 選項,然後選擇自定義字型和/或色彩。
大綱
以滑鼠右鍵按單擊原始碼檔案中的任何位置,然後選擇 [ 大綱 ] 來折疊或展開程式碼區塊和/或自定義區域,讓您更輕鬆地只流覽您感興趣的程序代碼。 如需詳細資訊,請參閱大綱。
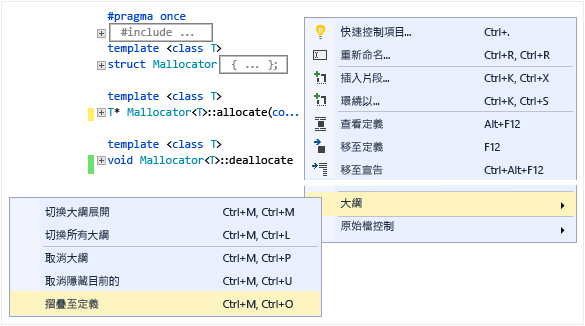
當您將資料指標放在大括弧 '{' 或 '}' 前面時,編輯器會醒目提示其相符的對應項目。
其他大綱選項則位於主功能表的 [編輯]>[大綱] 下方。
行號
您可以移至 [工具選項>文本編輯器>所有語言一般]>>或搜尋 “line num” 與 [快速啟動] (Ctrl + Q),將行號新增至專案。 您可以針對所有語言或只針對特定語言 (包括 C++) 設定行號。
捲動和縮放
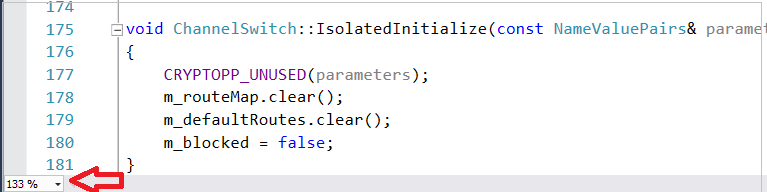
您可以按下 Ctrl 鍵並使用滑鼠滾輪捲動,在編輯器中放大或縮小。 您也可以使用左下角的縮放設定來進行縮放。
捲軸 [對應模式] 可讓您快速地捲動及瀏覽程式碼檔案,而不需要離開目前位置。 您可以按一下 Code Map 上的任何位置,直接移至該處。
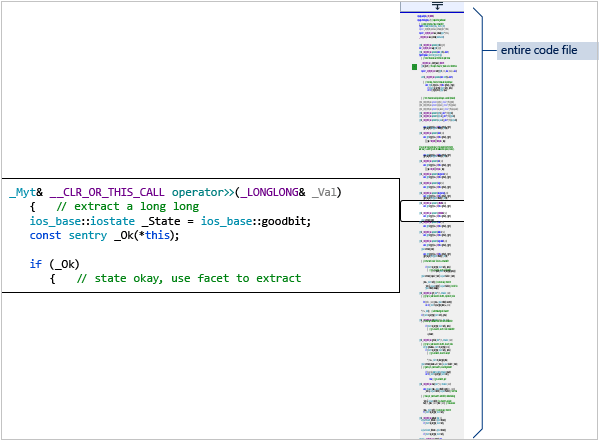
若要開啟地圖模式,請在主要工具列的 [快速啟動] 搜尋方塊中輸入「地圖」,然後選擇 [使用卷動地圖模式]。 如需詳細資訊,請參閱如何:自訂捲軸以追蹤程式碼。
在關閉 [對應模式] 後,捲軸還是會醒目提示您在檔案中所進行的變更。 綠色表示已儲存的變更,而黃色表示未儲存的變更。
快速諮詢和參數資訊
將滑鼠指標移至任何變數、函式或其他符號上方,即可取得其相關資訊,包括宣告,以及位於其前方的任何註解。

[快速諮詢] 工具提示含有 [線上搜尋] 連結。 請移至 [工具]>[選項]>[文字編輯器]>[C++]>[檢視] 來指定搜尋提供者。
如果您的程式代碼中有錯誤,您可以將滑鼠停留在程式代碼上,而 [快速諮詢 ] 會顯示錯誤訊息。 您也可以在 [錯誤清單] 視窗中找到錯誤訊息。


如果您的程式代碼中有錯誤,您可以將滑鼠停留在程式代碼上,而 [快速諮詢 ] 會顯示錯誤訊息。 您也可以在 [錯誤清單] 視窗中找到錯誤訊息。
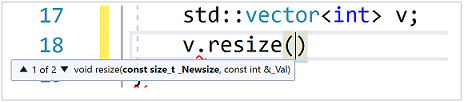
當您呼叫函式時, 參數資訊 會顯示參數的類型和預期的順序。
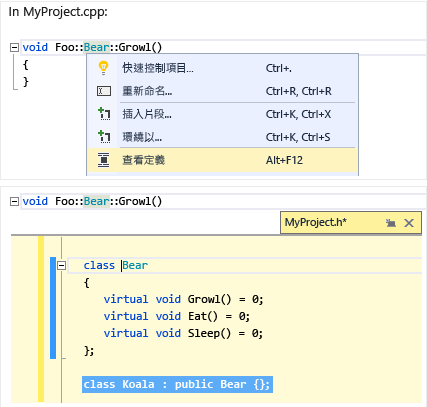
查看定義
將滑鼠指標移至變數或函式宣告上方,按一下滑鼠右鍵,然後選擇 [查看定義],以查看其定義的內嵌檢視,而不用離開您的目前位置。 如需詳細資訊,請參閱查看定義 (Alt+F12)。
F1 說明
將游標放在任何類型、關鍵詞或函式之後,然後按 F1 直接移至 Microsoft Learn 的相關參考主題。 F1 也適用於錯誤清單和許多對話框中的專案。
類別檢視
[類別檢視] 會顯示一組可搜尋的樹狀結構,其中包含所有程式碼符號及其範圍和父子式階層,根據每個專案進行組織。 您可以透過 [類別檢視設定] (按一下視窗頂端的齒輪方塊圖示) 來設定 [類別檢視] 顯示的內容。

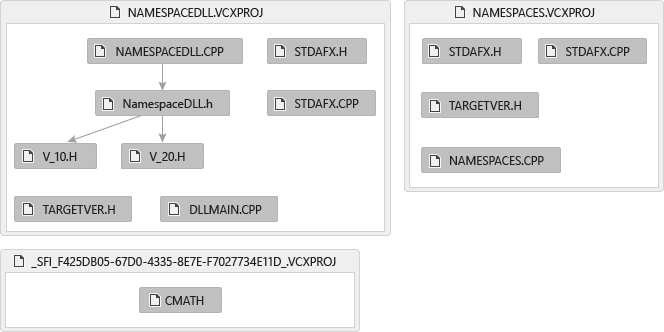
產生 Include 檔圖形
以滑鼠右鍵按一下專案中的程式碼檔案,然後選擇 [產生 Include 檔圖形],以查看其他檔案所包含之檔案的圖形。
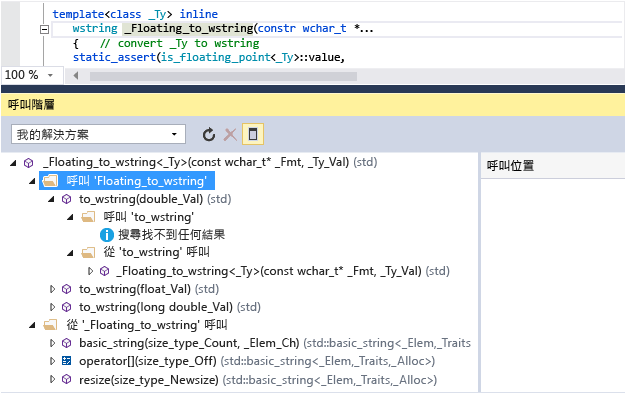
檢視呼叫階層
以滑鼠右鍵按一下任何函式呼叫,並檢視其所呼叫全部函式 (以及呼叫它的所有函式) 的遞迴清單。 清單中的每個函式都可以用相同方式展開。 如需詳細資訊,請參閱呼叫階層。
另請參閱
編輯和重構程序代碼 (C++)
在 Visual Studio
中使用適用於 C++ 的 Live Share 共同作業中的 C++ 程式代碼基底
意見反應
即將登場:在 2024 年,我們將逐步淘汰 GitHub 問題作為內容的意見反應機制,並將它取代為新的意見反應系統。 如需詳細資訊,請參閱:https://aka.ms/ContentUserFeedback。
提交並檢視相關的意見反應