在 Power BI Desktop 中使用 Azure 成本管理連接器建立視覺效果和報表
您可以使用適用於 Power BI Desktop 的 Azure 成本管理連接器,製作功能強大的自定義視覺效果和報表,以協助您進一步瞭解您的 Azure 支出。
Azure 成本管理連接器目前支援下列項目的客戶:
- 直接 Microsoft 客戶合約
- Enterprise 合約 (EA)
- Microsoft 合作夥伴合約
如果您有不支援的合約,您可以使用匯出將成本資料儲存至共用,然後使用Power BI 連線到該共用。 如需詳細資訊,請參閱 教學課程 - 從 Azure 成本管理建立和管理匯出的數據。
Azure 成本管理連接器會使用 OAuth 2.0 向 Azure 進行驗證,並識別要使用連接器的使用者。 在此流程中所產生的權杖會在特定期間內有效。 Power BI 會保留下一次登入的令牌。 OAuth 2.0 是程式的標準,其會在幕後進行,以確保這些許可權的安全處理。 若要連線,您必須針對 Enterprise 合約 使用 Enterprise 管理員 istrator 帳戶,或具有適用於 Microsoft 客戶合約 之計費帳戶或帳單配置檔層級的適當許可權。
注意
此連接器會取代先前可用的 Azure 使用量見解 和 Azure 成本管理 (Beta) 連接器。 使用先前連接器建立的任何報表都必須使用此連接器重新建立。
使用 Azure 成本管理 連線
若要在 Power BI Desktop 中使用 Azure 成本管理連接器 ,請執行下列步驟:
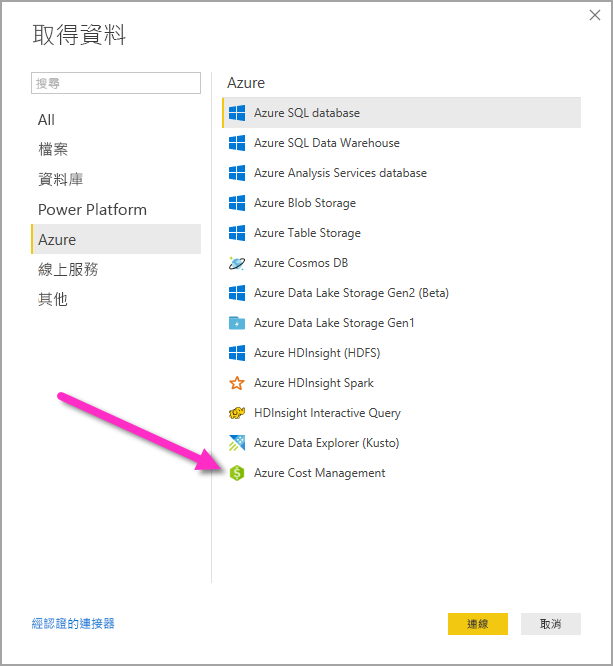
在 [首頁] 功能區中選取 [取得資料]。
在資料類別清單中選取 [Azure]。
選取 [Azure 成本管理]。
在出現的對話框中,針對 [選擇範圍] 下拉式清單,使用 [手動輸入範圍] 進行 Microsoft 客戶合約,或使用 [註冊號碼] 進行 Enterprise 合約 (EA) 。
連線 至 Microsoft 客戶合約 帳戶
本節說明連線到 Microsoft 客戶合約 帳戶所需的步驟。
連線 計費帳戶
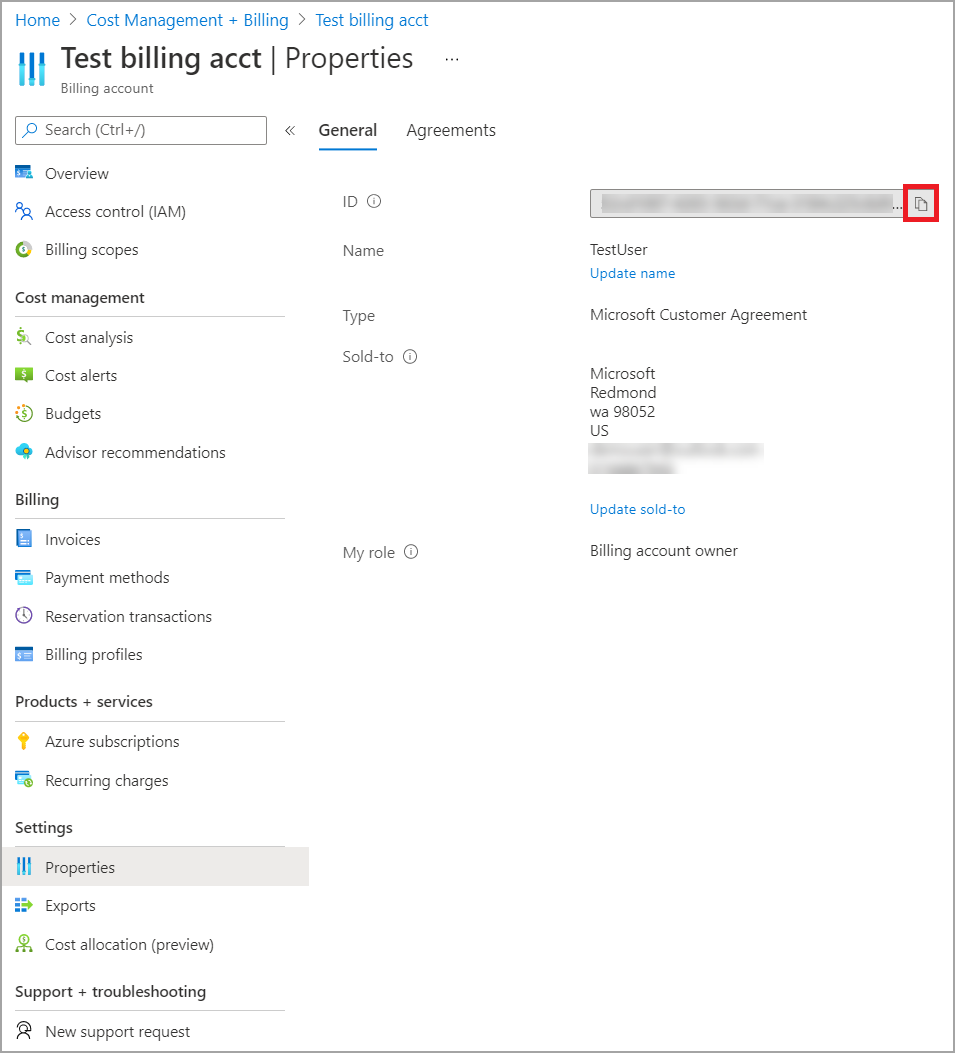
若要連線到計費帳戶,您必須從 Azure 入口網站 擷取您的計費帳戶標識碼:
在 Azure 入口網站中,瀏覽到 [成本管理 + 計費]。
選取您的帳單設定檔。
在功能表中的 [設定] 底下,選取側邊欄中的 [屬性]。
複製 [帳單設定檔] 底下的 [識別碼]。
針對 [選擇範圍],選取 [手動輸入範圍],然後輸入 連接字串,如下列範例所示,將 {billingAccountId} 取代為從先前步驟複製的數據。
/providers/Microsoft.Billing/billingAccounts/{billingAccountId}或者,針對 [ 選擇範圍],選取 [ 註冊號碼 ],然後輸入從先前步驟複製的計費帳戶標識符字串。
輸入月數,然後選取 [ 確定]。
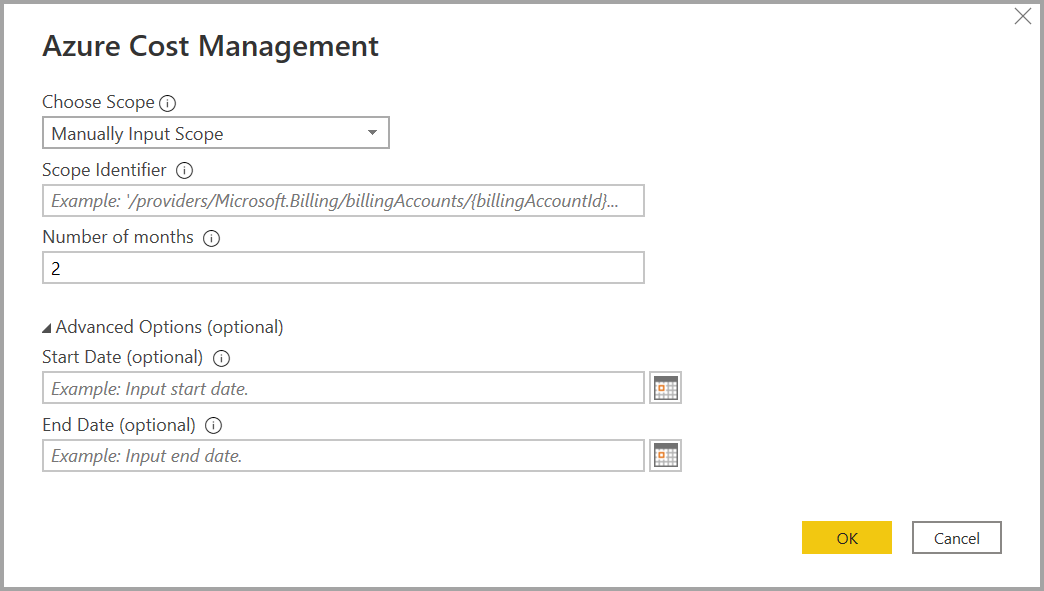
或者,如果您想要下載少於一個月的數據,您可以將月數設定為零,然後使用開始日期和結束日期值來指定日期範圍,其等於小於 31 天。
出現提示時,請以您的 Azure 使用者帳戶和密碼登入。 您必須能夠存取計費帳戶範圍,才能成功存取帳單數據。
連線 帳單配置檔
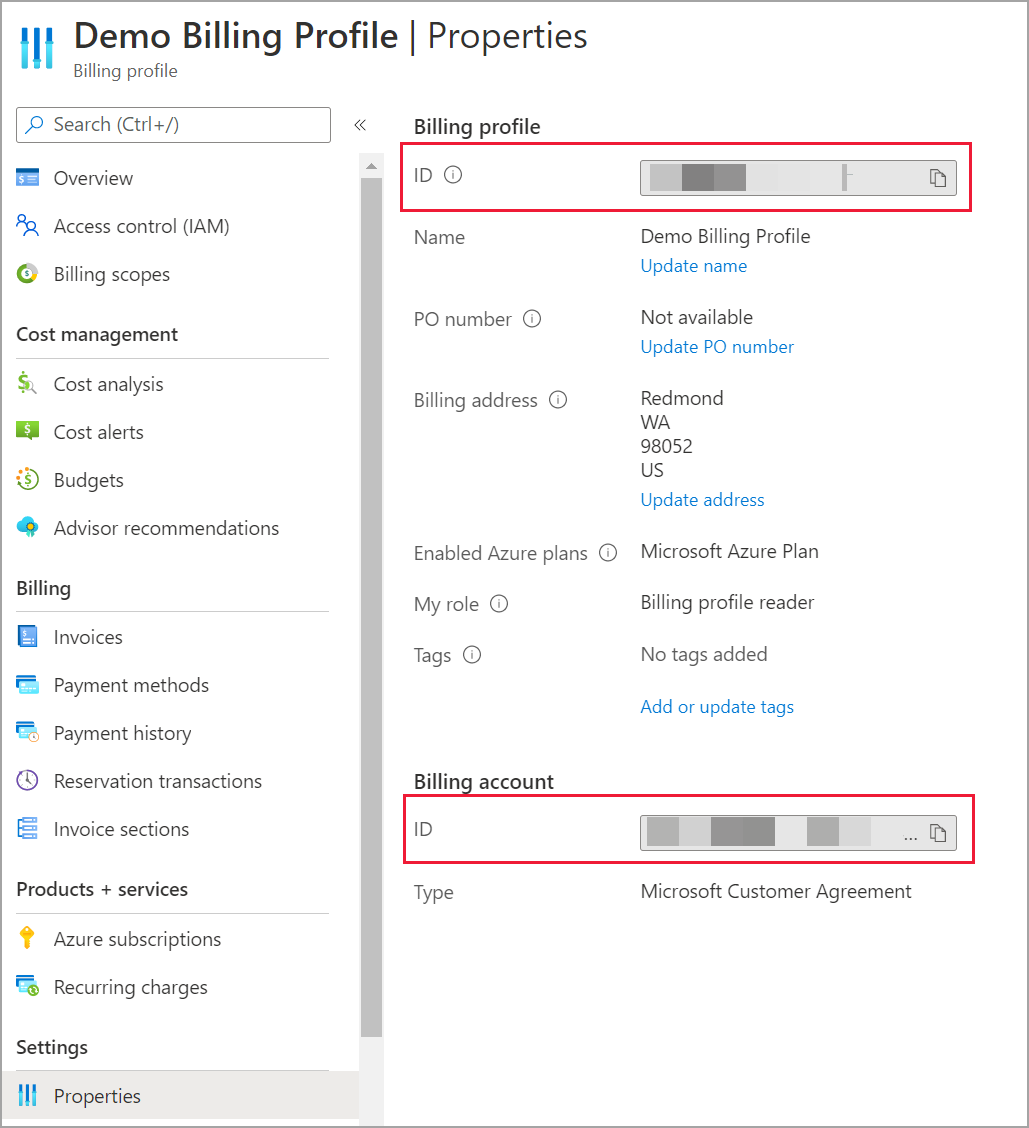
若要連線到帳單配置檔,您必須從 Azure 入口網站 擷取帳單配置檔標識碼和帳單帳戶標識碼:
在 Azure 入口網站中,瀏覽到 [成本管理 + 計費]。
選取您的帳單設定檔。
在功能表中的 [設定] 底下,選取側邊欄中的 [屬性]。
複製 [帳單設定檔] 底下的 [識別碼]。
在 [計費帳戶] 底下,複製標識符。
針對 [選擇範圍],選取 [手動輸入範圍],然後輸入 連接字串,如下列範例所示,將 {billingAccountId} 和 {billingProfileId} 取代為從先前步驟複製的數據。
/providers/Microsoft.Billing/billingAccounts/{billingAccountId}/billingProfiles/{billingProfileId}輸入月數,然後選取 [ 確定]。
出現提示時,請以您的 Azure 使用者帳戶和密碼登入。 您必須能夠存取帳單配置檔,才能成功存取帳單配置文件數據。
連線 至 Enterprise 合約 帳戶
若要連線至 Enterprise Agreement (EA) 帳戶,您可以從 Azure 入口網站取得您的註冊識別碼:
在 Azure 入口網站中,瀏覽到 [成本管理 + 計費]。
選取您的計費帳戶。
在 [概 觀] 功能表上,複製 [帳單帳戶標識符]。
針對 [ 選擇範圍],選取 [ 註冊號碼 ],然後貼上上一個步驟中的計費帳戶標識碼。
輸入月數,然後選取 [ 確定]。
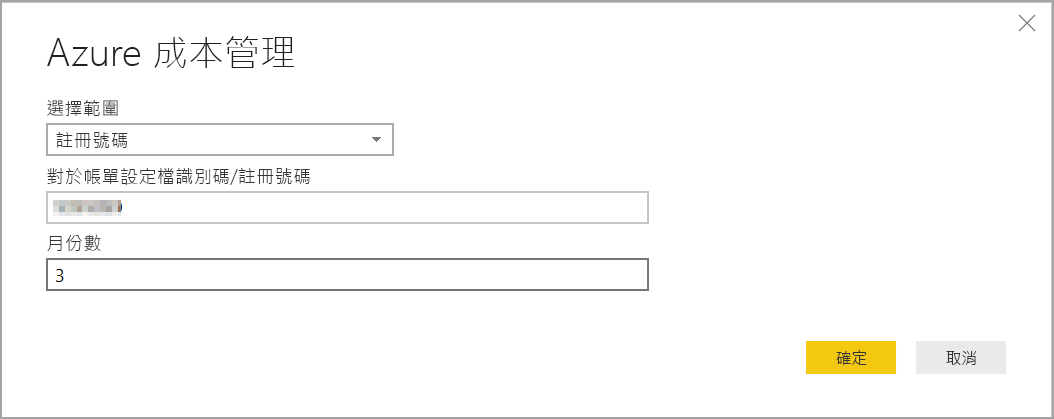
出現提示時,請以您的 Azure 使用者帳戶和密碼登入。 您必須針對 Enterprise 合約 使用 Enterprise 管理員 istrator 帳戶。
可透過連接器取得的數據
成功驗證之後, [導覽器 ] 視窗隨即出現,其中包含下列可用的數據表:
| Table | 帳戶類型 | 支援的範圍 | 說明 |
|---|---|---|---|
| 餘額摘要 | 僅限EA | EA 註冊 | Enterprise 合約 (EA) 目前計費月份餘額的摘要。 |
| 計費事件 | 僅限 MCA | 帳單設定檔 | 僅 Microsoft 客戶合約 新發票、點數購買等的事件記錄檔。 |
| 預算 | EA、MCA | EA 註冊,MCA 計費帳戶,MCA 計費配置檔 | 預算詳細數據,可檢視現有預算目標的實際成本或使用量。 |
| 費用 | 僅限 MCA | MCA 計費配置檔 | Azure 使用量、Marketplace 費用和費用的每月摘要會分別計費。 僅 Microsoft 客戶合約。 |
| 點數清單 | 僅限 MCA | MCA 計費配置檔 | 所提供帳單配置檔的 Azure 點數購買詳細數據。 僅 Microsoft 客戶合約。 |
| 價位表 | EA、MCA | EA 註冊,MCA 計費配置檔 | 所提供帳單配置檔或EA註冊適用的計量費率。 |
| RI 費用 | EA、MCA | EA 註冊,MCA 計費配置檔 | 過去 24 個月與您的保留實例相關聯的費用。 下表正在淘汰,請使用 RI 交易 |
| RI 建議 (共用) | EA、MCA | EA 註冊,MCA 計費配置檔 | 根據過去 30 天內所有訂用帳戶使用量趨勢的保留實例購買建議。 |
| RI 建議 (單一) | EA、MCA | EA 註冊,MCA 計費配置檔 | 根據過去 30 天內單一訂用帳戶使用量趨勢的保留實例購買建議。 |
| RI 交易 | EA、MCA | EA 註冊,MCA 計費配置檔 | 計費帳戶範圍上保留實例的交易清單。 |
| RI 使用情況詳細資料 | EA、MCA | EA 註冊,MCA 計費配置檔 | 上個月現有保留實例的取用詳細數據。 |
| RI 使用量摘要 | EA、MCA | EA 註冊,MCA 計費配置檔 | 每日 Azure 保留使用量百分比。 |
| 使用方式詳細資料 | EA、MCA | EA 註冊,MCA 計費帳戶,MCA 計費配置檔 | EA 註冊上指定帳單配置檔的已取用數量和預估費用明細。 |
| 分攤使用量詳細資料 | EA、MCA | EA 註冊,MCA 計費帳戶,MCA 計費配置檔 | EA 註冊上指定帳單配置檔的已取用數量和預估攤銷費用明細。 |
您可以選擇資料表來檢視預覽對話框。 您可以選取名稱旁邊的方塊,然後選取 [載入] 來選取一或多個數據表。
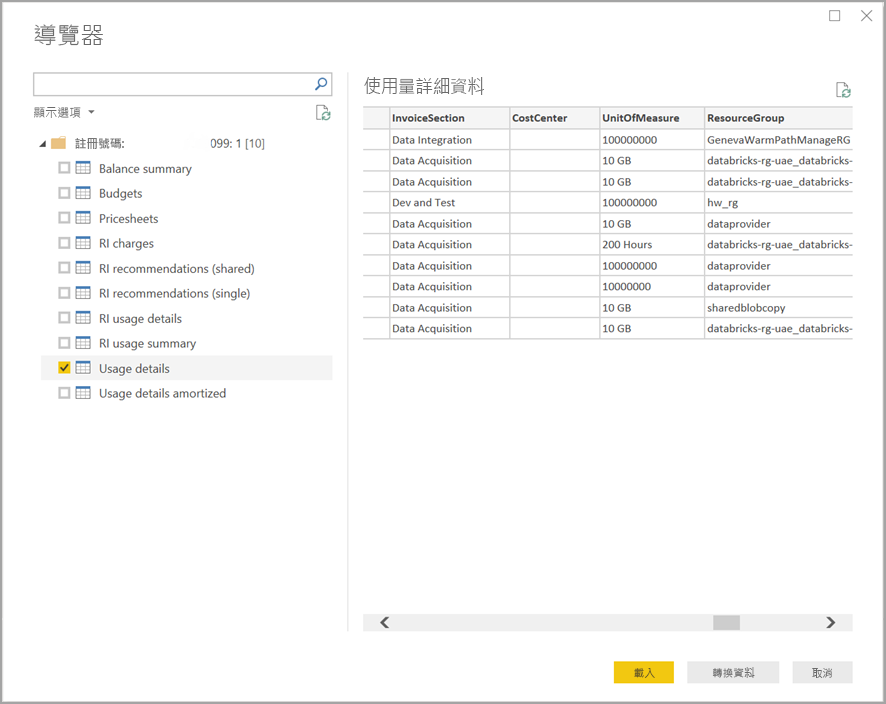
當您選取 [載入] 時,數據會載入 Power BI Desktop。
載入您選取的數據時,數據表和欄位會顯示在 [字段 ] 窗格中。
考量與限制
下列考慮和限制適用於 Azure 成本管理資料連接器:
Power BI 不支持超過一百萬個數據列的數據列要求。 相反地,您可以嘗試使用在 Azure 成本管理中建立和管理匯出數據中所述的匯出功能。
Azure 成本管理數據連接器不適用於 Office 365 GCC 客戶帳戶。
數據重新整理:成本與使用量數據通常會在 Azure 入口網站 中更新,並在 8 到 24 小時內支援 API,因此建議您限制 Power BI 排程的重新整理每天一次或兩次。
數據源重複使用: 如果您有多個報表提取相同的數據,而且不需要更多報表特定的數據轉換,您應該重複使用相同的數據源,以減少提取使用量詳細數據所需的時間。
如需重複使用數據源的詳細資訊,請參閱下列各項:
如果您選擇大於三個月的日期參數,當您嘗試重新整理數據時,可能會收到 RI 使用量詳細數據的 400 個錯誤要求。 若要減輕錯誤,請執行下列步驟:
在 Power BI Desktop 中,選取 [ 首頁 > 轉換數據]。
在 Power Query 編輯器 中,選取 RI 使用詳細數據語意模型,然後選取 [進階編輯器]。
更新 Power Query 程式代碼,如下列段落所示,它會將呼叫分割成三個月的區塊。 請務必記下並保留您的註冊號碼或計費帳戶/帳單設定檔識別碼。
針對 EA ,請使用下列程式代碼更新:
let
    enrollmentNumber = "<<Enrollment Number>>",
    optionalParameters1 = [startBillingDataWindow = "-9", endBillingDataWindow = "-6"],
    source1 = AzureCostManagement.Tables("Enrollment Number", enrollmentNumber, 5, optionalParameters1),
    riusagedetails1 = source1{[Key="riusagedetails"]}[Data],
    optionalParameters2 = [startBillingDataWindow = "-6", endBillingDataWindow = "-3"],
    source2 = AzureCostManagement.Tables("Enrollment Number", enrollmentNumber, 5, optionalParameters2),
    riusagedetails2 = source2{[Key="riusagedetails"]}[Data],
    riusagedetails = Table.Combine({riusagedetails1, riusagedetails2})
in
    riusagedetails
針對 Microsoft 客戶合約,請使用下列更新:
let
    billingProfileId = "<<Billing Profile Id>>",
    optionalParameters1 = [startBillingDataWindow = "-9", endBillingDataWindow = "-6"],
    source1 = AzureCostManagement.Tables("Billing Profile Id", billingProfileId, 5, optionalParameters1),
    riusagedetails1 = source1{[Key="riusagedetails"]}[Data],
    optionalParameters2 = [startBillingDataWindow = "-6", endBillingDataWindow = "-3"],
    source2 = AzureCostManagement.Tables("Billing Profile Id", billingProfileId, 5, optionalParameters2),
    riusagedetails2 = source2{[Key="riusagedetails"]}[Data],
    riusagedetails = Table.Combine({riusagedetails1, riusagedetails2})
in
    riusagedetails
使用上一個步驟的適當更新來更新程式代碼之後,請選取 [完成 ],然後選取 [ 關閉和套用]。
您可能會遇到標籤無法在使用方式詳細資料中運作,或標記數據行無法轉換成 json 的情況。 此問題源於目前的 UCDD API 藉由修剪開頭和結尾括號來傳回標記數據行,這會導致 Power BI 無法轉換數據行,因為它會以字串的形式傳回它。 若要減輕這種情況,請執行下列步驟。
- 流覽至 [查詢編輯器]。
- 選取 [ 使用量詳細數據] 資料表。
- 在右窗格中,[ 屬性 ] 窗格會顯示 [ 套用的步驟]。 您必須在流覽步驟之後,將自訂數據行新增至步驟。
- 從功能表中,選取 [新增數據行新增自定義數據行>]
- 為數據行命名,例如您可以將數據行 命名為 TagsInJson 或您偏好的任何專案,然後在查詢中輸入下列文字:
```= "{"& [Tags] & "}" - 完成先前的步驟會以 json 格式建立標記的新數據行
- 您現在可以視需要傳輸和展開數據行。
Microsoft Entra 來賓帳戶遇到的驗證問題: 您可能具有存取註冊或計費帳戶的適當許可權,但收到類似下列其中一項的驗證錯誤:
- 禁止存取資源
- 我們無法使用所提供的認證進行驗證。 請再試一次。
這些錯誤可能是因為將不同 Microsoft Entra 網域中的使用者帳戶新增為來賓使用者。
針對來賓帳戶:使用下列設定或選項,當您在與成本管理 Power BI 連接器連線時收到 驗證對話框 的提示:
- 選取 [登入]
- 選取[ 使用另一個帳戶 ] (對話框底部)
- 選取 [登入選項 ] (對話框底部)
- 選取 [登入組織]
- 針對 [網域名稱],提供 Microsoft Entra 網域 (其中已將您新增為來賓) 的完整網域名稱 (FQDN)。
- 然後,針對 [選取帳戶],選取您先前已驗證的使用者帳戶。
相關內容
您可以使用Power BI Desktop 連線到許多不同的數據源。 如需詳細資訊,請參閱下列文章: