教學課程:建立自由格式報表 (報表產生器)
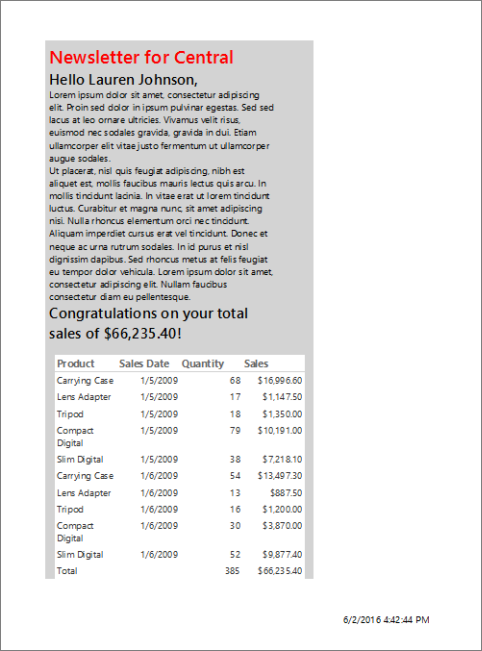
在本教學課程中,您會建立分頁報表,作為電子報。 每個頁面會顯示靜態文字、摘要的視覺效果,以及詳細的範例銷售資料。
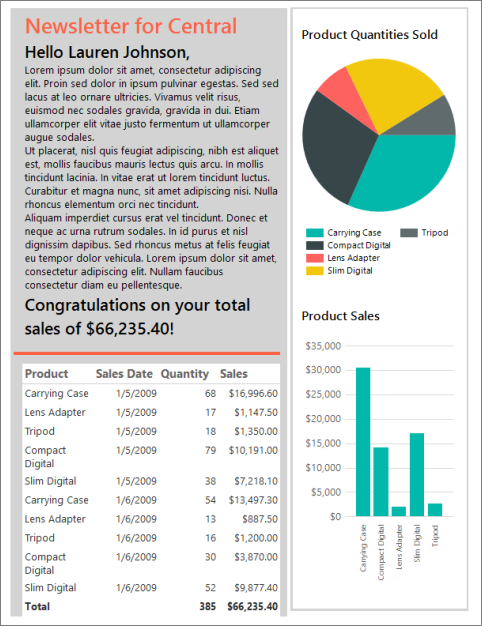
此報表會依領域將資訊分組,並顯示各領域的銷售經理姓名以及詳細和摘要銷售資訊。 您從清單資料區域開始,做為免費表單報表的基礎。 然後新增含有影像的裝飾面板、插入資料的靜態文字、顯示詳細資訊的資料表,以及 (選用) 顯示摘要資訊的圓形圖和直條圖。
完成此教學課程的估計時間:20 分鐘。
需求
如需有關需求的詳細資訊,請參閱教學課程的必要條件 (報表產生器)。
1.建立空白報表、資料來源與資料集
注意
在本教學課程中,查詢會包含資料值,因此不需要外部資料來源。 這樣會使查詢相當冗長。 在商業環境中,查詢不會包含資料。 這僅供教學之用。
建立空白報表
從電腦、Reporting Services Web 入口網站或 SharePoint 整合模式啟動報表產生器。
[新報表或資料集] 對話方塊隨即開啟。
如果您看不到 [新增報表或資料集] 對話方塊,請按一下 [檔案] 功能表 > [新增]。
在左窗格中,確認已選取 [新增報表]。
在右窗格中,選取 [空白報表]。
建立新的資料來源
在 [報表資料] 窗格中,選取 [新增] > [資料來源]。
在 [名稱] 方塊中,輸入:ListDataSource
選取 [使用內嵌於報表中的連接] 。
確認連線類型為 Microsoft SQL Server,接著在 [連接字串] 方塊中輸入 Data Source = <servername>
<servername> (例如 Report001) 指定已安裝 SQL Server 資料庫引擎執行個體的電腦名稱。 由於此報表的資料不是擷取自 SQL Server 資料庫,您不必加上資料庫的名稱。 指定之伺服器上的預設資料庫僅用來剖析查詢。
選取 [認證],並輸入連接到 SQL Server Database Engine 執行個體所需的認證。
選取 [確定]。
建立新的資料集
在 [報表資料] 窗格中,選取 [新增] > [資料集]。
在 [名稱] 方塊中,輸入:ListDataset。
選取 [使用內嵌在我的報表中的資料集],並確認資料來源是 ListDataSource。
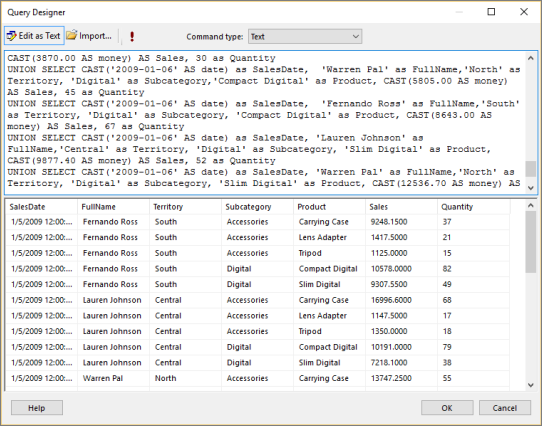
確認已選取 [文字] 查詢類型,然後選取 [查詢設計工具]。
選取 [當成文字編輯]。
複製下列查詢並貼入查詢窗格中:
SELECT CAST('2009-01-05' AS date) as SalesDate, 'Lauren Johnson' as FullName,'Central' as Territory, 'Accessories' as Subcategory,'Carrying Case' as Product, CAST(16996.60 AS money) AS Sales, 68 as Quantity
UNION SELECT CAST('2009-01-05' AS date) as SalesDate, 'Warren Pal' as FullName,'North' as Territory, 'Accessories' as Subcategory, 'Carrying Case' as Product, CAST(13747.25 AS money) AS Sales, 55 as Quantity
UNION SELECT CAST('2009-01-05' AS date) as SalesDate, 'Fernando Ross' as FullName,'South' as Territory, 'Accessories' as Subcategory,'Carrying Case' as Product, CAST(9248.15 AS money) As Sales, 37 as Quantity
UNION SELECT CAST('2009-01-05' AS date) as SalesDate, 'Lauren Johnson' as FullName,'Central' as Territory, 'Accessories' as Subcategory,'Tripod' as Product, CAST(1350.00 AS money) AS Sales, 18 as Quantity
UNION SELECT CAST('2009-01-05' AS date) as SalesDate, 'Warren Pal' as FullName,'North' as Territory, 'Accessories' as Subcategory,'Tripod' as Product, CAST(1800.00 AS money) AS Sales, 24 as Quantity
UNION SELECT CAST('2009-01-05' AS date) as SalesDate, 'Fernando Ross' as FullName,'South' as Territory, 'Accessories' as Subcategory,'Tripod' as Product, CAST(1125.00 AS money) AS Sales, 15 as Quantity
UNION SELECT CAST('2009-01-05' AS date) as SalesDate, 'Lauren Johnson' as FullName,'Central' as Territory, 'Accessories' as Subcategory,'Lens Adapter' as Product, CAST(1147.50 AS money) AS Sales, 17 as Quantity
UNION SELECT CAST('2009-01-05' AS date) as SalesDate, 'Warren Pal' as FullName,'North' as Territory, 'Accessories' as Subcategory,  'Lens Adapter' as Product, CAST(742.50 AS money) AS Sales, 11 as Quantity
UNION SELECT CAST('2009-01-05' AS date) as SalesDate, 'Fernando Ross' as FullName,'South' as Territory, 'Accessories' as Subcategory,'Lens Adapter' as Product, CAST(1417.50 AS money) AS Sales, 21 as Quantity
UNION SELECT CAST('2009-01-06' AS date) as SalesDate, 'Lauren Johnson' as FullName,'Central' as Territory, 'Accessories' as Subcategory, 'Carrying Case' as Product, CAST(13497.30 AS money) AS Sales, 54 as Quantity
UNION SELECT CAST('2009-01-06' AS date) as SalesDate, 'Warren Pal' as FullName,'North' as Territory, 'Accessories' as Subcategory, 'Carrying Case' as Product, CAST(11997.60 AS money) AS Sales, 48 as Quantity
UNION SELECT CAST('2009-01-06' AS date) as SalesDate, 'Fernando Ross' as FullName,'South' as Territory, 'Accessories' as Subcategory, 'Carrying Case' as Product, CAST(10247.95 AS money) As Sales, 41 as Quantity
UNION SELECT CAST('2009-01-06' AS date) as SalesDate, 'Lauren Johnson' as FullName,'Central' as Territory, 'Accessories' as Subcategory, 'Tripod' as Product, CAST(1200.00 AS money) AS Sales, 16 as Quantity
UNION SELECT CAST('2009-01-06' AS date) as SalesDate, 'Warren Pal' as FullName,'North' as Territory, 'Accessories' as Subcategory,'Tripod' as Product, CAST(2025.00 AS money) AS Sales, 27 as Quantity
UNION SELECT CAST('2009-01-06' AS date) as SalesDate, 'Fernando Ross' as FullName,'South' as Territory, 'Accessories' as Subcategory,'Tripod' as Product, CAST(1425.00 AS money) AS Sales, 19 as Quantity
UNION SELECT CAST('2009-01-06' AS date) as SalesDate, 'Lauren Johnson' as FullName,'Central' as Territory, 'Accessories' as Subcategory,'Lens Adapter' as Product, CAST(887.50 AS money) AS Sales, 13 as Quantity
UNION SELECT CAST('2009-01-06' AS date) as SalesDate, 'Warren Pal' as FullName,'North' as Territory, 'Accessories' as Subcategory, 'Lens Adapter' as Product, CAST(607.50 AS money) AS Sales, 9 as Quantity
UNION SELECT CAST('2009-01-06' AS date) as SalesDate, 'Fernando Ross' as FullName,'South' as Territory, 'Accessories' as Subcategory,'Lens Adapter' as Product, CAST(1215.00 AS money) AS Sales, 18 as Quantity
UNION SELECT CAST('2009-01-05' AS date) as SalesDate,  'Lauren Johnson' as FullName,'Central' as Territory, 'Digital' as Subcategory,'Compact Digital' as Product, CAST(10191.00 AS money) AS Sales, 79 as Quantity
UNION SELECT CAST('2009-01-05' AS date) as SalesDate,  'Warren Pal' as FullName,'North' as Territory, 'Digital' as Subcategory, 'Compact Digital' as Product, CAST(8772.00 AS money) AS Sales, 68 as Quantity
UNION SELECT CAST('2009-01-05' AS date) as SalesDate,  'Fernando Ross' as FullName,'South' as Territory, 'Digital' as Subcategory, 'Compact Digital' as Product, CAST(10578.00 AS money) AS Sales, 82 as Quantity
UNION SELECT CAST('2009-01-05' AS date) as SalesDate, 'Lauren Johnson' as FullName,'Central' as Territory,'Digital' as Subcategory, 'Slim Digital' as Product, CAST(7218.10 AS money) AS Sales, 38 as Quantity
UNION SELECT CAST('2009-01-05' AS date) as SalesDate, 'Warren Pal' as FullName,'North' as Territory,'Digital' as Subcategory, 'Slim Digital' as Product, CAST(8357.80 AS money) AS Sales, 44 as Quantity
UNION SELECT CAST('2009-01-05' AS date) as SalesDate, 'Fernando Ross' as FullName,'South' as Territory,'Digital' as Subcategory,'Slim Digital' as Product, CAST(9307.55 AS money) AS Sales, 49 as Quantity
UNION SELECT CAST('2009-01-06' AS date) as SalesDate,  'Lauren Johnson' as FullName,'Central' as Territory, 'Digital' as Subcategory,'Compact Digital' as Product, CAST(3870.00 AS money) AS Sales, 30 as Quantity
UNION SELECT CAST('2009-01-06' AS date) as SalesDate,  'Warren Pal' as FullName,'North' as Territory, 'Digital' as Subcategory,'Compact Digital' as Product, CAST(5805.00 AS money) AS Sales, 45 as Quantity
UNION SELECT CAST('2009-01-06' AS date) as SalesDate,  'Fernando Ross' as FullName,'South' as Territory, 'Digital' as Subcategory, 'Compact Digital' as Product, CAST(8643.00 AS money) AS Sales, 67 as Quantity
UNION SELECT CAST('2009-01-06' AS date) as SalesDate, 'Lauren Johnson' as FullName,'Central' as Territory, 'Digital' as Subcategory, 'Slim Digital' as Product, CAST(9877.40 AS money) AS Sales, 52 as Quantity
UNION SELECT CAST('2009-01-06' AS date) as SalesDate, 'Warren Pal' as FullName,'North' as Territory, 'Digital' as Subcategory, 'Slim Digital' as Product, CAST(12536.70 AS money) AS Sales, 66 as Quantity
UNION SELECT CAST('2009-01-06' AS date) as SalesDate, 'Fernando Ross' as FullName,'South' as Territory, 'Digital' as Subcategory, 'Slim Digital' as Product, CAST(6648.25 AS money) AS Sales, 35 as Quantity
選取 [執行] 圖示 (!) 來執行查詢。
查詢結果會成為可供報表顯示的資料。
選取 [確定]。
2.加入及設定清單
在 Reporting Services 中,清單資料區相當適合用來建立自由格式報表。 它是根據 tablix 資料區域,就和資料表和矩陣一樣。 如需詳細資訊,請參閱在編頁報表中建立具有清單的發票和表單 (報表產生器)。
在本教學課程中使用清單,在格式類似新聞稿的報表中顯示各銷售領域的銷售資訊。 此資訊是依領域分組。 還可加入新的資料列群組來依領域分組資料,然後刪除內建的 [詳細資料] 資料列群組。
新增清單
在 [插入] 索引標籤中,轉至 [資料區域]>[清單]。
選取報表主體 (標題和頁尾區域之間),並拖曳以形成清單方塊。 將清單方塊調整成高 7 英吋且寬 6.25 英吋。 若要取得確切的大小,請在 [屬性] 窗格的 [位置] 下,鍵入 [寬度] 和 [高度] 屬性的值。
注意
此報表會使用 Letter (8.5 X11) 紙張大小和 1 英吋的邊界。 若清單方塊高度超過 9 英吋或寬度超過 6.5 英吋,則可能產生空白頁面。
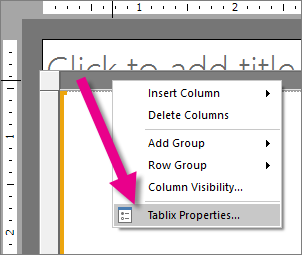
選取清單方塊內部,並以滑鼠右鍵按一下清單頂端的列,然後選取 [Tablix 屬性]。
從 [資料集名稱] 下拉式清單中,選取 [ListDataset] 。
選取 [確定]。
在清單內部選取滑鼠右鍵,然後選取 [矩形屬性]。
在 [一般] 索引標籤上,選取 [在後方新增分頁符號] 核取方塊。
選取 [確定]。
加入新的資料列群組並刪除 [詳細資料] 群組
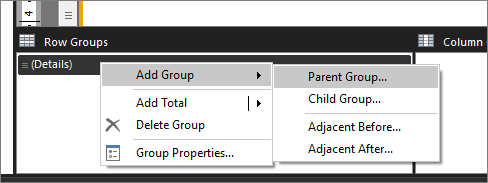
在 [資料列群組] 窗格中,以滑鼠右鍵按一下 [詳細資料] 群組,然後指向 [加入群組],再選取 [父群組]。
在 [群組依據] 清單中,選取
[Territory].選取 [確定]。
包含
[Territory]資料格的資料行會新增至清單。以滑鼠右鍵按一下清單中的 [Territory] 資料行,再選取 [刪除資料行]。
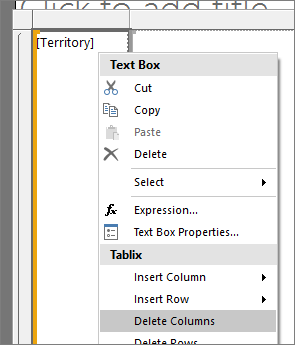
選取 [只刪除資料行]。
在 [資料列群組] 窗格中,以滑鼠右鍵按一下 [詳細資料] 群組 > [刪除群組]。
選取 [只刪除群組]。
選取 [確定]。
3.新增圖形元素
清單資料區的一項好處是,您可以在任何位置加入矩形和文字方塊等報表項目,而不必侷限於表格式配置。 可透過加入圖形 (有填色的矩形) 加強報表的外觀。
加入圖形元素至報表中
在 [插入] 索引標籤上,選取 [矩形]。
選取清單左上角並拖曳,形成高 7 英吋且寬 3.5 英吋的矩形。 同樣地,若要取得確切的大小,請在 [屬性] 窗格的 [位置] 下,鍵入 [寬度] 和 [高度] 的值。
以滑鼠右鍵按一下矩形 > [矩形屬性]。
選取 [填滿] 索引標籤。
在 [填滿色彩] 中,選取 [淺灰]。
選取 [確定]。
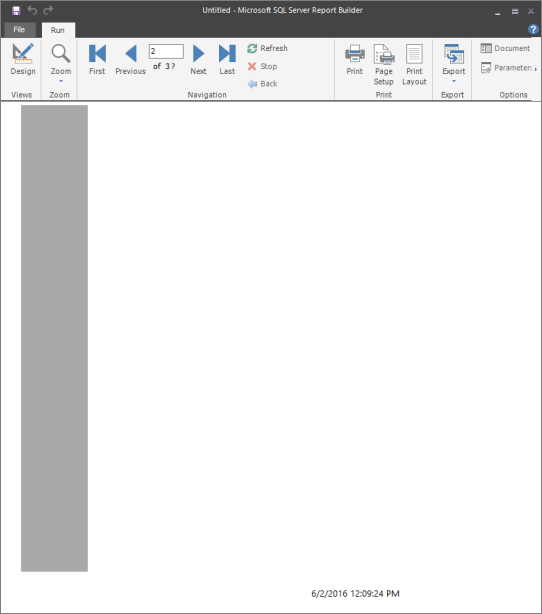
選取 [執行] 預覽報表。
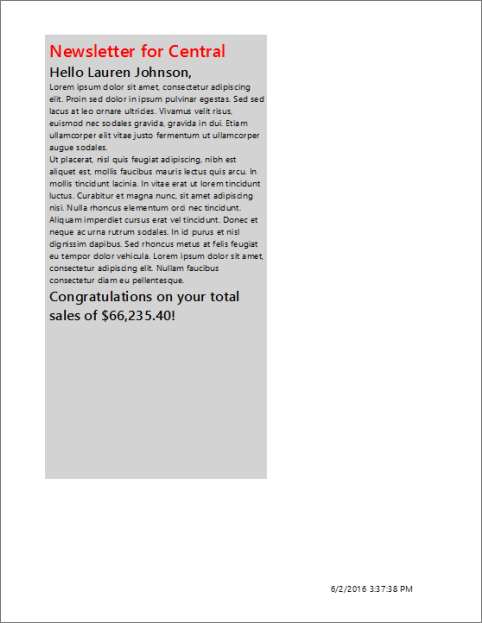
報表左側現在會有由淺灰色矩形組成的垂直圖形,如下圖所示。
4.加入自由格式文字
您可以新增文字輸入框以顯示在每個報表頁面上重複的靜態文字,還有資料欄位。
在報表中加入文字
選取 [設計] 返回設計檢視。
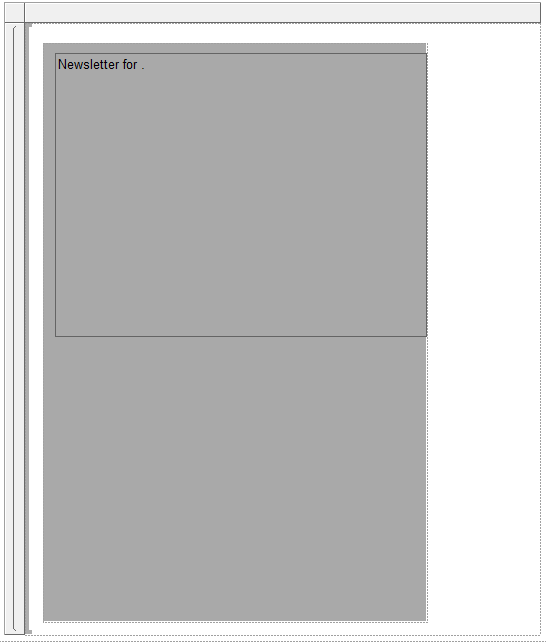
在 [插入] 索引標籤中,轉至 [文字輸入框]。 選取清單的左上角,在您先前新增的矩形內,拖曳形成大約寬 3.45 英吋且高約 5 英吋的文字輸入框。
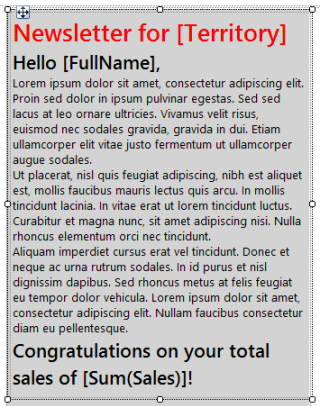
將游標置於文字輸入框內,然後輸入:Newsletter for。 在單字 "for" 後面加上一個空格來分隔的文字和您將在下一個步驟新增的欄位。
將
[Territory]欄位從 [報表資料] 窗格中的 ListDataSet 拖曳到 "Newsletter for " 之後。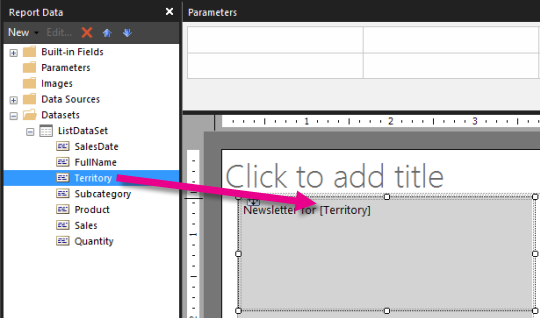
選取文字和
[Territory]欄位。在 [首頁] 索引標籤 > [字型],選取︰
- [Segoe Semibold]。
- [20 pt]。
- [蕃茄紅]。
將滑鼠游標置於您在步驟 3 輸入的文字下方,然後輸入:Hello,並在這個字後加上一個空格以分隔文字和您將在下一個步驟中新增的欄位。
將
[FullName]欄位從 [報表資料] 窗格中的 ListDataSet 拖曳到文字輸入框,放在 "Hello " 之後,然後輸入一個逗號 (,)。選取您在之前的步驟新增的文字。
在 [首頁] 索引標籤 > [字型],選取︰
- [Segoe Semibold]。
- [16 pt]。
- 黑色。
將滑鼠游標置於您在步驟 9 至步驟 13 加入的文字下方,然後複製並貼入下列無意義的文字:
Lorem ipsum dolor sit amet, consectetur adipiscing elit. Proin sed dolor in ipsum pulvinar egestas. Sed sed lacus at leo ornare ultricies. Vivamus velit risus, euismod nec sodales gravida, gravida in dui. Etiam ullamcorper elit vitae justo fermentum ut ullamcorper augue sodales.
Ut placerat, nisl quis feugiat adipiscing, nibh est aliquet est, mollis faucibus mauris lectus quis arcu. In mollis tincidunt lacinia. In vitae erat ut lorem tincidunt luctus. Curabitur et magna nunc, sit amet adipiscing nisi. Nulla rhoncus elementum orci nec tincidunt.
Aliquam imperdiet cursus erat vel tincidunt. Donec et neque ac urna rutrum sodales. In id purus et nisl dignissim dapibus. Sed rhoncus metus at felis feugiat eu tempor dolor vehicula. Lorem ipsum dolor sit amet, consectetur adipiscing elit. Nullam faucibus consectetur diam eu pellentesque.
選取您剛才新增的文字。
在 [首頁] 索引標籤 > [字型],選取︰
- [Segoe UI]。
- [10 pt]。
- 黑色。
將滑鼠游標置於文字輸入框內,在無意義文字底下輸入:Congratulations on your total sales of,並在文字之後以一個空格分隔文字和您將在下一個步驟新增的欄位。
將 [銷售額] 欄位拖曳到文字輸入框中,置於您在前一個步驟輸入的文字後面,然後輸入一個驚嘆號 (!)。
選取文字和您剛才新增的欄位。
在 [首頁] 索引標籤 > [字型],選取︰
- [Segoe Semibold]。
- [16 pt]。
- 黑色。
只選取
[Sales]欄位,然後以滑鼠右鍵按一下欄位 > [運算式]。在 [運算式] 方塊中,將運算式變更成包含 Sum 函式,如下所示:
=Sum(Fields!Sales.value)選取 [確定]。
在仍然選取
[Sum(Sales)]的情況下,在 [首頁] 索引標籤 > [數字] 群組 > [貨幣]。以滑鼠右鍵按一下包含「選取以加入標題」字樣的文字輸入框,然後選取 [刪除]。
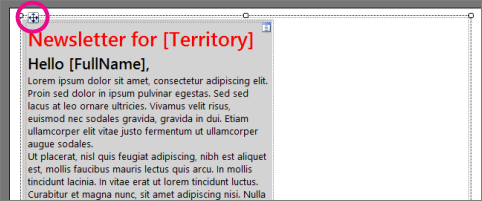
選取清單方塊。 選取兩個雙箭號,然後將它移至頁面頂端。
選取 [執行] 預覽報表。
報表會顯示靜態文字,而且每個報表頁面含有與特定領域相關的資料。 銷售額則格式化為貨幣。
5.加入資料表以顯示銷售詳細資料
使用新增資料表和矩陣精靈,將資料表加入至自由格式報表。 在完成精靈之後,您將要手動加入一個總計資料列。
新增資料表
在 [插入] 索引標籤中,轉至 [資料區域] > [資料表] > [資料表精靈]。
在 [選擇資料集] 頁面中,選取 ListDataset>[下一步]。
在 [排列欄位] 頁面上,將 [Product] 欄位從 [可用的欄位] 拖曳至 [值]。
針對 SalesDate、Quantity 和 Sales 重複步驟 3。 將 SalesDate 放到 Product 之後,Quantity 放到 SalesDate 之後,Sales 放到 SalesDate 之後。
選取 [下一步]。
在 [選擇配置] 頁面上,檢視資料表的配置。
資料表很簡單︰五個資料行,且沒有資料列或資料行群組。 由於沒有群組,與群組相關的配置選項無法使用。 稍後在本教學課程中,手動更新資料表使其包括總計。
選取 [下一步] 。
選取完成。
將資料表拖曳到您在第 4 課加入的文字方塊下方。
注意
請確定資料表在清單方塊內,而且在灰色矩形內。
在選取資料表的情況下,於 [資料列群組] 窗格中以滑鼠右鍵按一下 [詳細資料]>[新增總計]>[之後]。
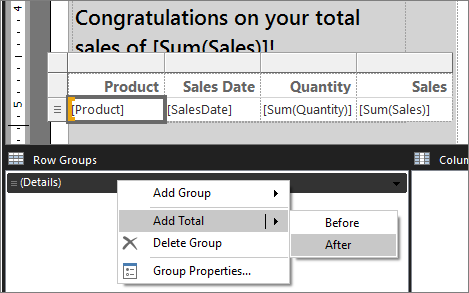
選取 [產品] 資料行中的資料格並輸入 [總計]。

選取 [SalesDate] 欄位。 在 [首頁] 索引標籤 > [數字],將 [預設] 變更為 [日期]。
選取 [Sum(Sales)] 欄位。 在 [首頁] 索引標籤 > [數字],將 [預設] 變更為 [貨幣]。
選取 [執行] 預覽報表。
報表會顯示含有銷售額詳細資料及總計的資料表。
6.儲存報表
您可以將報表儲存至報表伺服器、SharePoint 文件庫或您的電腦上。
本教學課程會將報表儲存至報表伺服器。 如果您沒有報表伺服器的存取權,請將報表儲存在電腦中。
將報表儲存在報表伺服器上
在 [報表產生器] 按鈕中,選取 [另存新檔]。
選取 [最近使用的網站和伺服器]。
選取或輸入您有權儲存報表之報表伺服器的名稱。
「正在連接到報表伺服器」訊息隨即顯示。 連接完成時,您就會看見報表伺服器管理員指定為預設報表位置之報表資料夾的內容。
在 [名稱] 中,將預設名稱取代為 SalesInformationByTerritory。
選取 [儲存]。
報表就會儲存至報表伺服器。 您連接之報表伺服器的名稱會顯示在視窗底部的狀態列中。
將報表儲存到您的電腦中
在 [報表產生器] 按鈕中,選取 [另存新檔]。
選取 [桌面]、[我的文件] 或 [我的電腦],然後瀏覽到您要儲存報表的資料夾。
在 [名稱] 中,將預設名稱取代為 SalesInformationByTerritory。
選取 [儲存]。
7.(選用) 加入線條以區隔報表的各區域
加入線條以區隔報表的編輯區和詳細資料區。
新增線條
選取 [設計] 返回設計檢視。
在 [插入] 索引標籤中,轉至 [報表項目]>[線條]。
在您於第 4 課新增的文字方塊下方繪製線條。
選取線條,然後在 [首頁] 索引標籤 > [邊界] 中選取:
- 寬度 選取 3 pt。
- 色彩 選取 [蕃茄紅]。
8.(選用) 新增摘要資料視覺效果
矩形可以協助您控制報表的轉譯方式。 將圓形圖和直條圖放到矩形內,以確保報表轉譯為您希望的外觀。
加入矩形
選取 [設計] 返回設計檢視。
在 [插入] 索引標籤中,轉至 [報表項目]>[矩形]。 將清單方塊內的矩形拖曳到資料表的右邊,形成大約寬 2.25 英吋且高 7.9 英吋的矩形。
在選取新矩形的情況下,在 [屬性] 窗格中,讓 BorderColor成為 LightGrey、 BorderStyle成為 Solid、 BorderWidth成為 2pt。
對齊矩形和資料表的上緣。
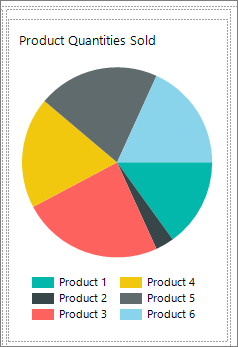
新增圓餅圖
在 [插入] 索引標籤中,轉至 [資料視覺效果]>[圖表]>[圖表精靈]。
在 [選擇資料集] 頁面中,選取 ListDataset>[下一步]。
選取 [圓形圖]>[下一步]。
在 [排列圖表欄位] 頁面上,將 [Product] 拖曳至 [類別目錄]。
將 [數量] 拖曳至 [值],然後選取 [下一步]。
選取 [完成]。
調整報表左上角顯示的圖表大小,成為大約寬 2.25 英吋且高 3.6 英吋。
將圖表拖曳到矩形內。
選取圖表標題,然後輸入:已售產品數量。
在 [首頁] 索引標籤 > [字型],讓標題成為︰
- 字型Segoe UI Semibold。
- 大小12 pt。
- 色彩黑色。
以滑鼠右鍵按一下圖例 > [圖例屬性]。
在 [一般] 索引標籤的 [圖例位置] 下,選取底部的中心點。
選取 [確定]。
視需要拖曳,讓圖表區域變高。
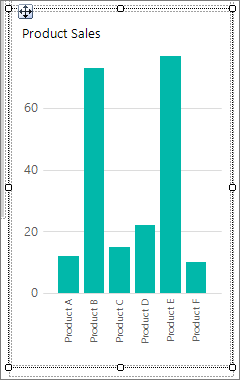
加入直條圖
在 [插入] 索引標籤 > [資料視覺效果]>[圖表]>[圖表精靈]。
在 [選擇資料集] 頁面中,選取 [ListDataset],然後選取 [下一步]。
選取 [資料行],然後選擇 [下一步]。
在 [排列圖表欄位] 頁面上,將 [Product] 欄位拖曳至 [類別目錄]。
將 [銷售] 拖曳至 [值],然後選取 [下一步]。
值會顯示在垂直軸上。
選取 [完成]。
直條圖隨即加入至報表的左上角。
調整圖表成為大約寬 2.25 英吋且高將近 4 英吋。
將圖表拖曳到矩形內。
選取圖表標題,然後輸入:產品銷售。
在 [首頁] 索引標籤 > [字型],讓標題成為︰
- 字型Segoe UI Semibold。
- 大小12 pt。
- 色彩黑色。
以滑鼠右鍵按一下圖例,然後選取 [刪除圖例]。
注意
當為小型圖表時,移除圖例會讓圖表更容易閱讀。
選取圖表軸,然後在 [首頁] 索引標籤 > [數字]>[貨幣]。
選取 [減少小數位數] 兩次,讓數字只顯示元而不顯示分。
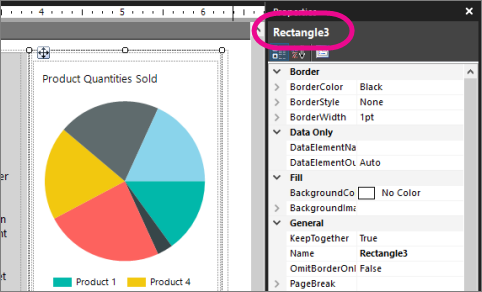
確認圖表位於矩形內部
您可以使用矩形當作報表頁面上其他項目的容器。 深入了解 矩形當作容器。
選取您稍早在本課程中建立並新增圖表的矩形。
在 [屬性] 窗格中, Name 屬性會顯示該矩形的名稱。
選取圓形圖。
在 [屬性] 窗格中,確認 Parent 屬性包含矩形的名稱。
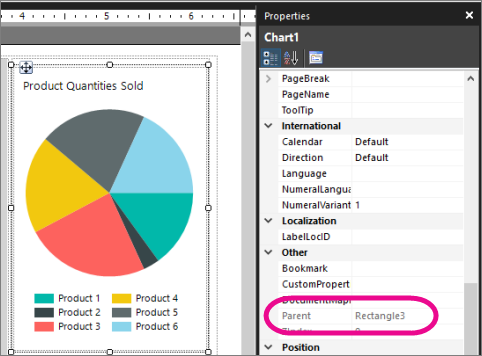
選取直條圖,然後重複步驟 3。
注意
如果圖表不是在矩形內部,轉譯後的報表將不會一併顯示圖表。
將圖表調整成相同的大小
選取圓形圖、按下 Ctrl 鍵,然後選取直條圖。
在選取兩個圖表的情況下,以滑鼠右鍵按一下 > [配置]>[設定成相同寬度]。
注意
先按的項目會決定所有已選取項目的寬度。
選取 [執行] 預覽報表。
報表如今會以圓形圖和直條圖顯示摘要銷售資料。
下一步
您已成功完成如何建立自由格式報表的教學課程。
如需清單的詳細資訊,請參閱:
如需查詢設計工具的詳細資訊,請參閱查詢設計工具 (SSRS) 和以文字為基礎的查詢設計工具使用者介面 (報表產生器)。
相關內容
意見反應
即將登場:在 2024 年,我們將逐步淘汰 GitHub 問題作為內容的意見反應機制,並將它取代為新的意見反應系統。 如需詳細資訊,請參閱:https://aka.ms/ContentUserFeedback。
提交並檢視相關的意見反應