What's New in DevTools (Microsoft Edge 86)
To check out the latest features of Microsoft Edge DevTools and the Microsoft Edge DevTools extension for Microsoft Visual Studio Code and Visual Studio, read these announcements.
To stay up to date and get the latest DevTools features, download an Insiders preview version of Microsoft Edge. Whether you're on Windows, Linux, or macOS, consider using Canary (or another preview channel) as your default development browser. The Beta, Dev, and Canary versions of Microsoft Edge run as separate apps, side-by-side with the stable, released version of Microsoft Edge. See Microsoft Edge Insider Channels.
For the latest announcements, follow the Microsoft Edge team on Twitter. To report a problem with DevTools or ask for a new feature, file an issue in the MicrosoftEdge/DevTools repo.
Announcements from the Microsoft Edge DevTools team
Match keyboard shortcuts in DevTools to Visual Studio Code
In Microsoft Edge 86, you can match keyboard shortcuts in the DevTools to your shortcuts in Microsoft Visual Studio Code.
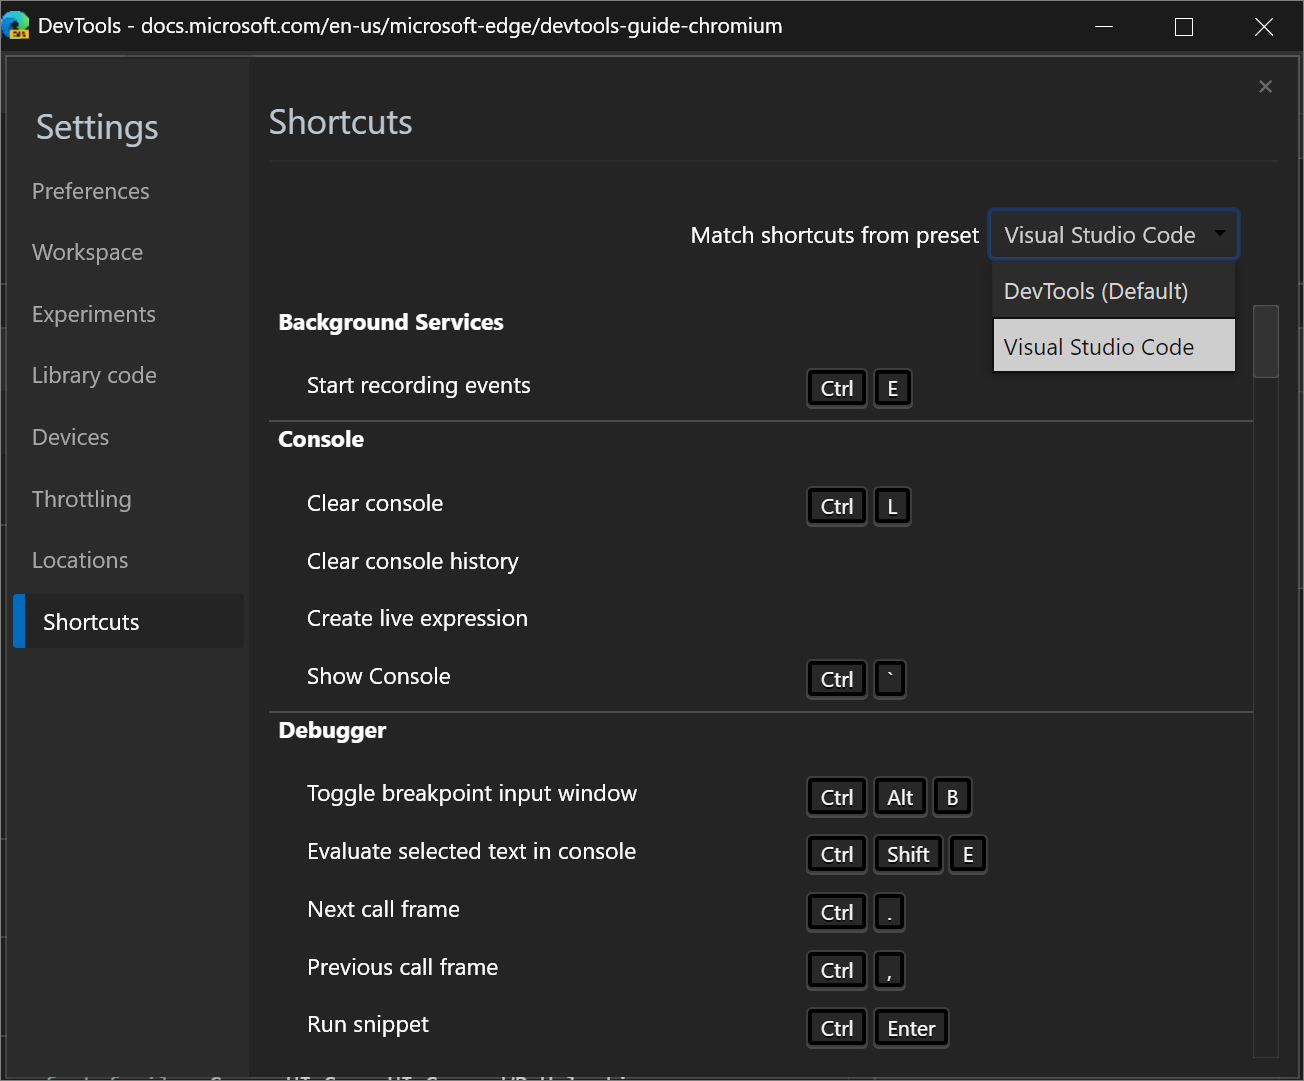
To activate this feature, see Customize keyboard shortcuts in DevTools.
For example, the keyboard shortcut for pausing or continuing running a script in Visual Studio Code is F5. With the DevTools (Default) preset, that same shortcut in DevTools is F8, but when you select the Visual Studio Code preset, that shortcut is now also F5.
Chromium issue #174309
Emulate Surface Duo and Samsung Galaxy Fold
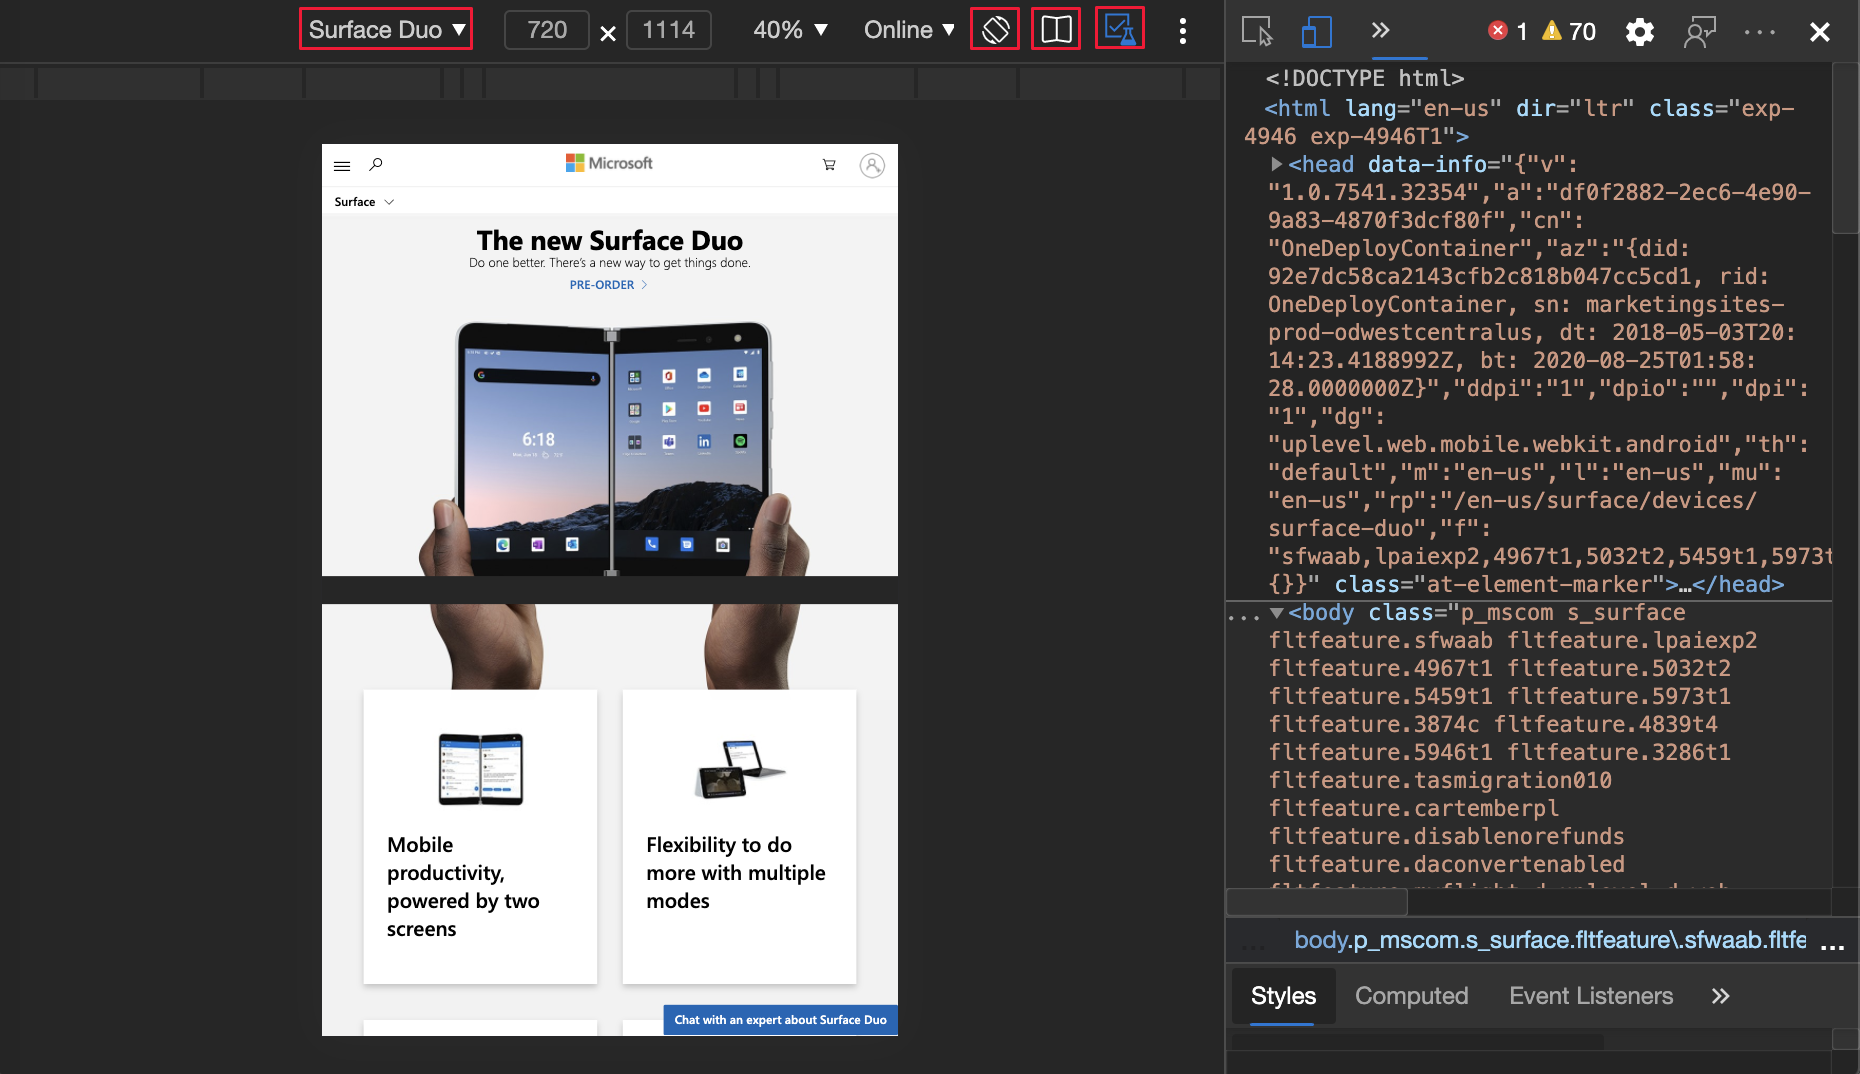
You can now test the look and feel of your website or app on two new devices: Surface Duo and Samsung Galaxy Fold in Microsoft Edge.
To help enhance your website or app for the dual-screen and foldable devices, use the following features when emulating the device:
Spanning, which is when your website (or app) appears across both screens.
Rendering the seam, which is the space between the two screens.
Enabling experimental Web Platform APIs to access the new CSS media screen-spanning feature and JavaScript getWindowSegments API.
Update: This feature has been released and is no longer experimental.
See also:
Chromium issue: #1054281
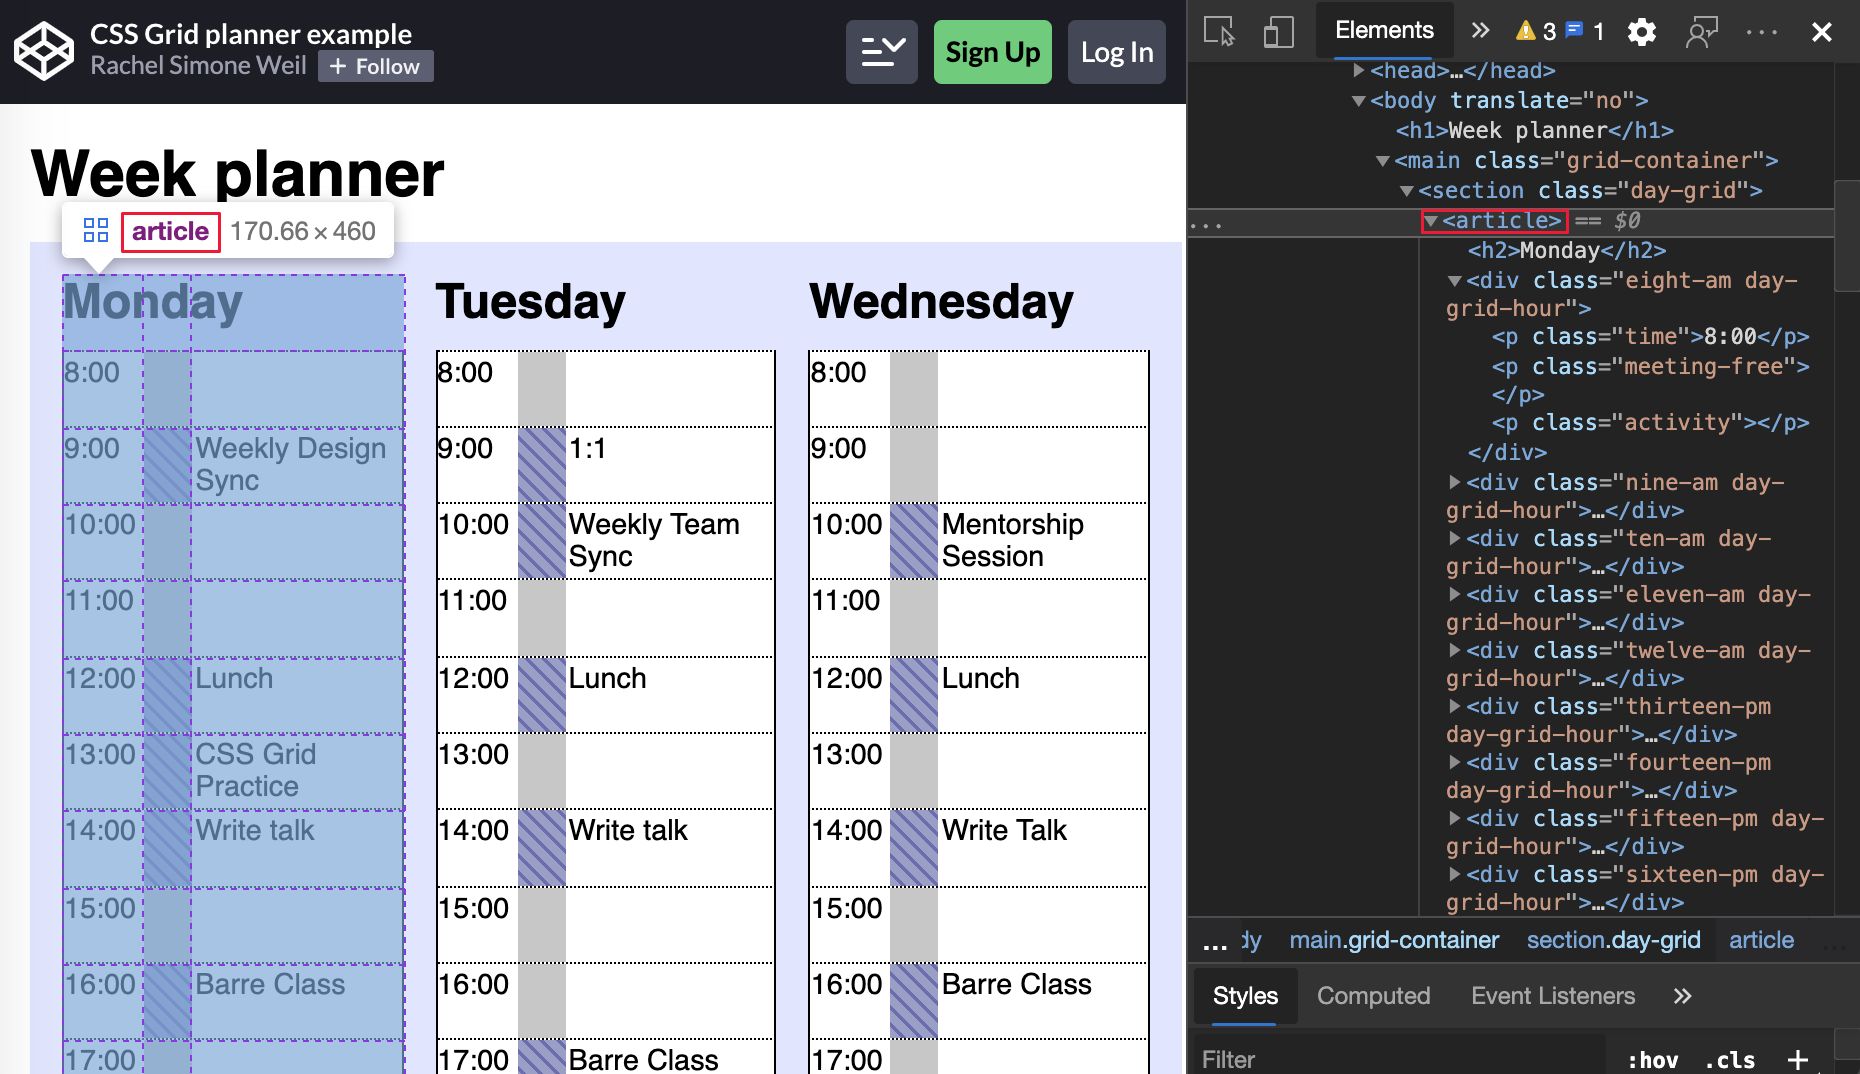
CSS grid overlay improvements and new experimental grid features
The Microsoft Edge DevTools team and the Chrome DevTools team collaborate on additional features. The new features include multiple overlays that are persistent and configurable from a new Layout pane on the Elements tool:
Update: This feature has been released and is no longer experimental.
See also:
- CSS grid debugging features in What's New in DevTools (Microsoft Edge 85).
- Inspect CSS Grid in Microsoft Edge DevTools.
Chromium issue: #1047356
Table copied from the Console preserves formatting
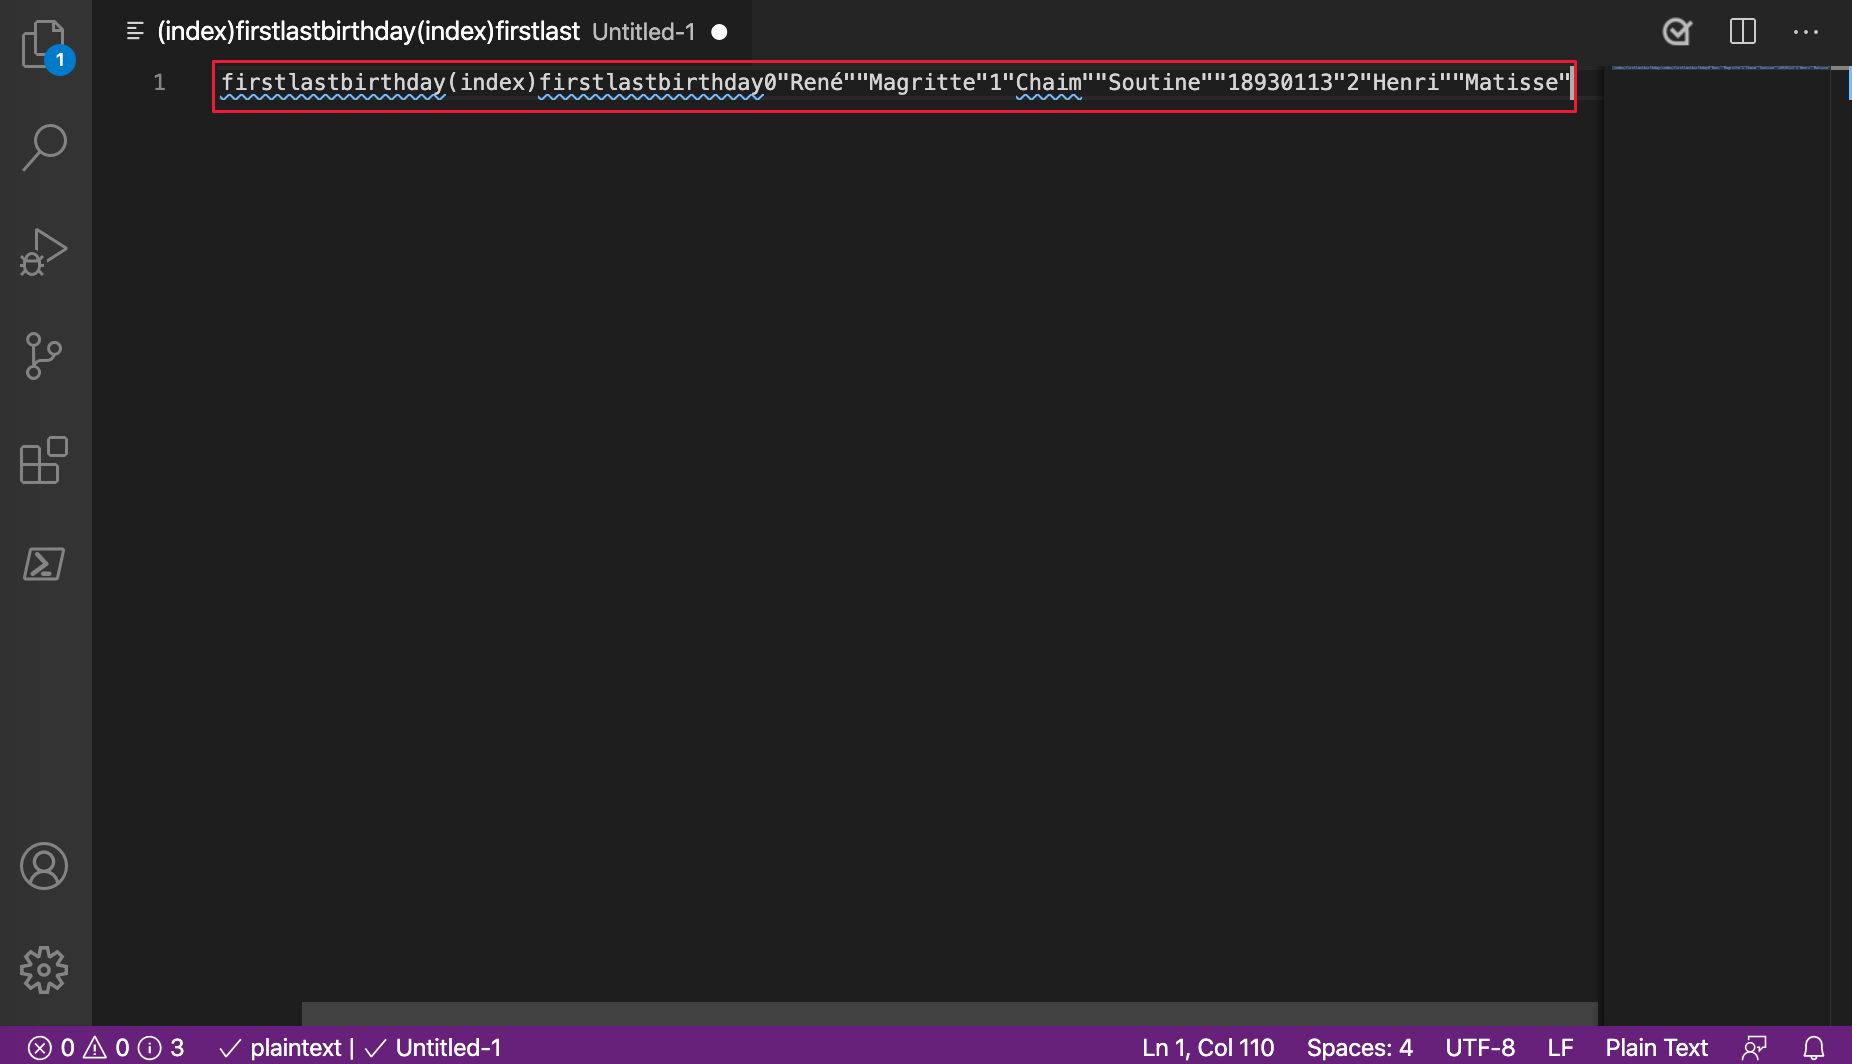
In Microsoft Edge 85 or earlier, in the Console, the formatting of a copied console.table was lost. If you copied the output from the table Console API, and pasted it, only the text of the table was kept.
table Console API output in Microsoft Edge 85 or earlier:
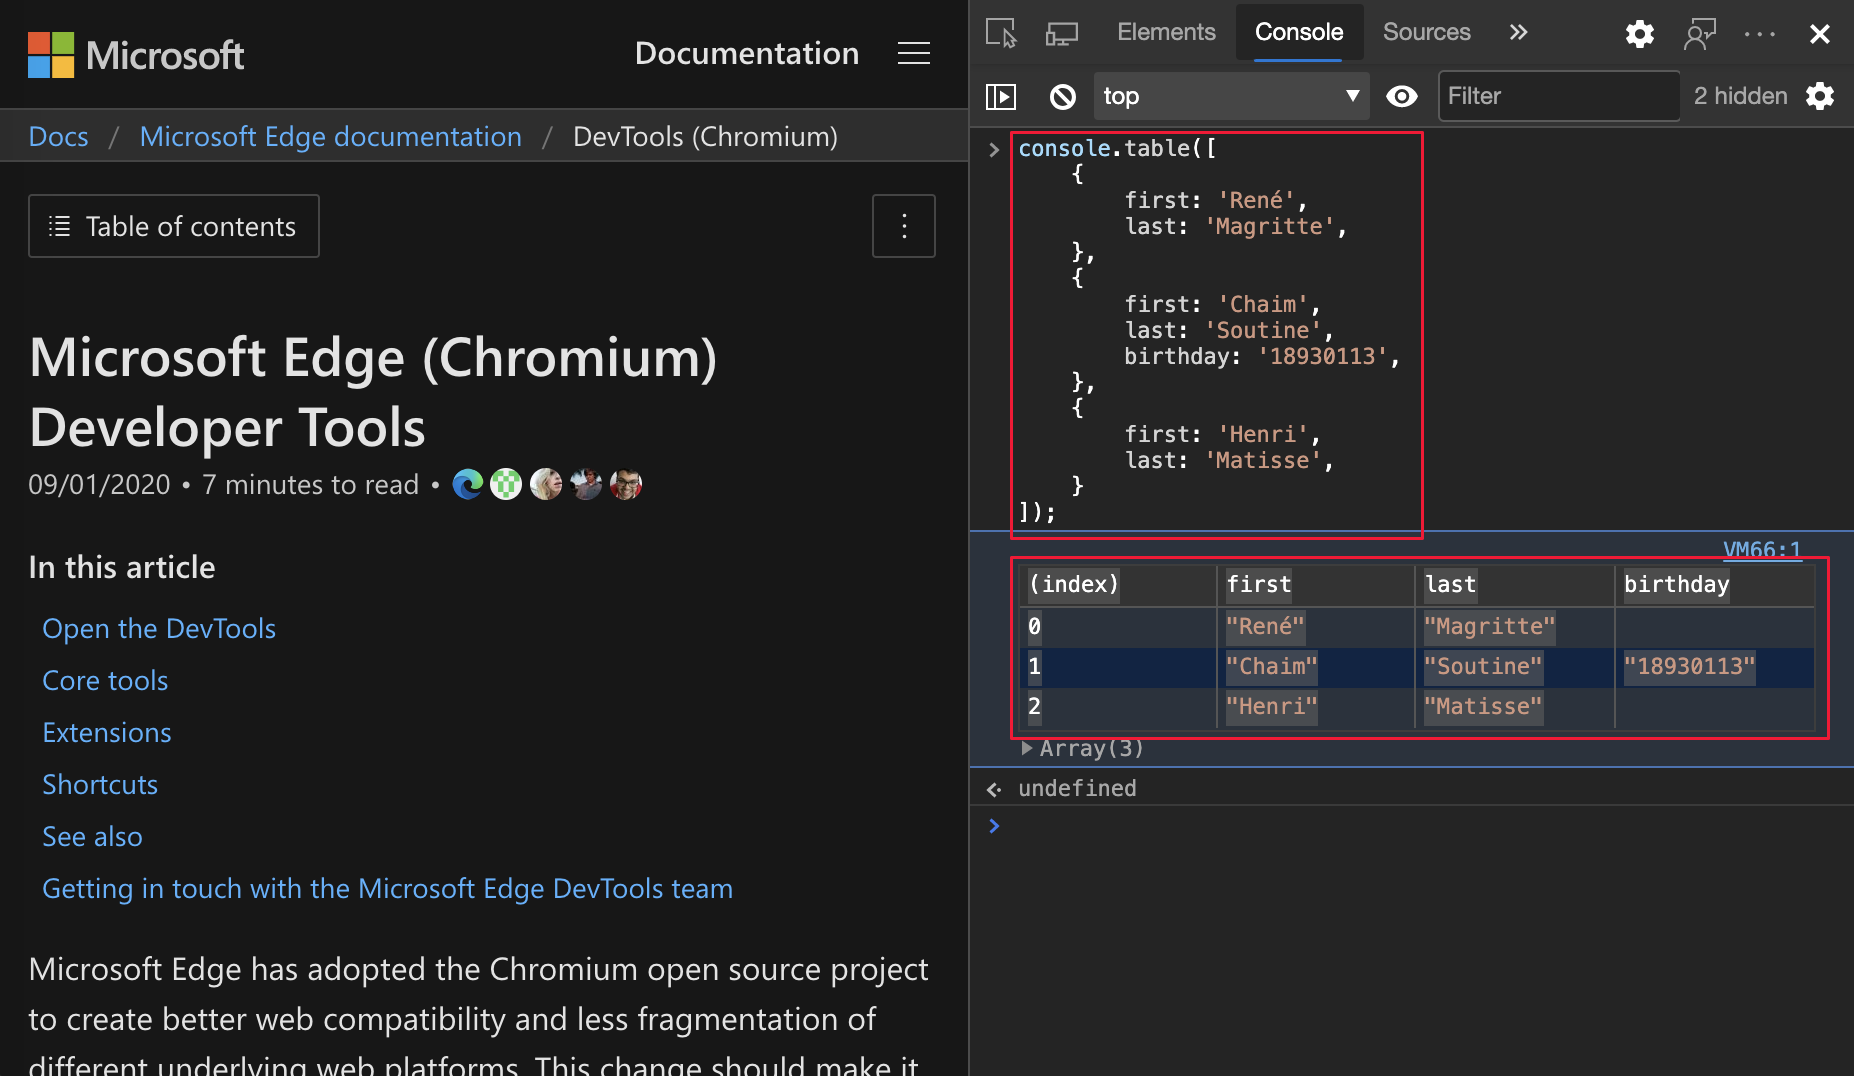
table Console API output from Microsoft Edge 85 or earlier pasted into Visual Studio Code:
In Microsoft Edge 86 or later, when you copy a table from the Console, the formatting is now preserved.
table Console API output in Microsoft Edge 86 or later:
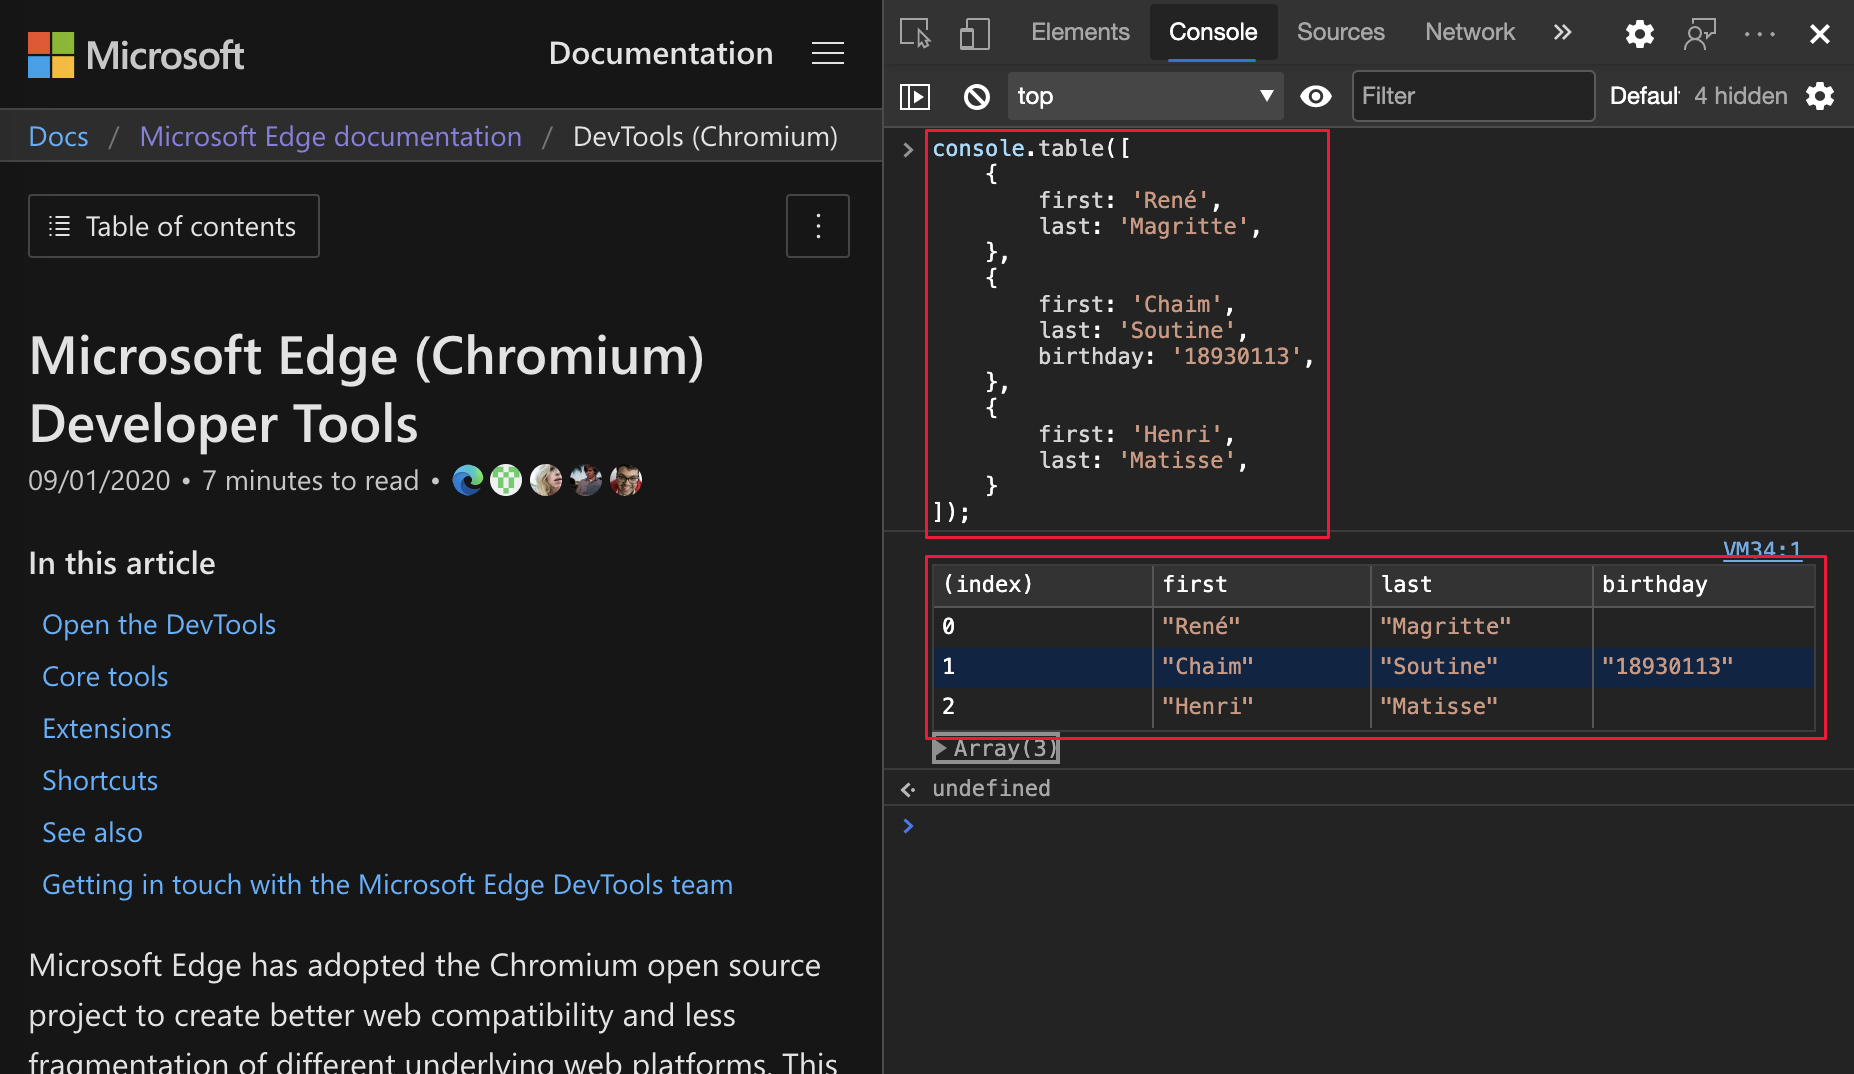
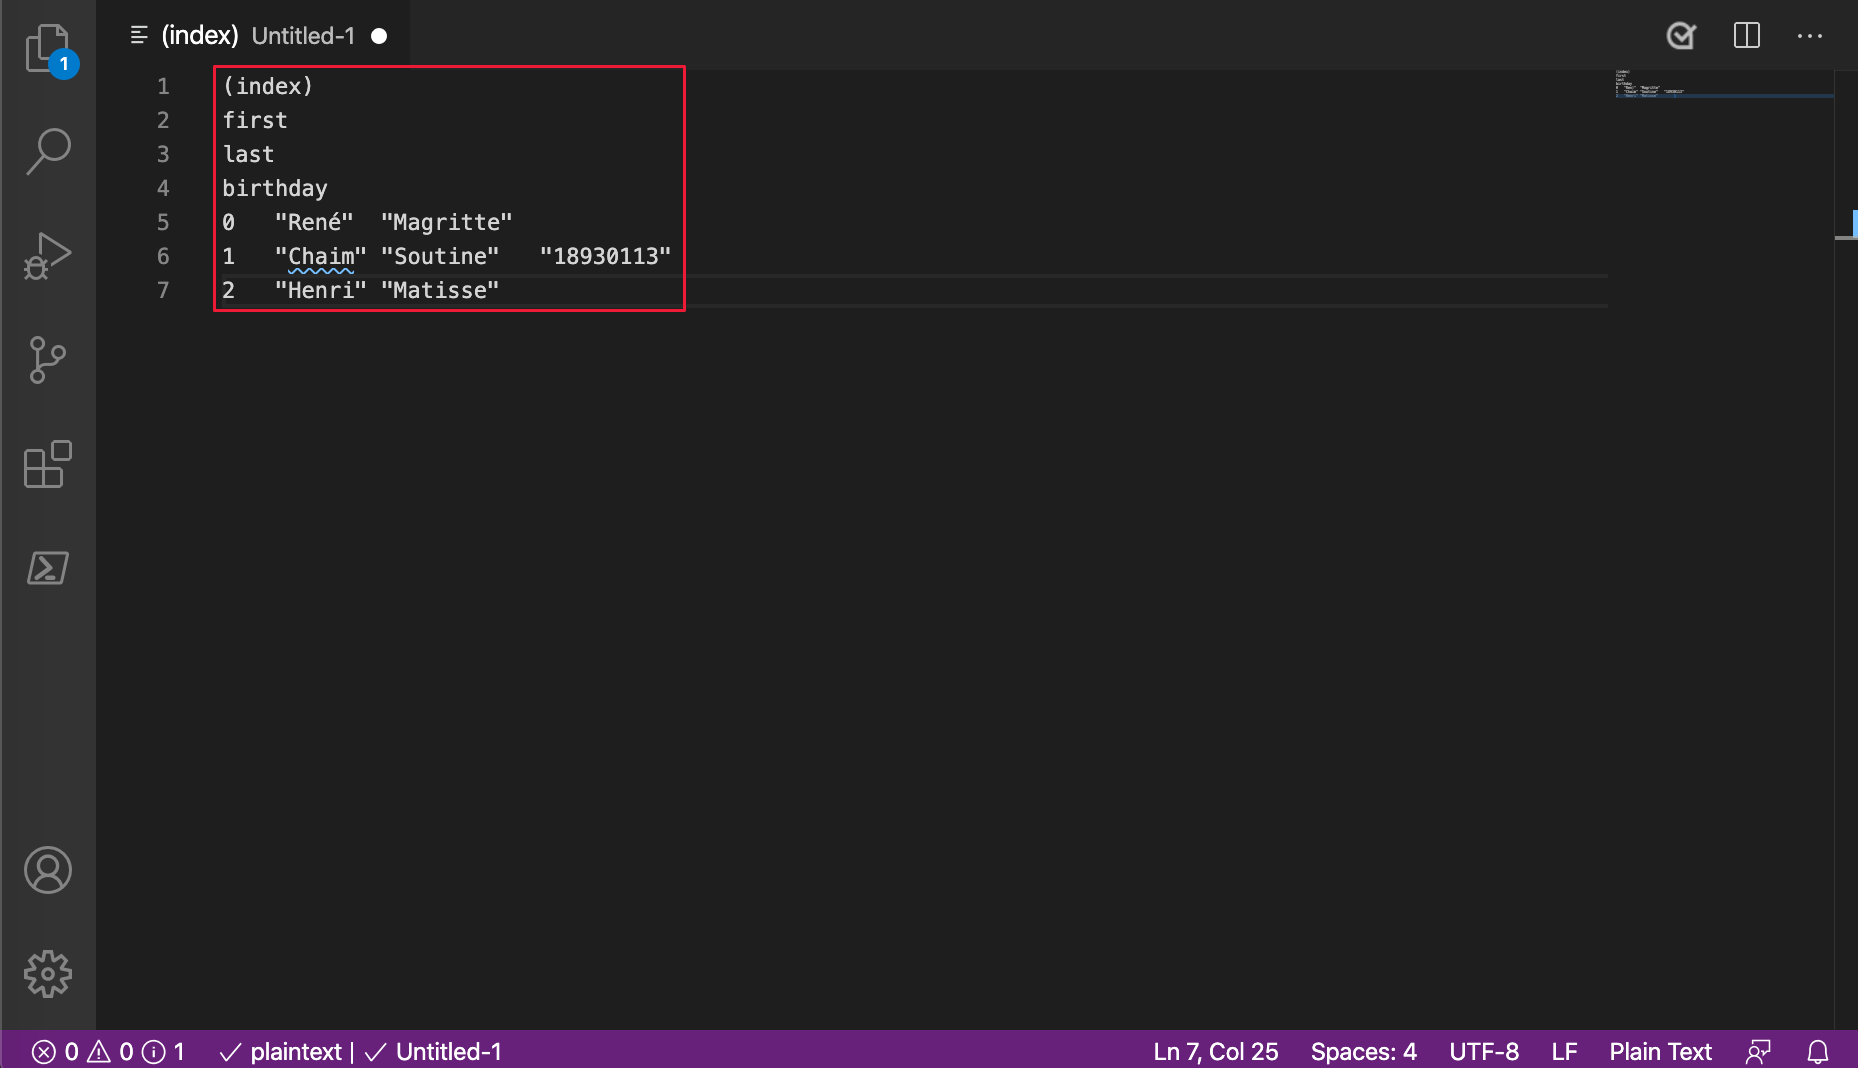
table Console API output from Microsoft Edge 86 or later pasted into Visual Studio Code:
Chromium issue: #1115011
See also:
Source Order Viewer for easier accessibility testing
The new accessibility helper displays the order in which elements reside in the source file:
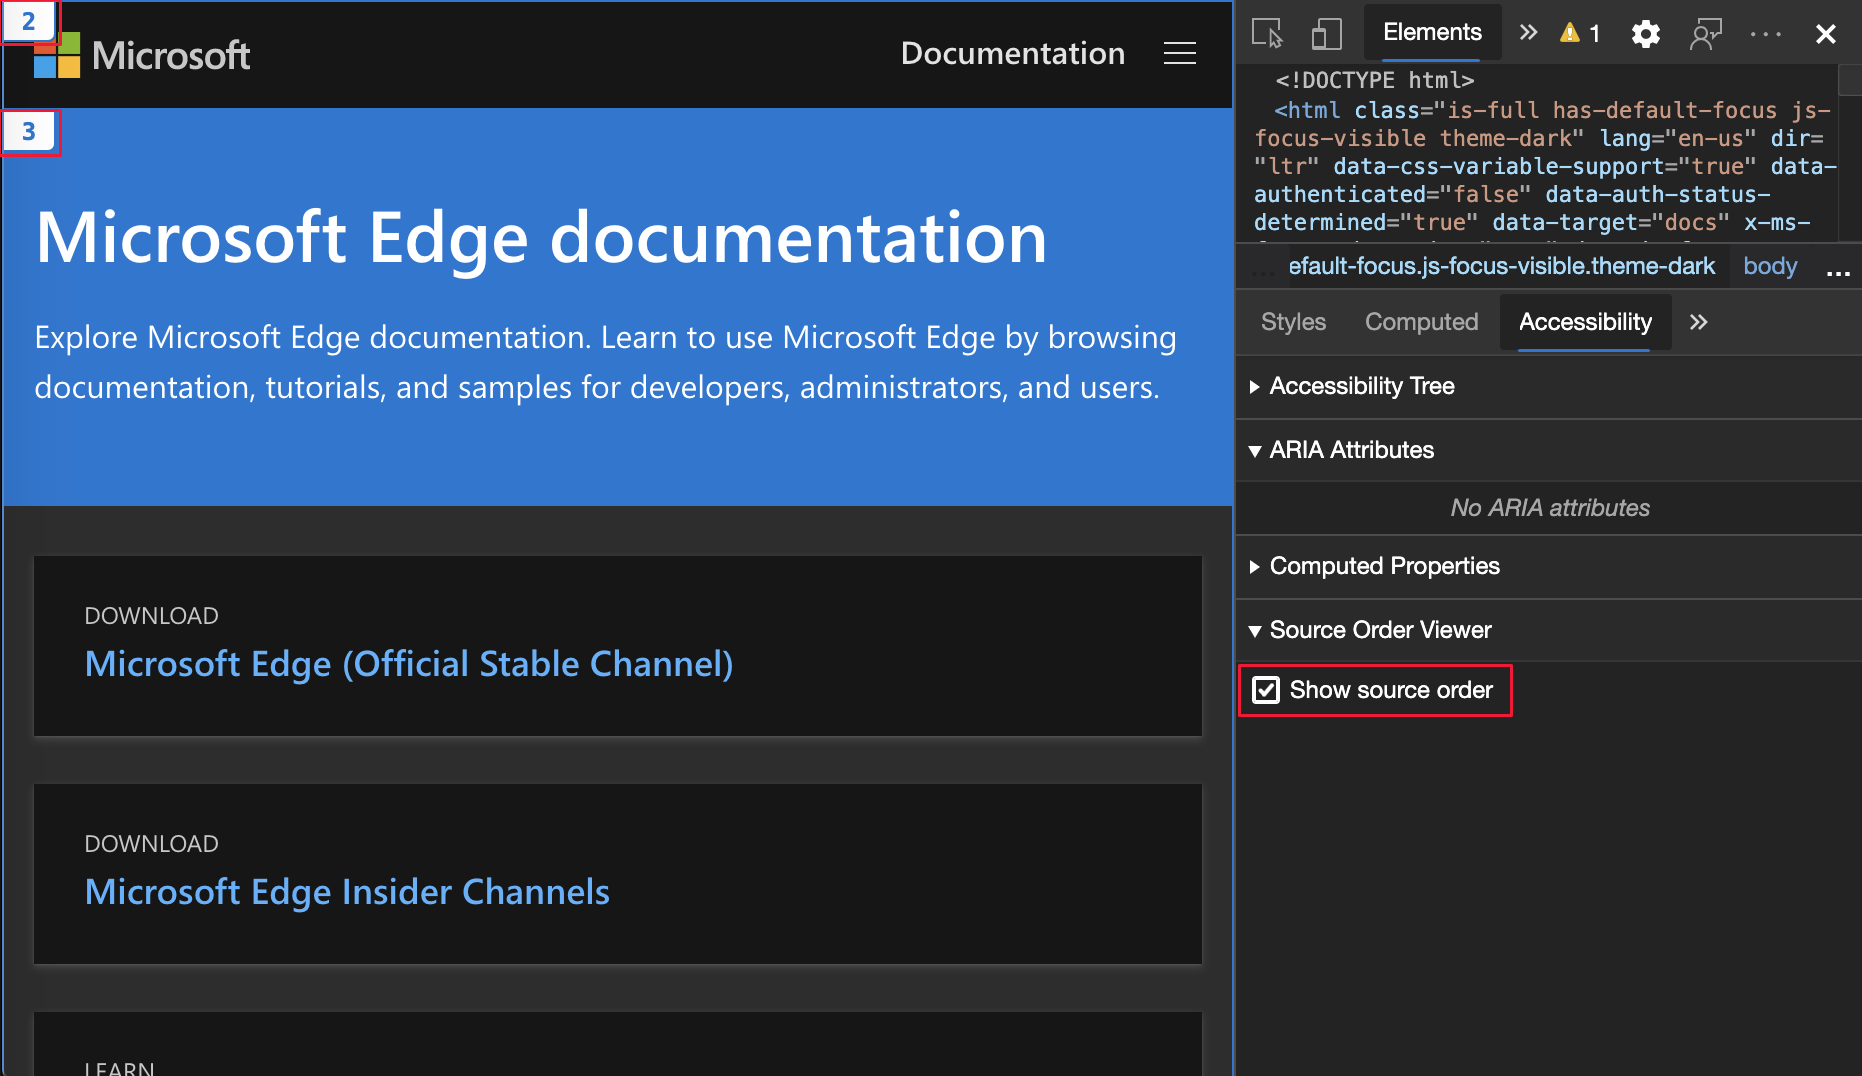
This feature makes it easier to test the way screen reader and keyboard users experience your website or app. Screen readers and keyboard navigation depend on content being placed in a particular order in the source code of your website or app, so that it matches the rendered page. The Source Order Viewer displays potential differences in order between the rendered page and the source code.
Update: This feature has been released and is no longer experimental.
See also:
Chromium issue: #1094406
Highlight all search results in Elements tool
In Microsoft Edge 84 and 85, the first search result in the Elements tool did not highlight. The remaining search results were highlighted correctly.
Thank you for sending your feedback and helping improve Chromium. Your feedback uncovered Issue #1103316 in the open-source Chromium project.
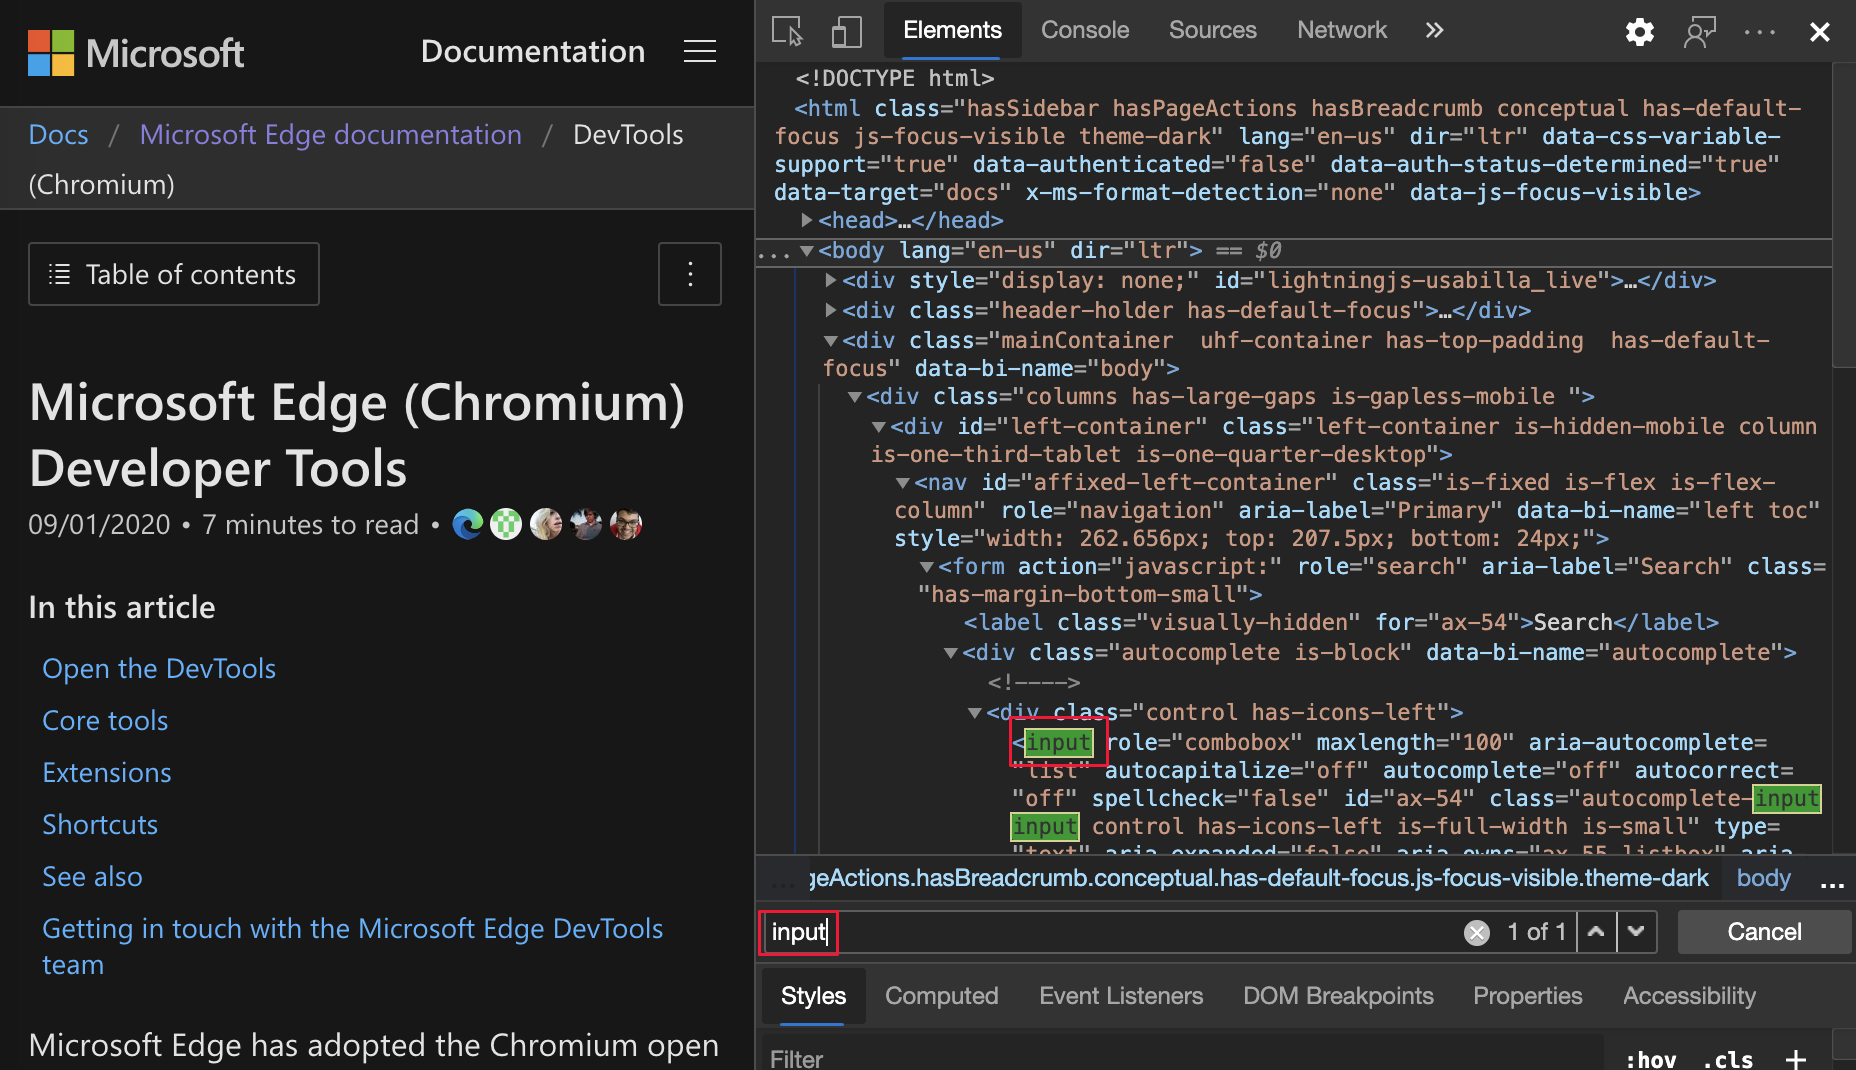
The issue is now fixed in all versions of Microsoft Edge.
Chromium issue: #1103316
See also:
- Search for nodes in Get started viewing and changing the DOM
Announcements from the Chromium project
The following sections announce additional features available in Microsoft Edge that were contributed to the open-source Chromium project.
New Media tool
DevTools now displays media players information in the Media tool.
To open the new Media tool, select Customize and control DevTools (...) > More tools > Media.
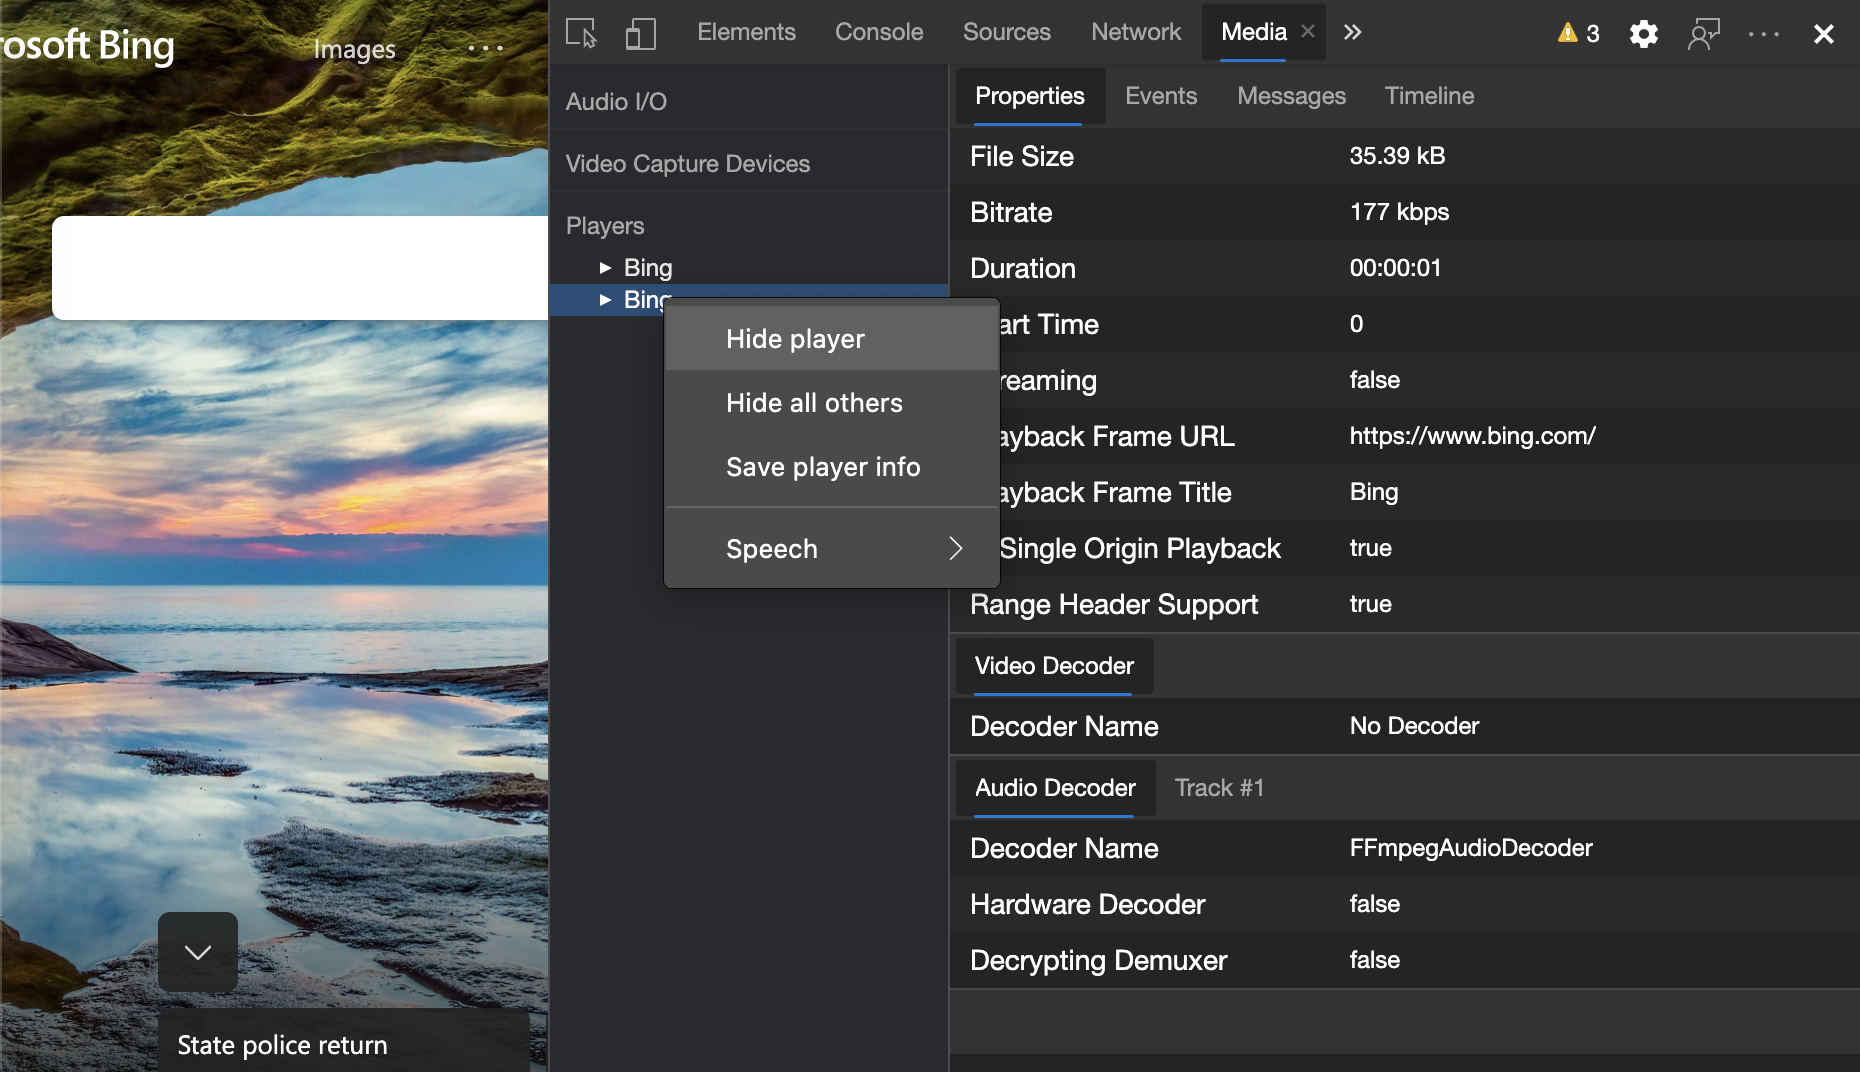
Before the new Media tool in DevTools, the logging and debug information about video players was located under the Recent Players setting. To open the Recent Players setting, go to edge://media-internals and then select the Players tool.
View live content and inspect potential issues more quickly, such as investigating:
- Why frames are dropped.
- Why JavaScript is interacting with the player in an unexpected way.
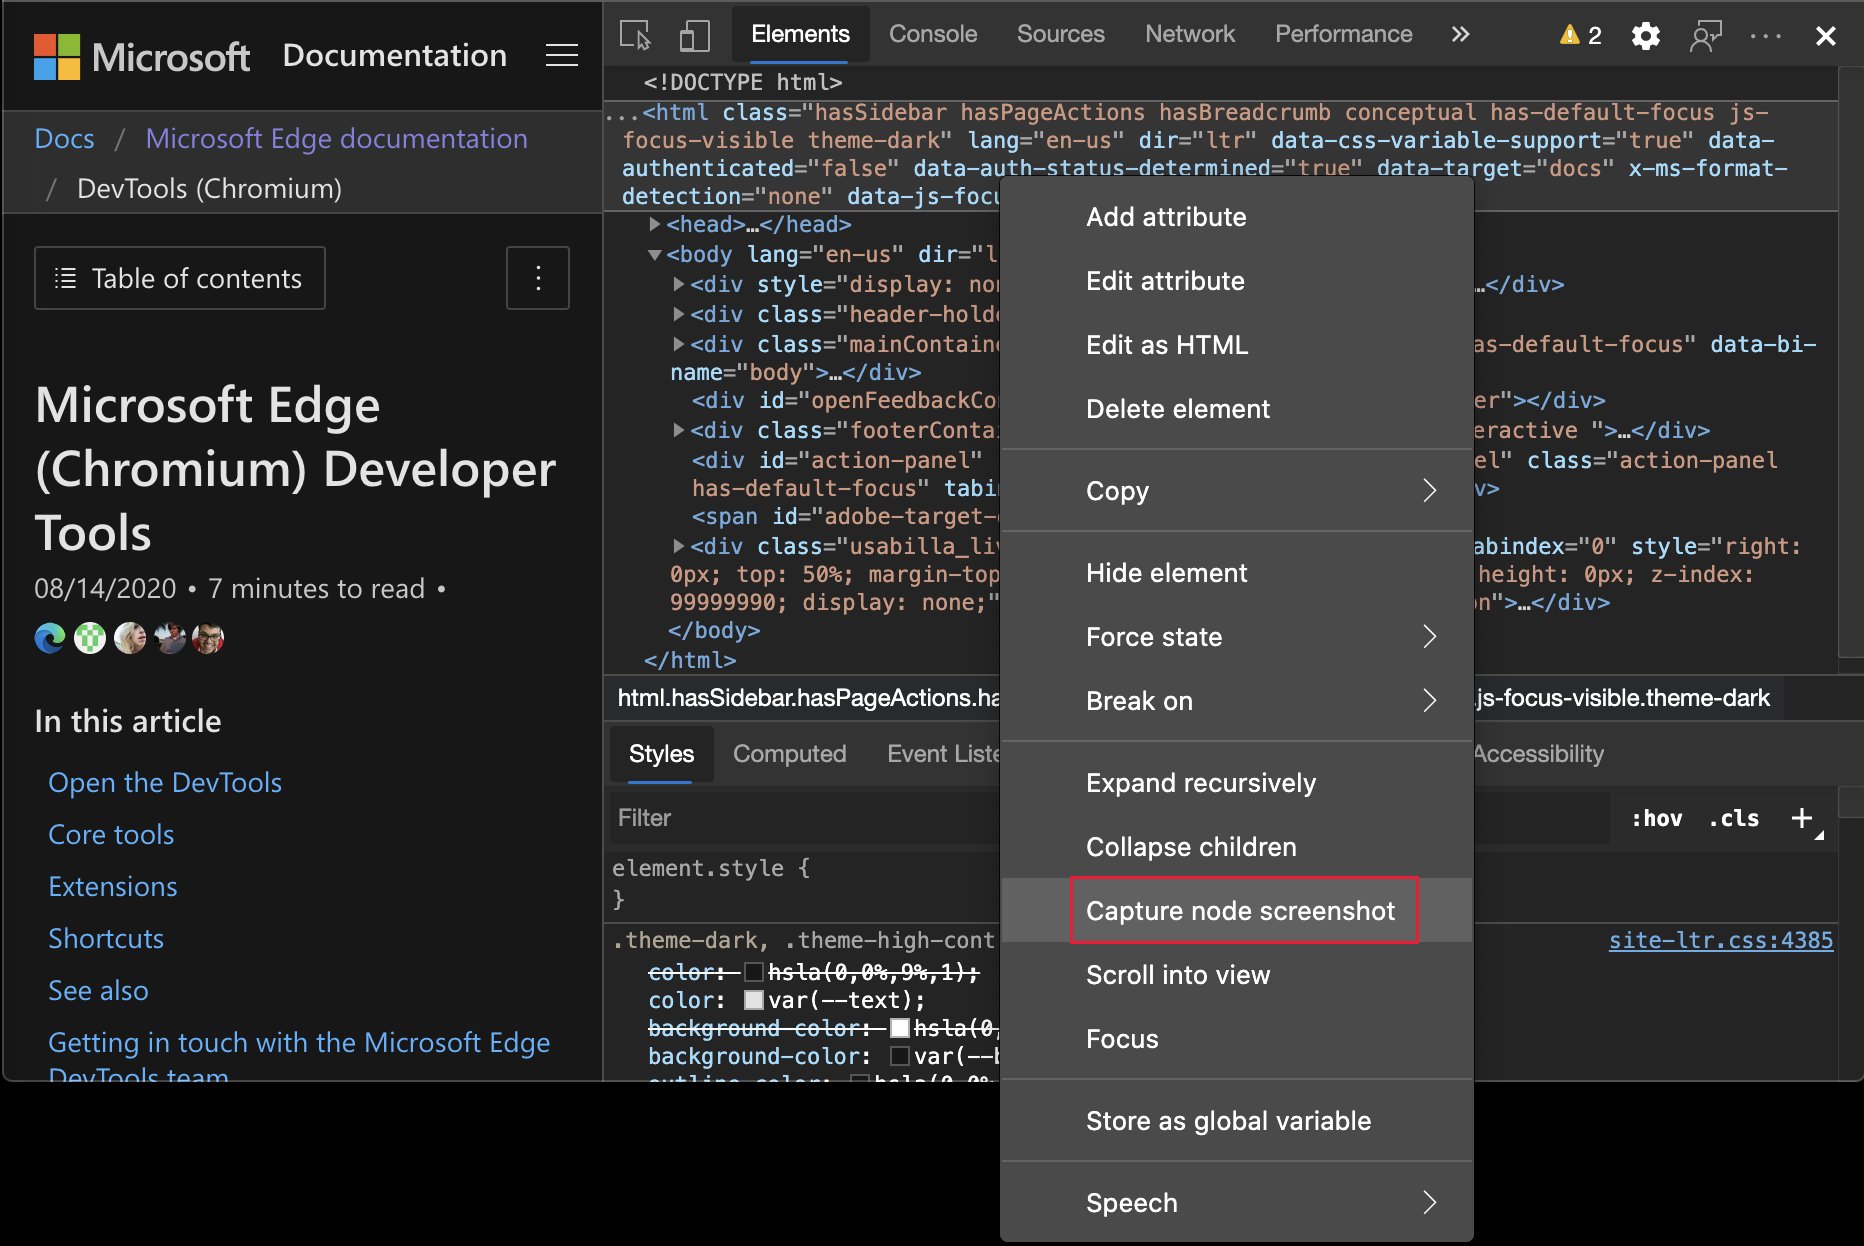
Capture node screenshots using the Elements tool context menu
You can now capture node screenshots using the right-click menu in the Elements tool.
For example, to take a screenshot of the table of contents, right-click the element, and then select Capture node screenshot.
Chromium issue: #1100253
See also:
- Capture node screenshot beyond viewport in What's New in DevTools (Microsoft Edge 89)
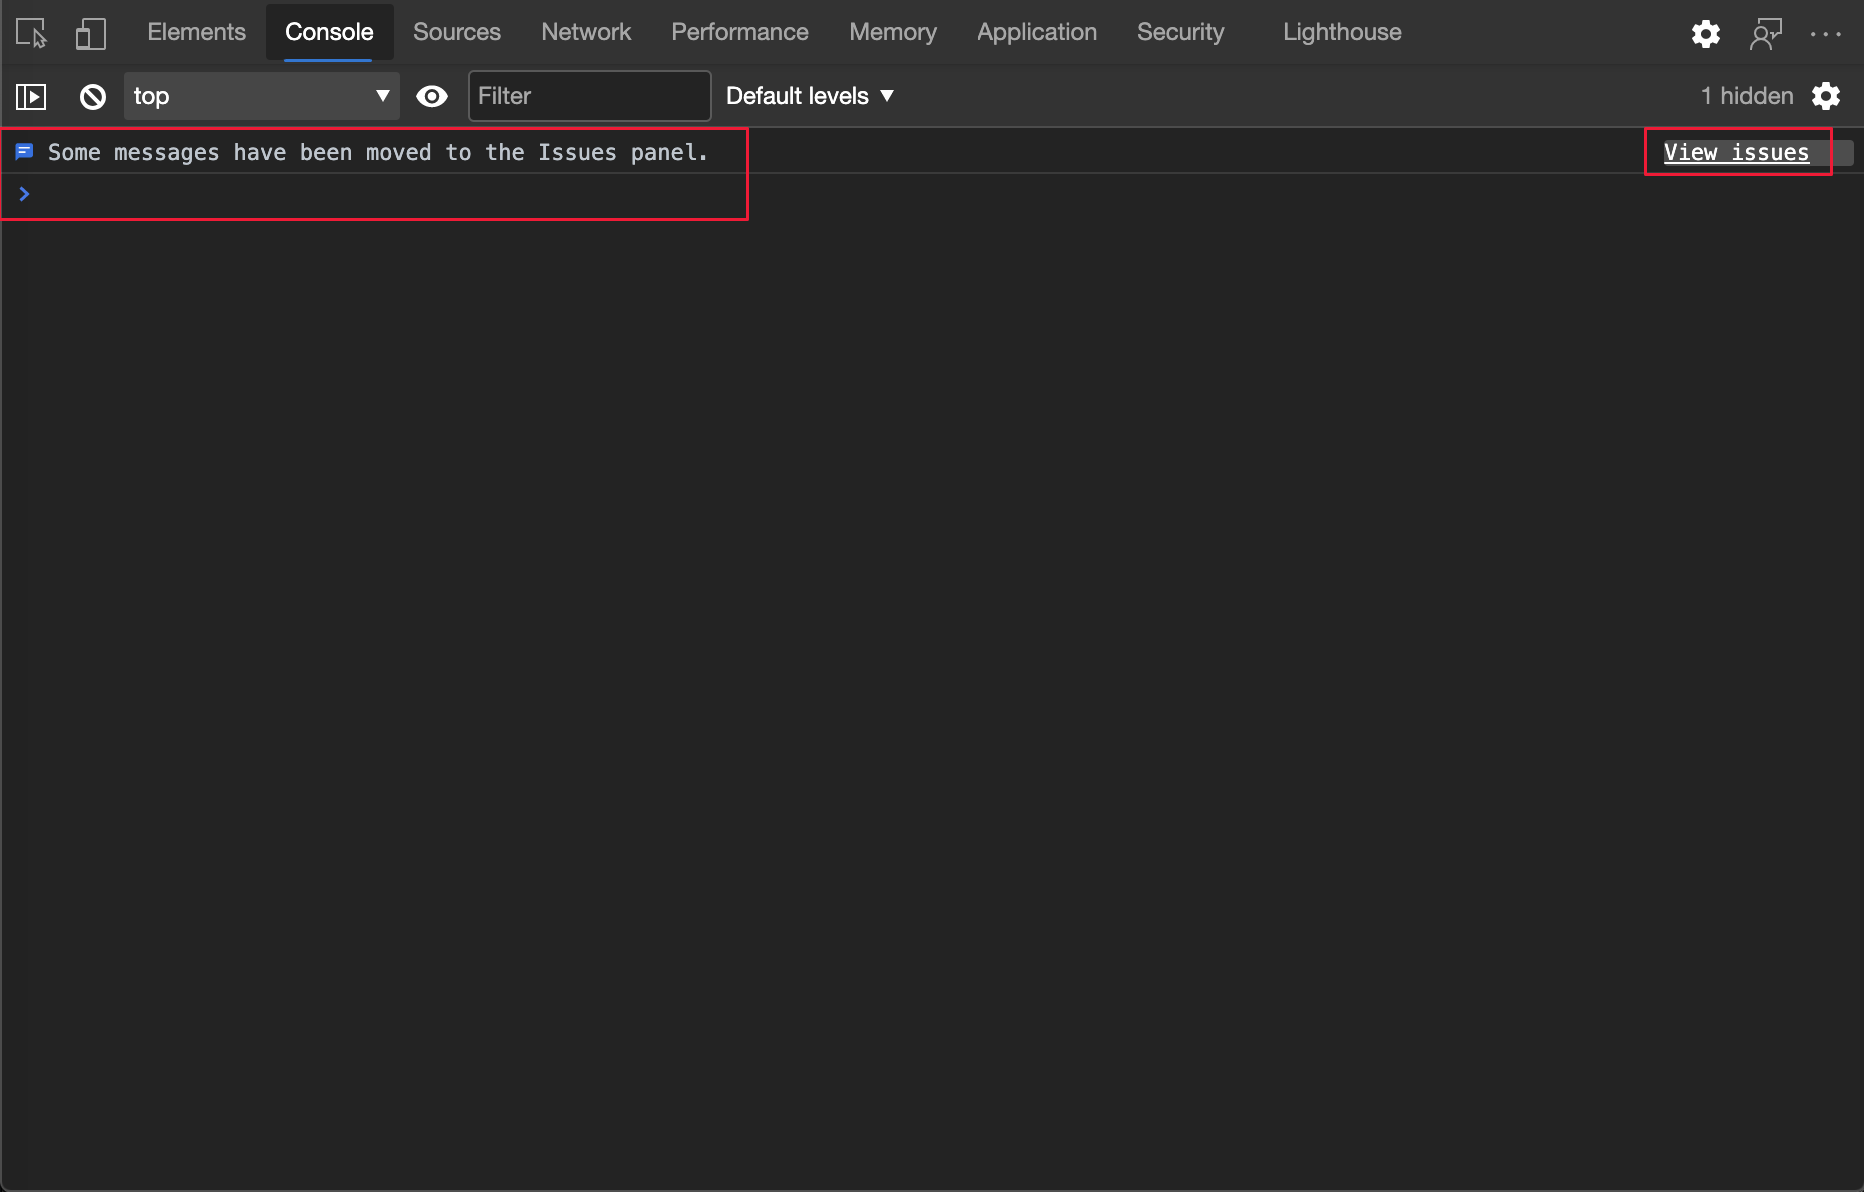
Issues tool updates
The Issues warning bar on the Console tool is now replaced with a regular message.
See also:
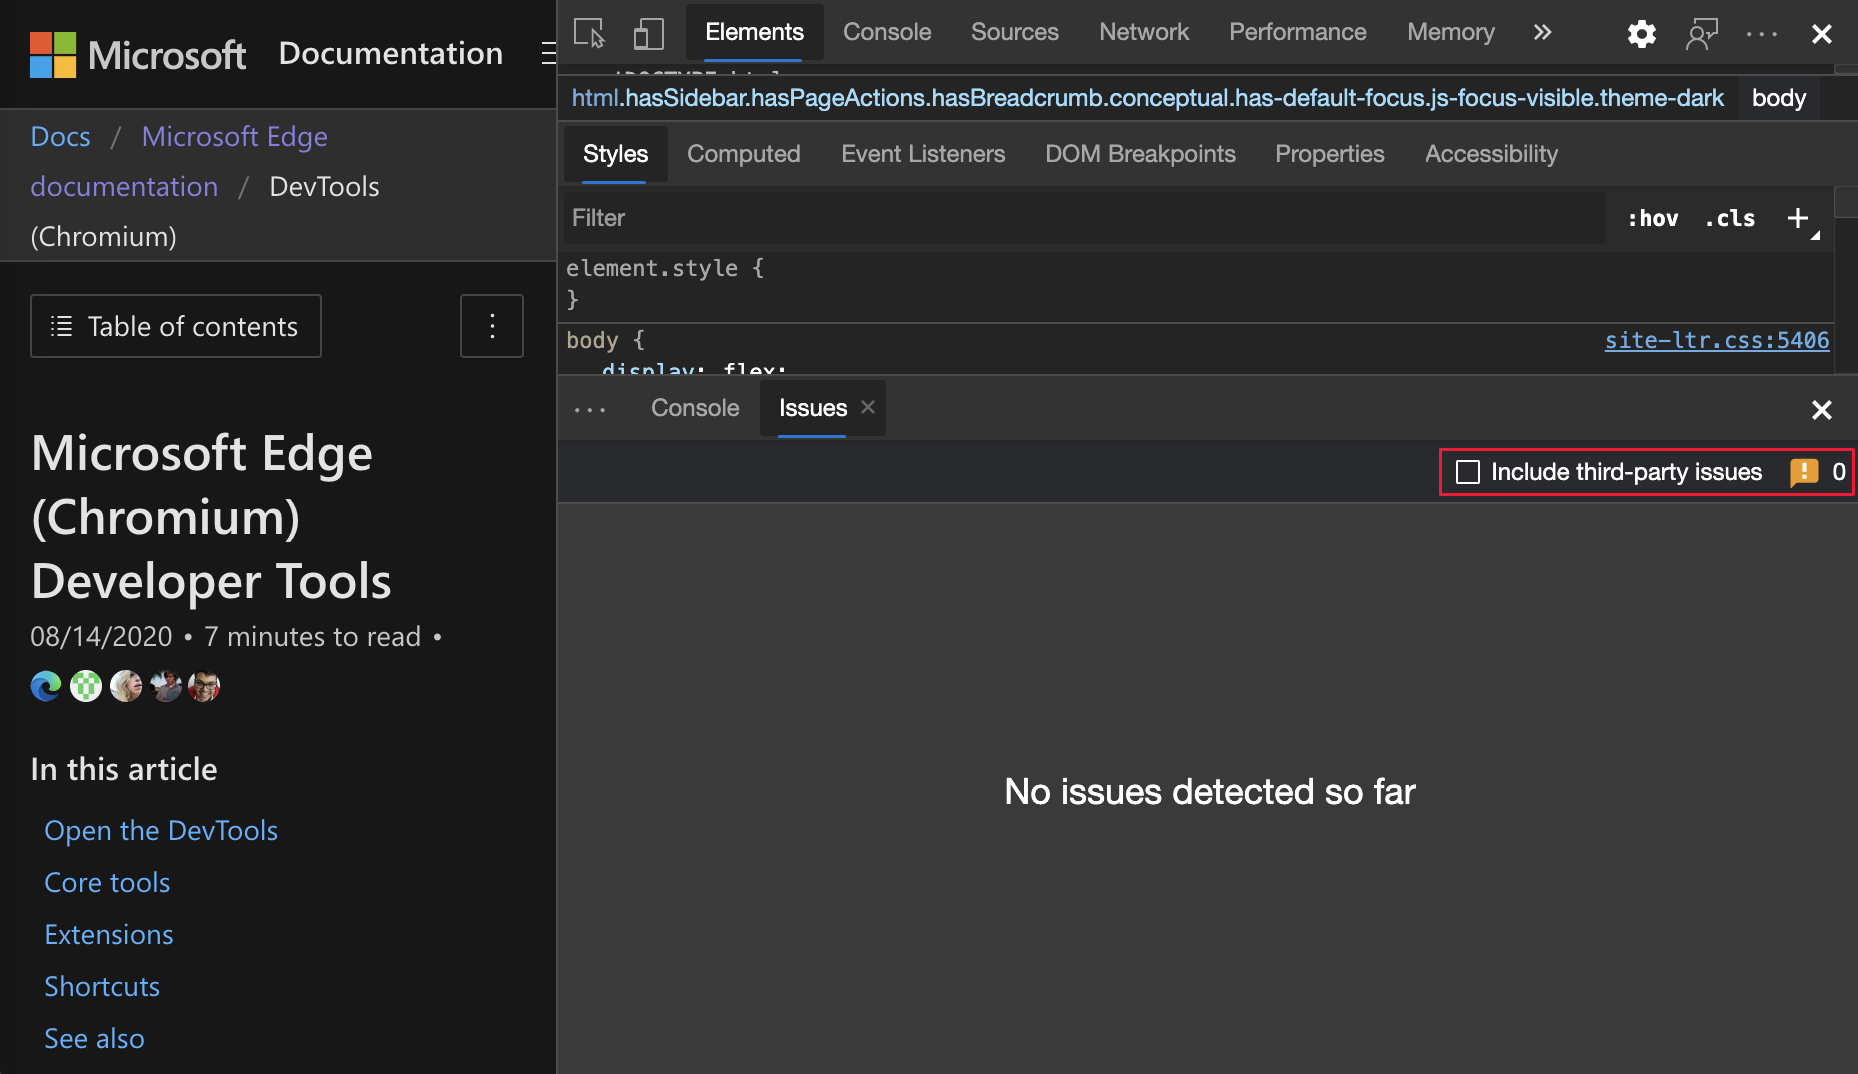
Third-party issues
Third-party issues are now hidden by default in the Issues tool. Select the new Include third-party issues checkbox to view the issues.
Chromium issues: 1096481, 1068116, 1080589
For more information, see Filter issues by origin in Find and fix problems using the Issues tool.
Emulate missing local fonts
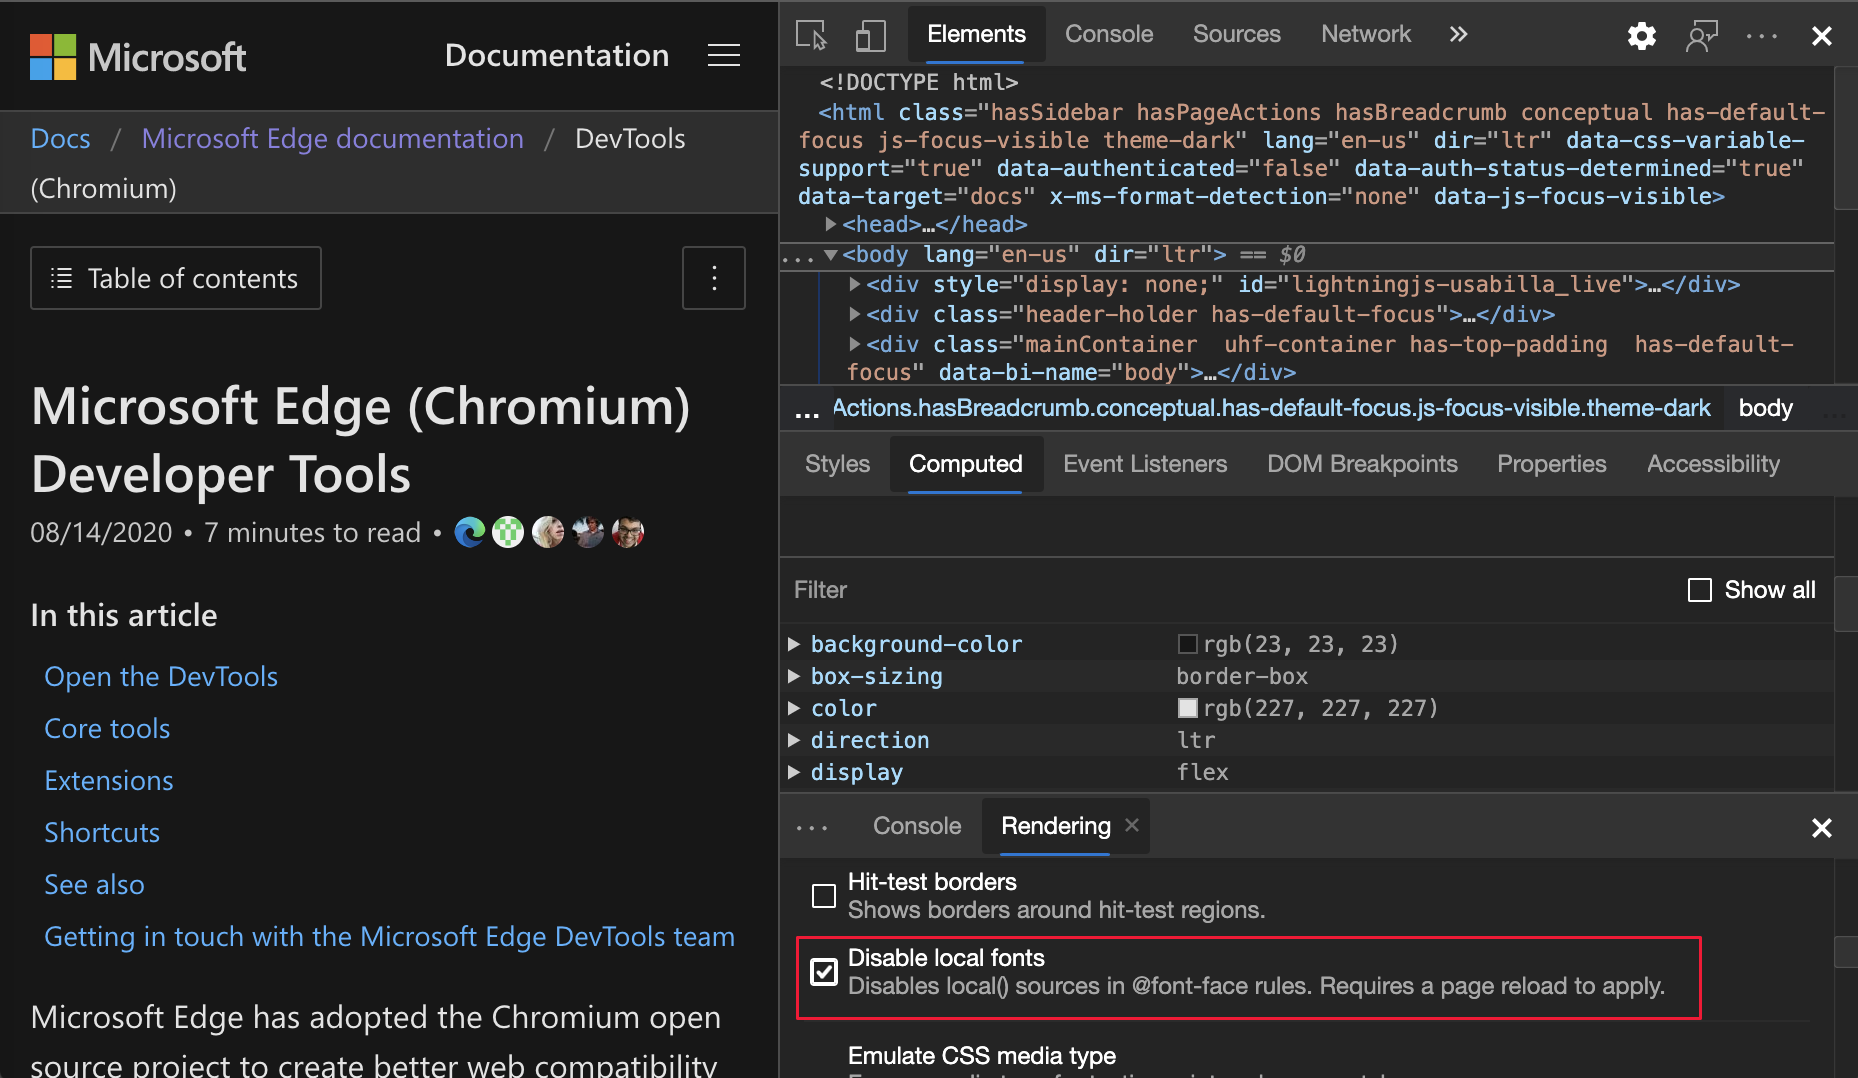
In the Rendering tool, use the new Disable local fonts checkbox to emulate missing local() sources in @font-face rules.
For example, when the Rubik font is installed on your device and the @font-face src rule uses it as a local() font, Microsoft Edge uses the local font file from your device.
When Disable local fonts is selected, DevTools ignores the local() fonts and fetches each font from the network:
This feature is useful if you use two different copies of the same font during development, such as:
- A local font for your design tools.
- A web font for your code.
Use Disable local fonts to make it easier to:
- Debug and measure loading performance and optimization of web fonts.
- Verify accuracy of your CSS
@font-facerules. - Discover differences between local versions installed on your device and a web font.
Chromium issue: #384968
For more information, see Disable local fonts in Performance features reference.
See also Analyze rendering performance with the Rendering tool in Performance features reference.
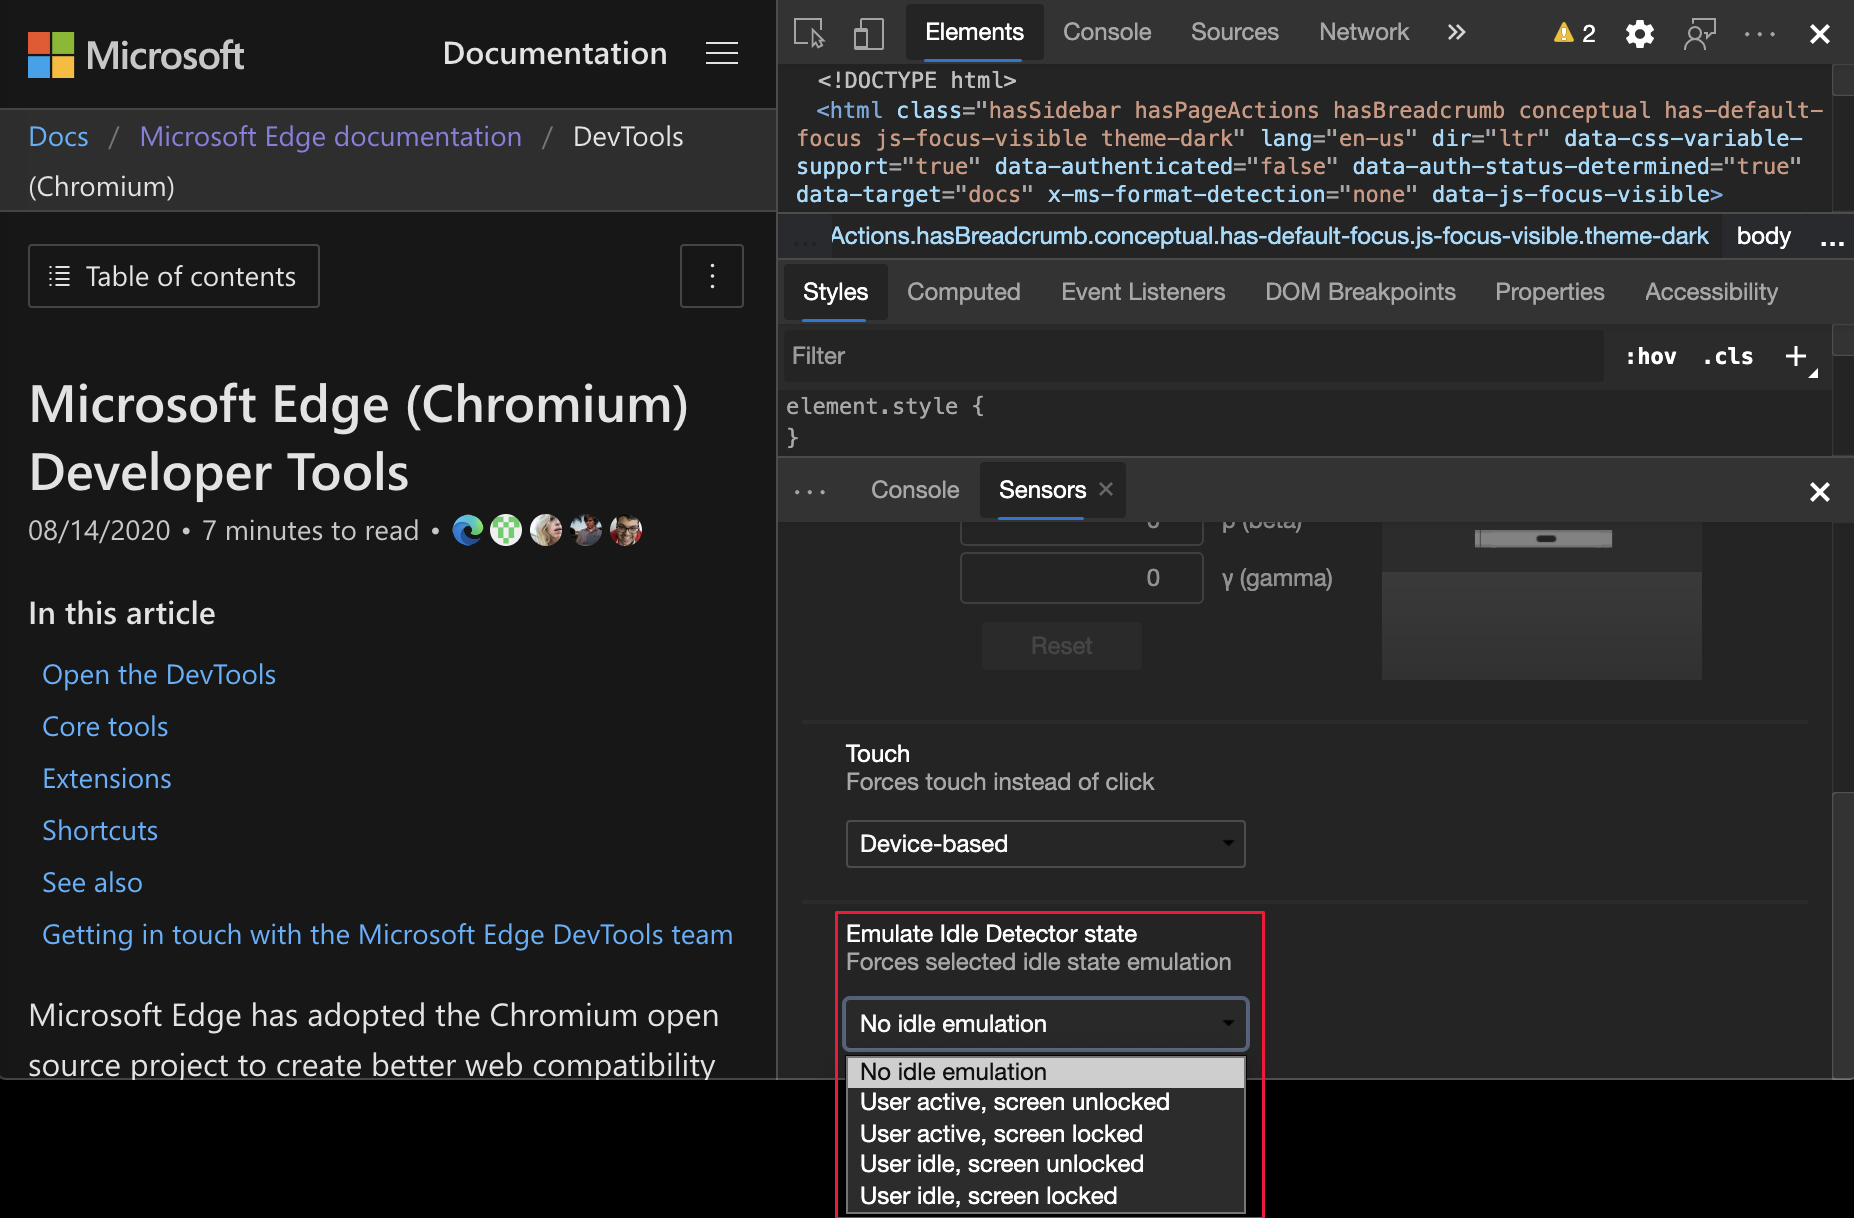
Emulate inactive users
The Idle Detection API allows developers to detect inactive users and react on idle state changes. You can now use DevTools to emulate idle state changes in the Sensors tool for both the user state and the screen state instead of waiting for the actual idle state to change. You can open the Sensors tool from the Drawer.
Chromium issue: #1090802
See also:
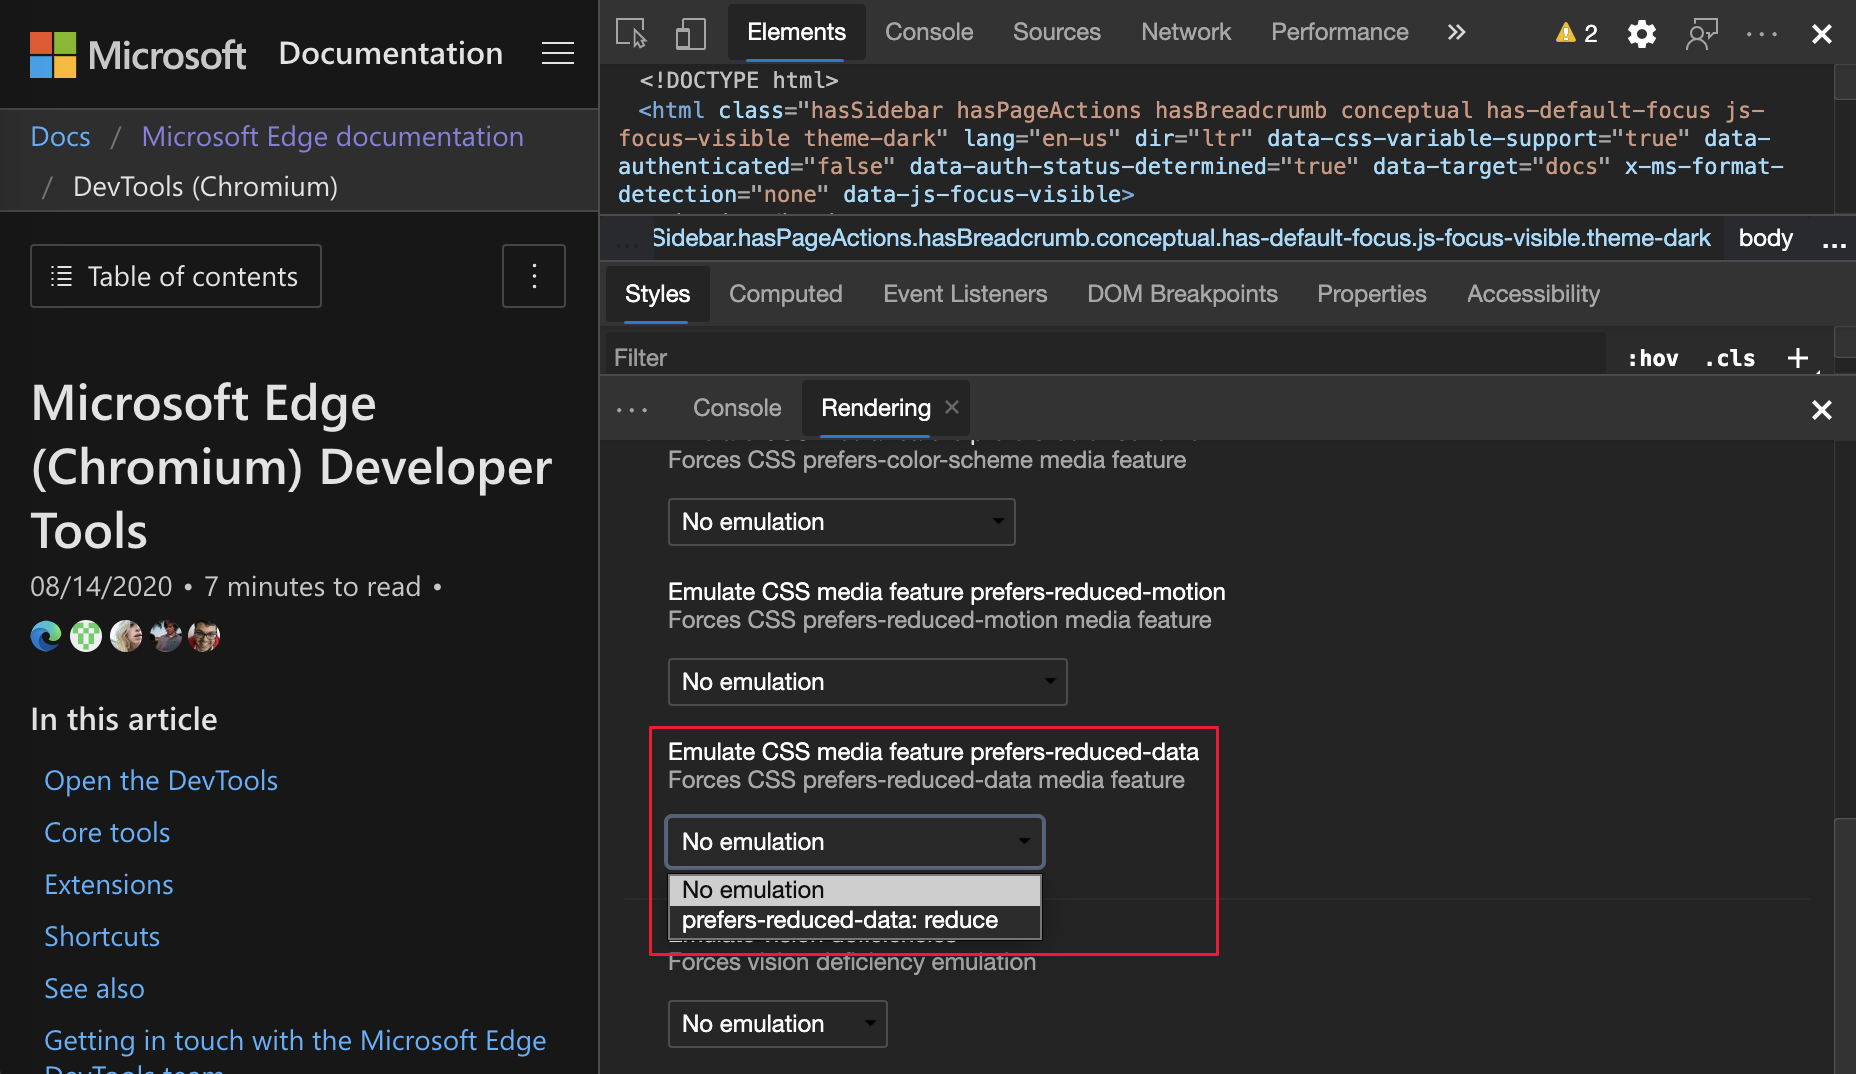
Emulate prefers-reduced-data
Note
In Microsoft Edge 86, to enable this feature, go to edge://flags#enable-experimental-web-platform-features and turn on the Experimental Web Platform features flag. The emulation option is only displayed if the flag is enabled.
The prefers-reduced-data media query detects user content preferences for reduced data. If selected, the user receives alternate page content that uses less data.
You can now use DevTools to emulate the prefers-reduced-data media query, in the Rendering tool:
Chromium issue: #1096068
See also:
Support for new JavaScript features
DevTools now has better support for the following JavaScript language features:
| JavaScript language feature | Details |
|---|---|
| Logical assignment operators | DevTools now supports logical assignment with the new &&=, ||=, and ??= operators in the Console and Sources tools. |
| Pretty-print numeric separators | DevTools now properly pretty-prints the numeric separators in the Sources tool. |
Chromium issues: 1086817, 1080569
See also:
- Run JavaScript in the Console
- Using the Editor pane to view or edit files in Sources tool overview
Lighthouse 6.2 in the Lighthouse panel
The Lighthouse tool is now running Lighthouse 6.2. For a full list of changes, see the Lighthouse release notes.
Chromium issue: #772558
For more information, see Lighthouse tool.
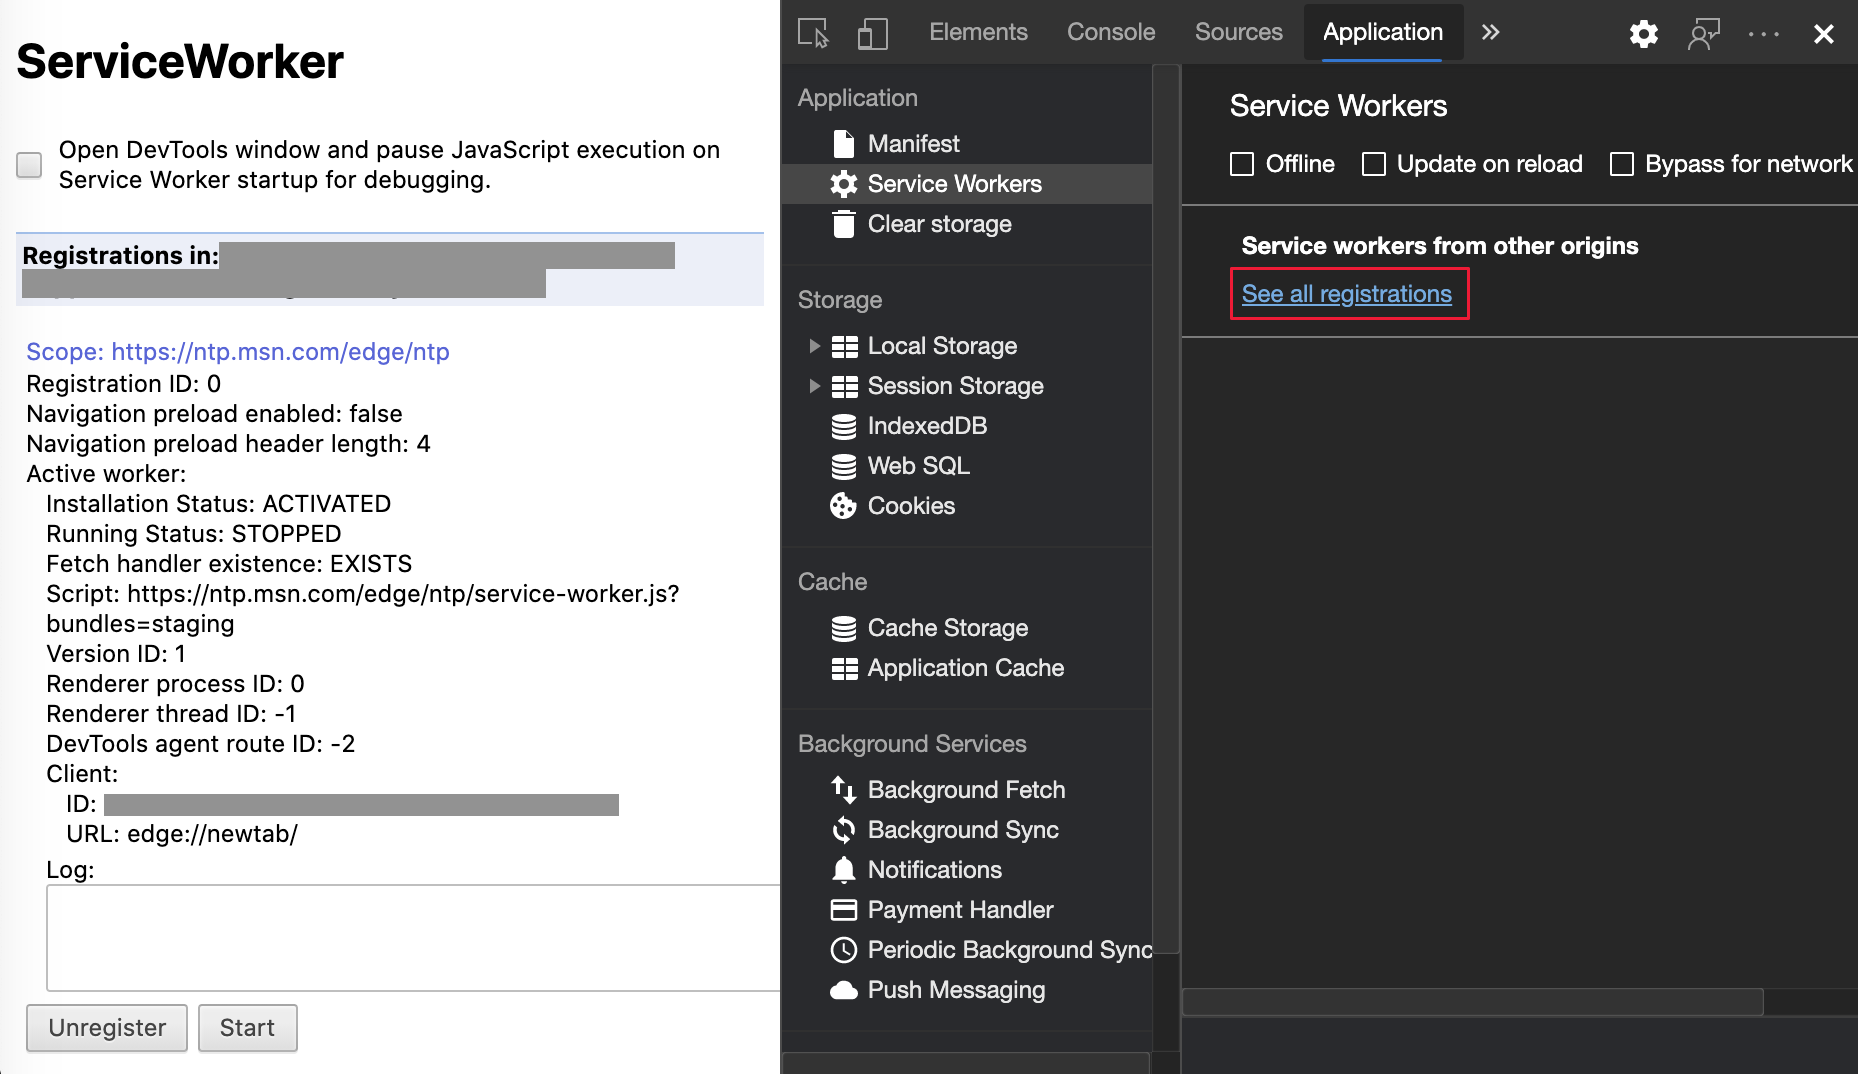
Deprecation of other origins listing in the Service Workers pane
The Application tool now provides a link from the Service workers pane to view the full list of service workers from other origins. To access the list of service workers without opening DevTools, go to edge://service-worker-internals/?devtools.
Previously DevTools displayed a list nested under the Application tool > Service workers pane.
Chromium issue: #807440
See also:
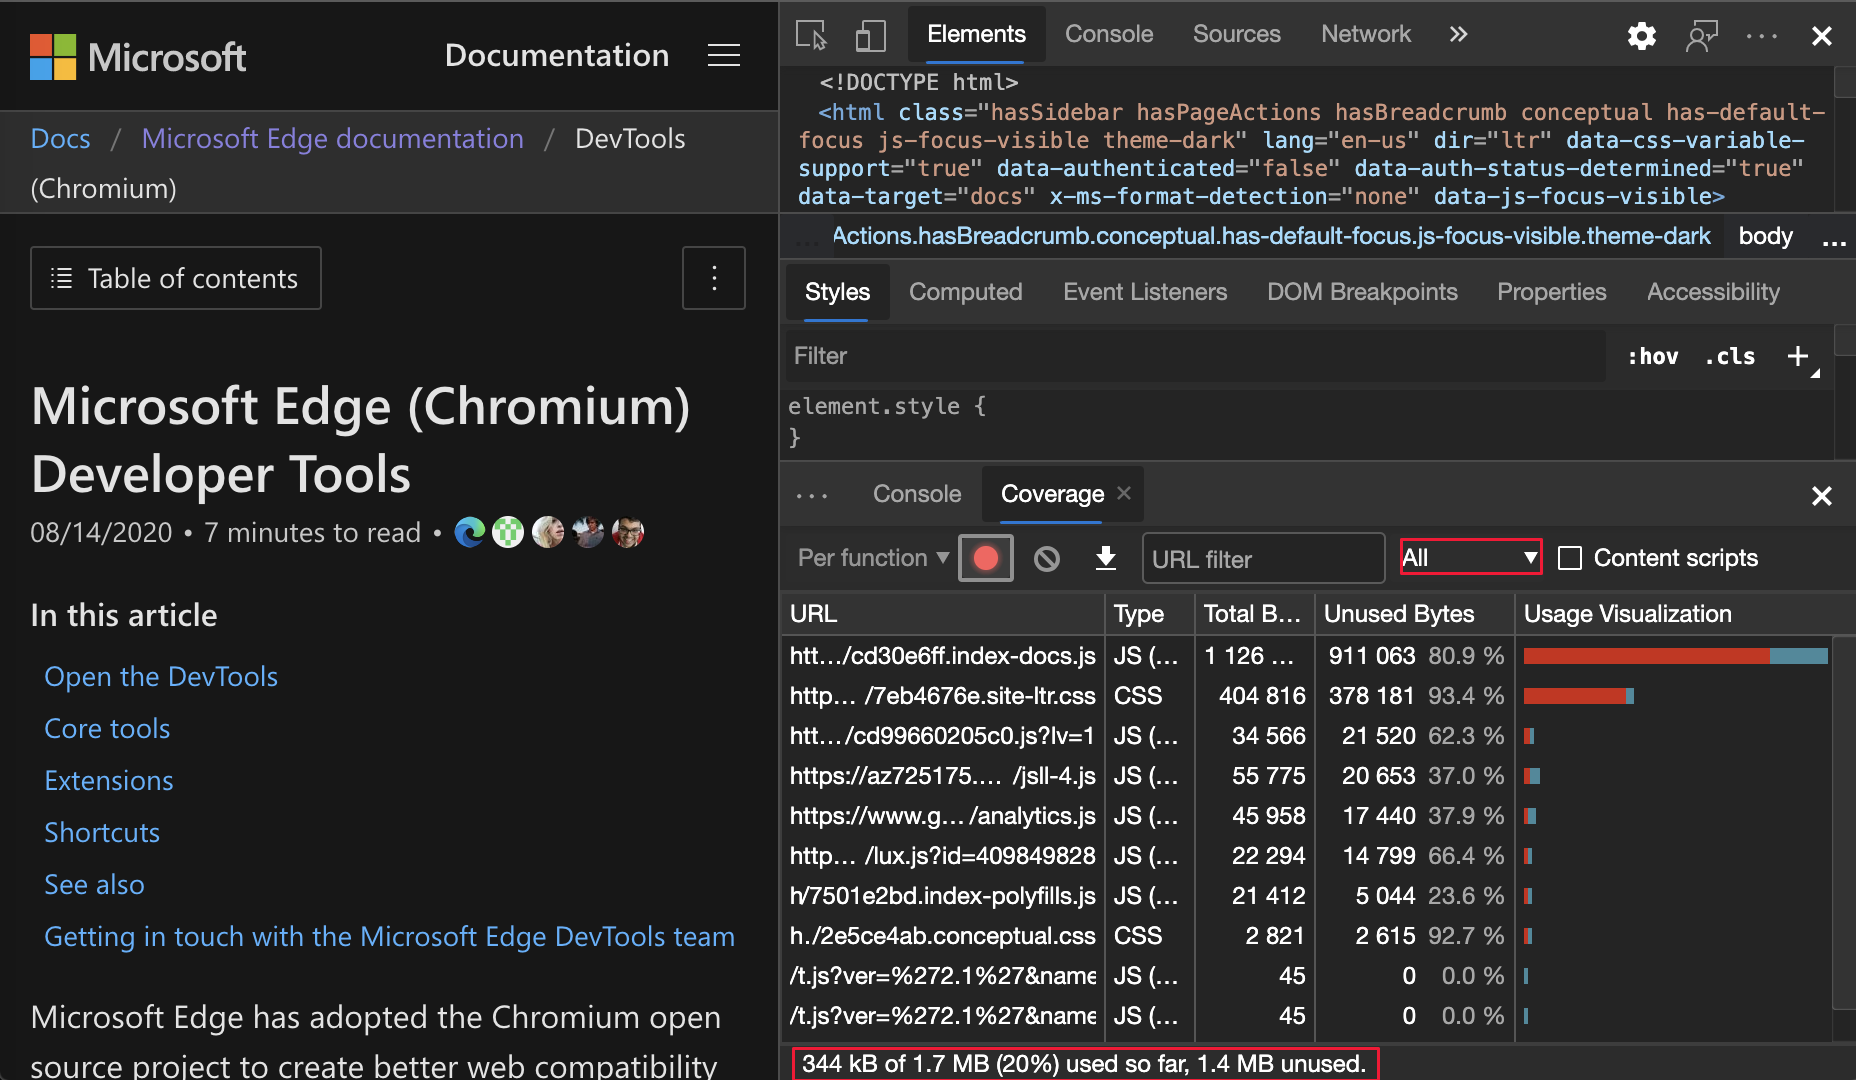
Show coverage summary for filtered items
DevTools now recalculates and displays a summary of coverage information dynamically. The dynamic display is triggered when filters are applied in the Coverage tool. Previously, the Coverage tool always displayed a summary of all coverage information.
In the following example, the Coverage summary initially shows 344 kB of 1.7 MB (20%) used so far. 1.4 MB unused.:
After CSS filtering is applied, the Coverage summary shows 26.8 kB of 408 kB (7%) used so far. 381 kB unused.:
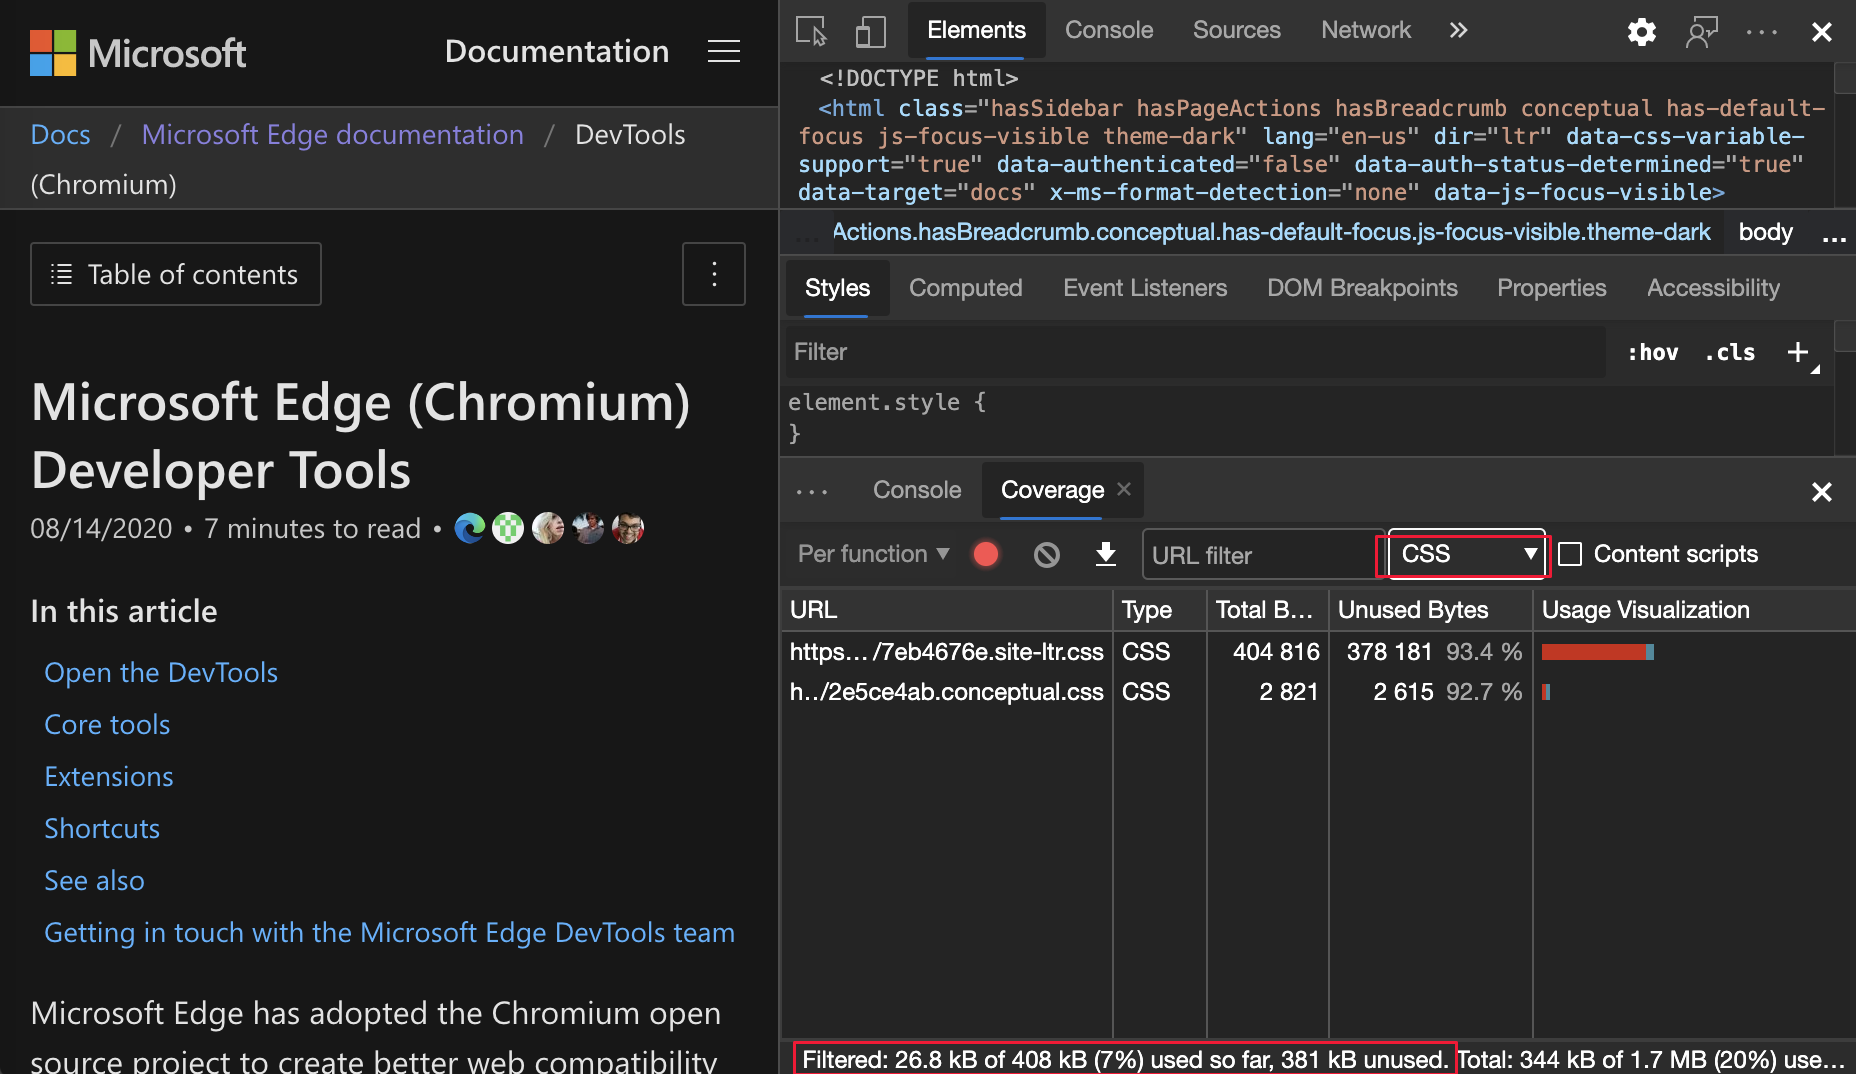
Chromium issue: #1061385
New frame details view in Application panel
In the Application tool, there's now a Frames section that provides a detailed view for each frame. To access the detailed view, click a frame under the Frames menu in the Application tool.
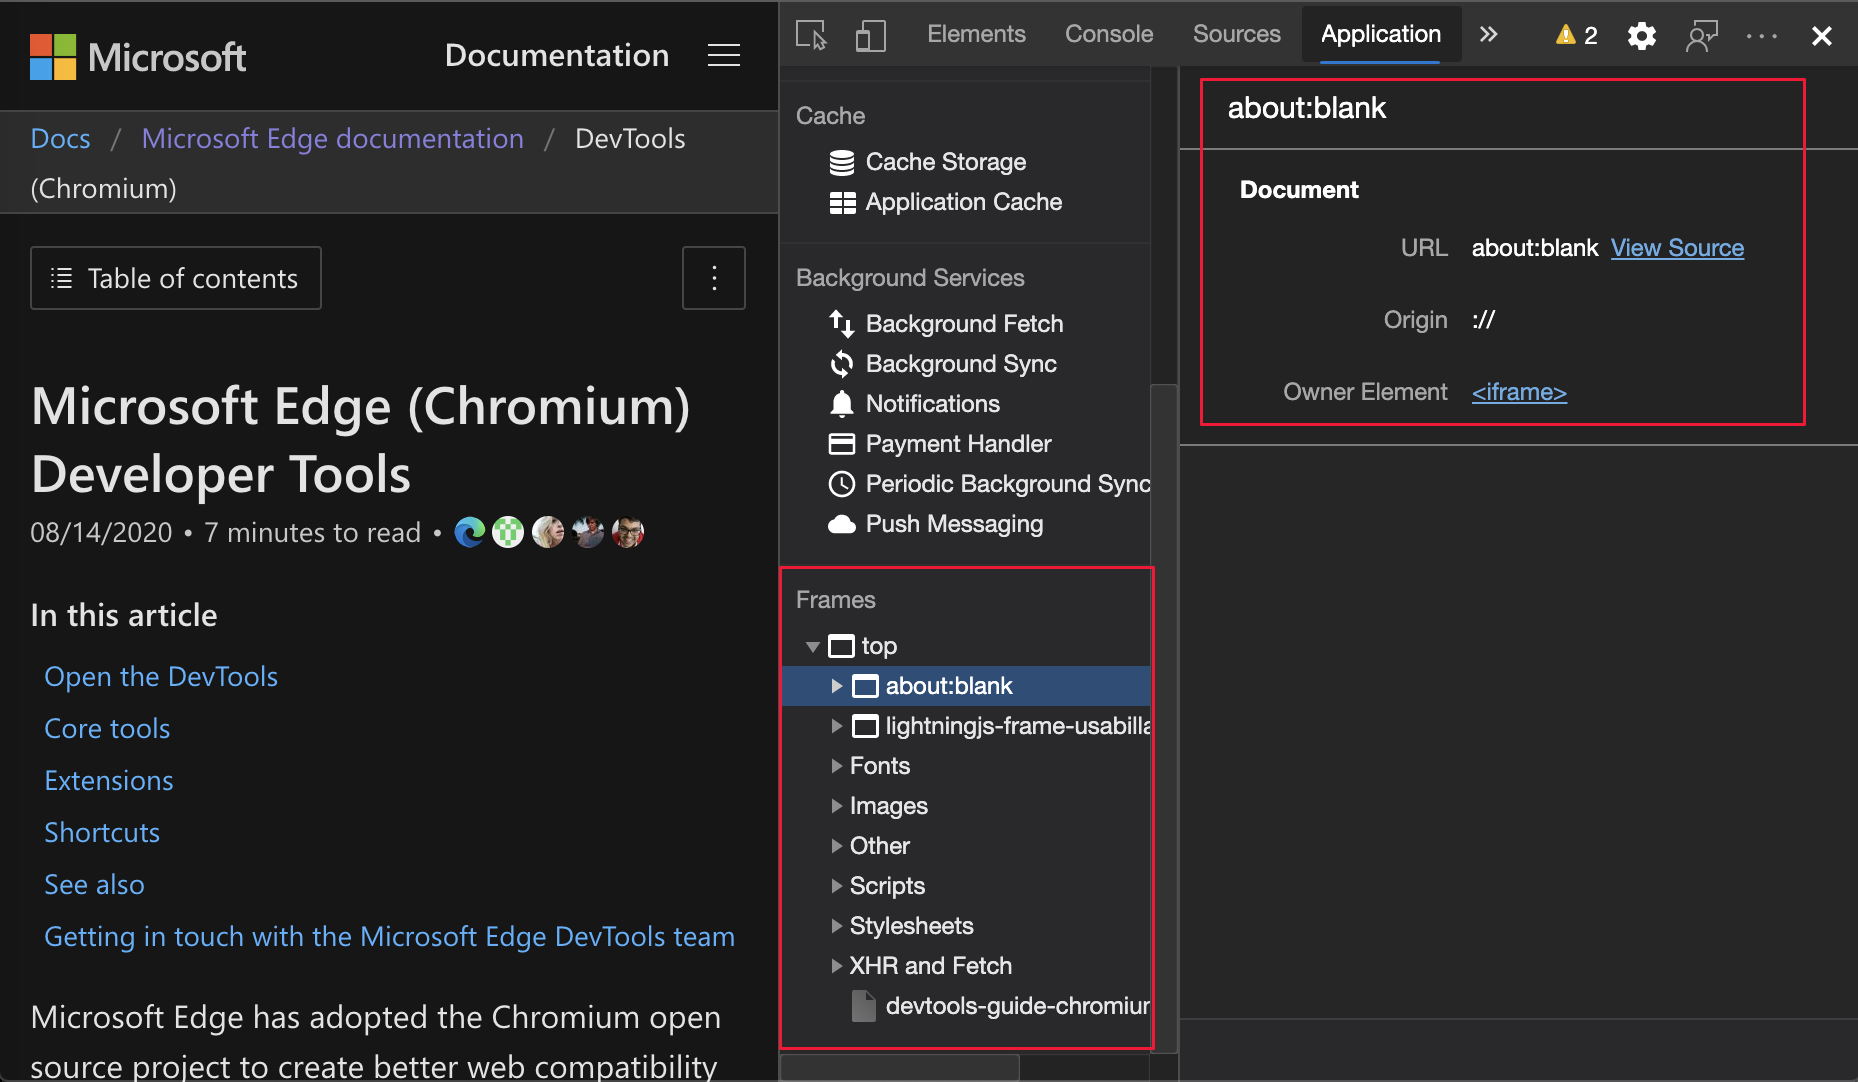
Chromium issue: #1093247
See also:
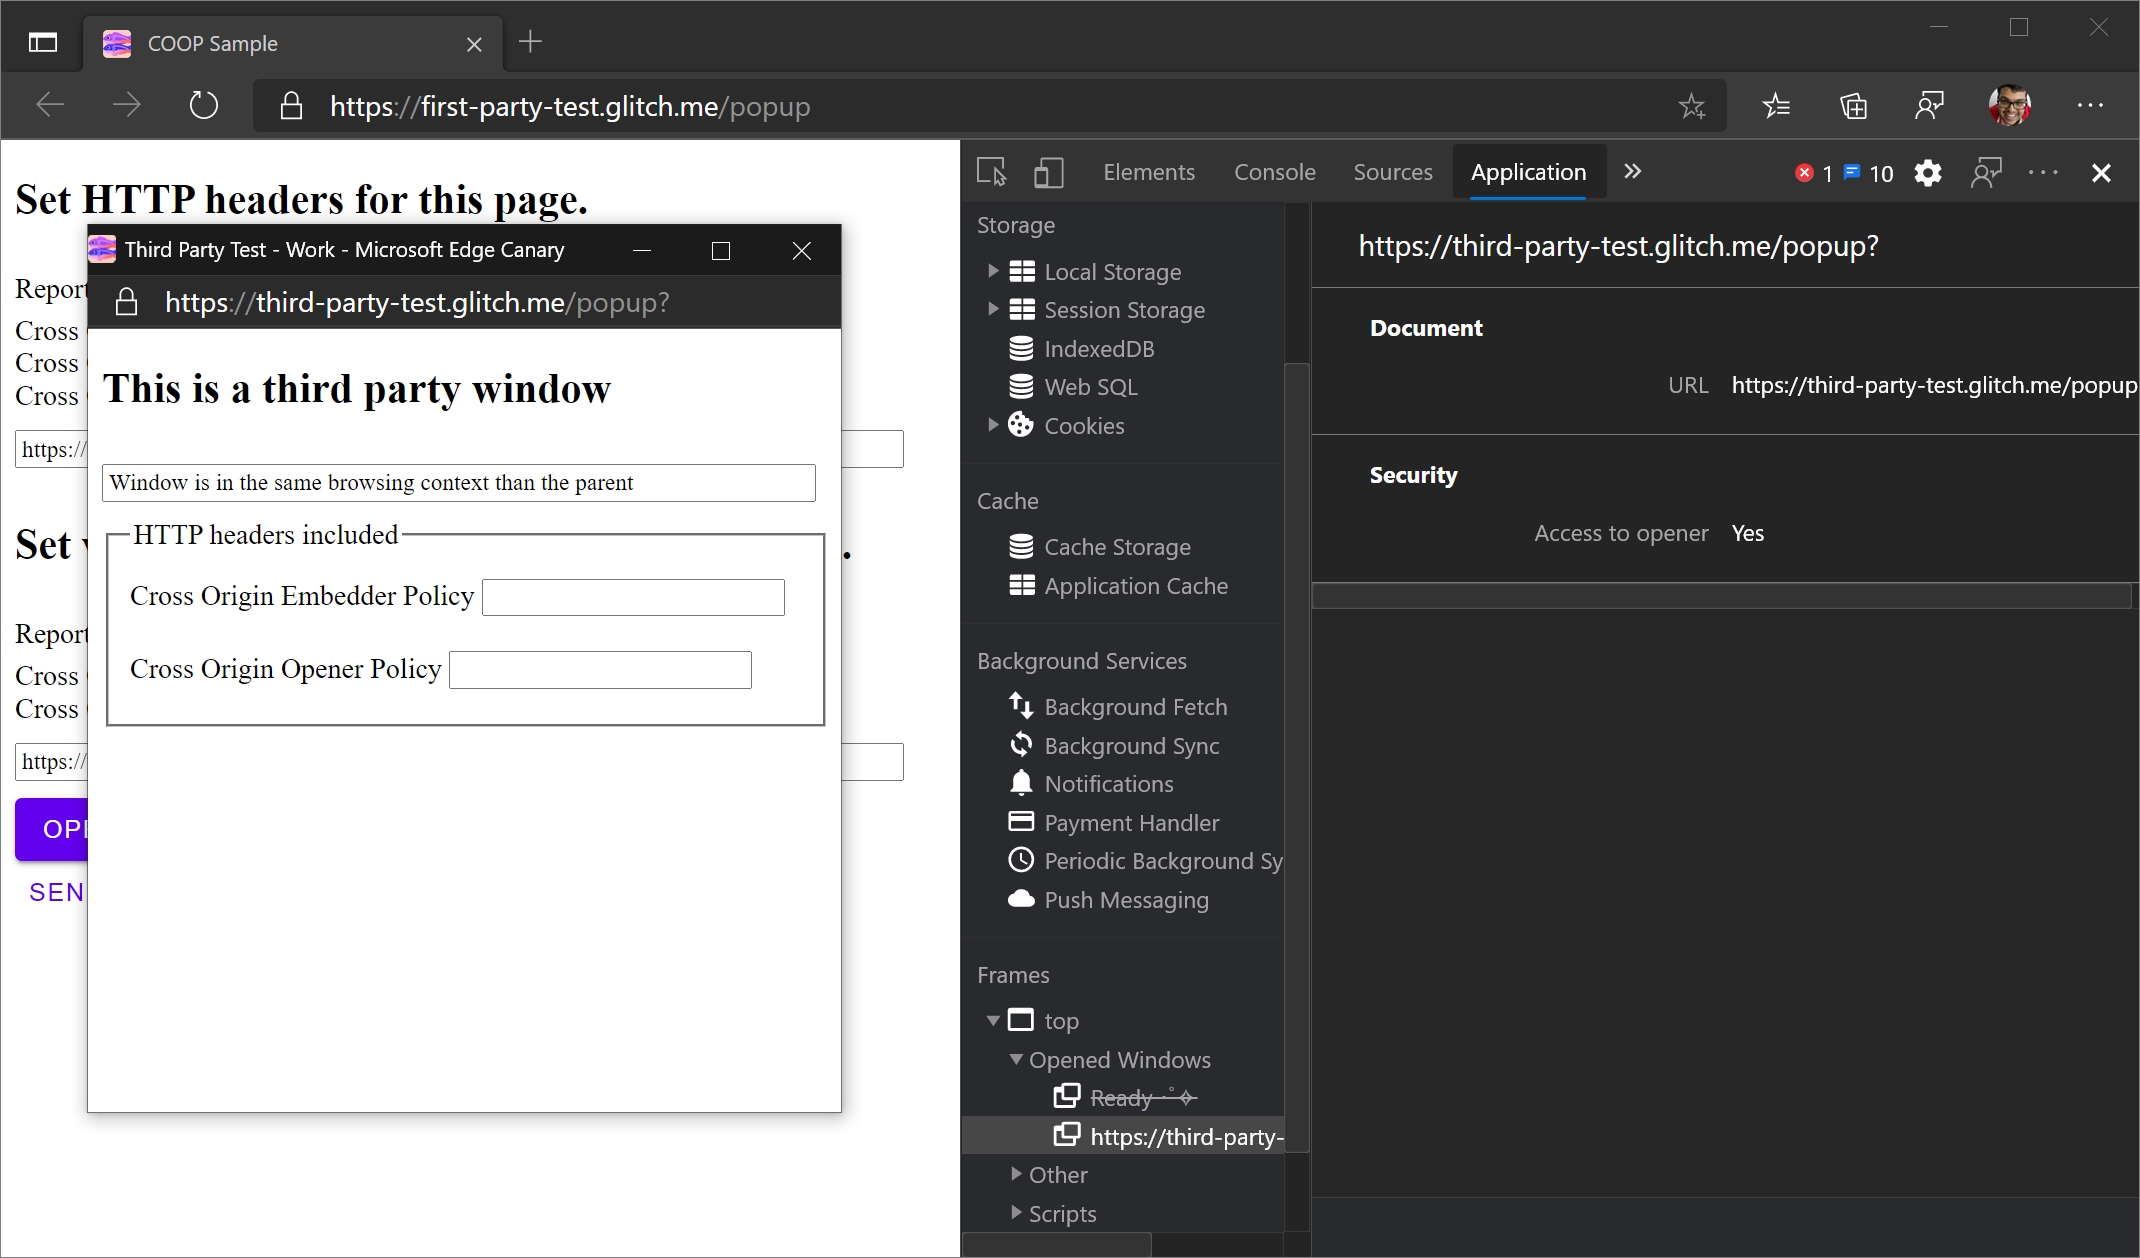
Frame details for opened windows
Open windows and pop-up windows now display under the frame tree as well. The detailed view of the opened windows includes additional security information.
Chromium issue: #1107766
See also:
Security and isolation information
Secure context, Cross-Origin-Embedder-Policy (COEP), and Cross-Origin-Opener-Policy (COOP) are now displayed in the frame details.
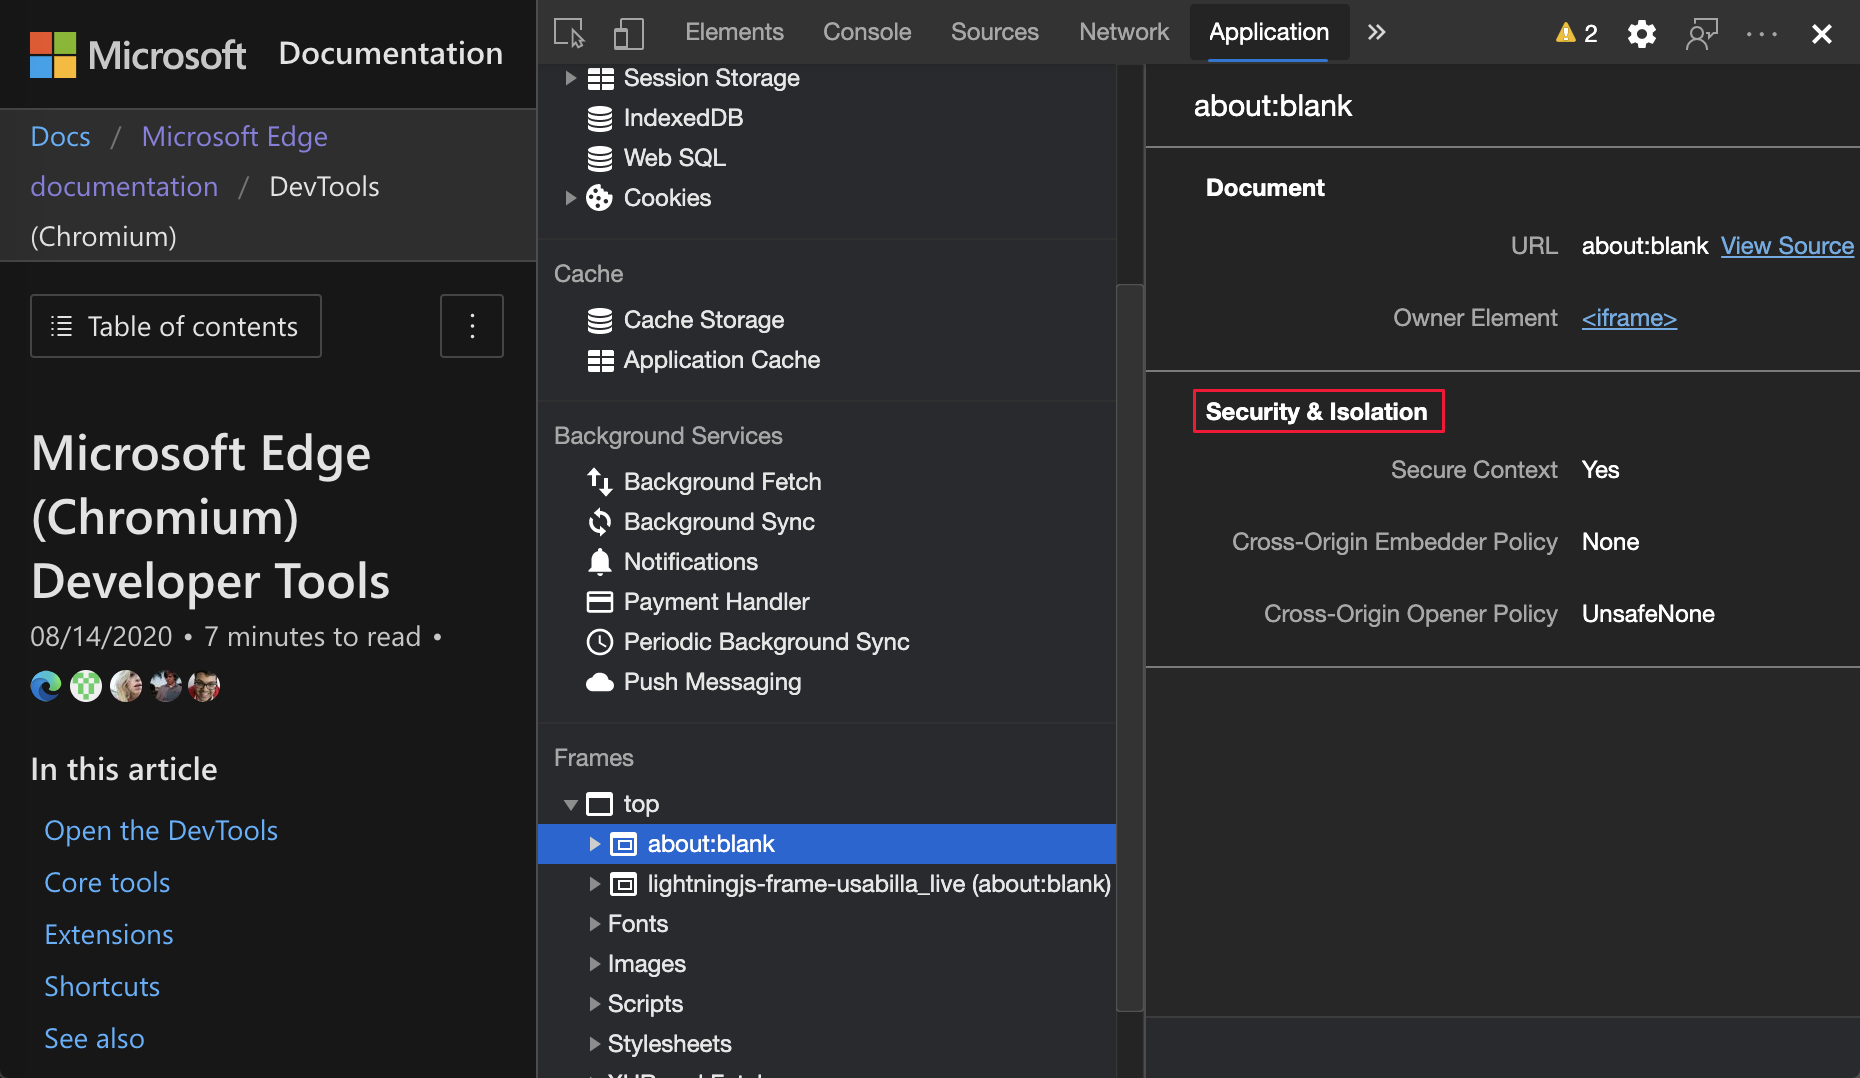
The Chromium project plans to add more security information to the frame details.
Chromium issue: #1051466
See also:
Elements and Network panel updates
See also:
Accessible color suggestion in the Styles pane
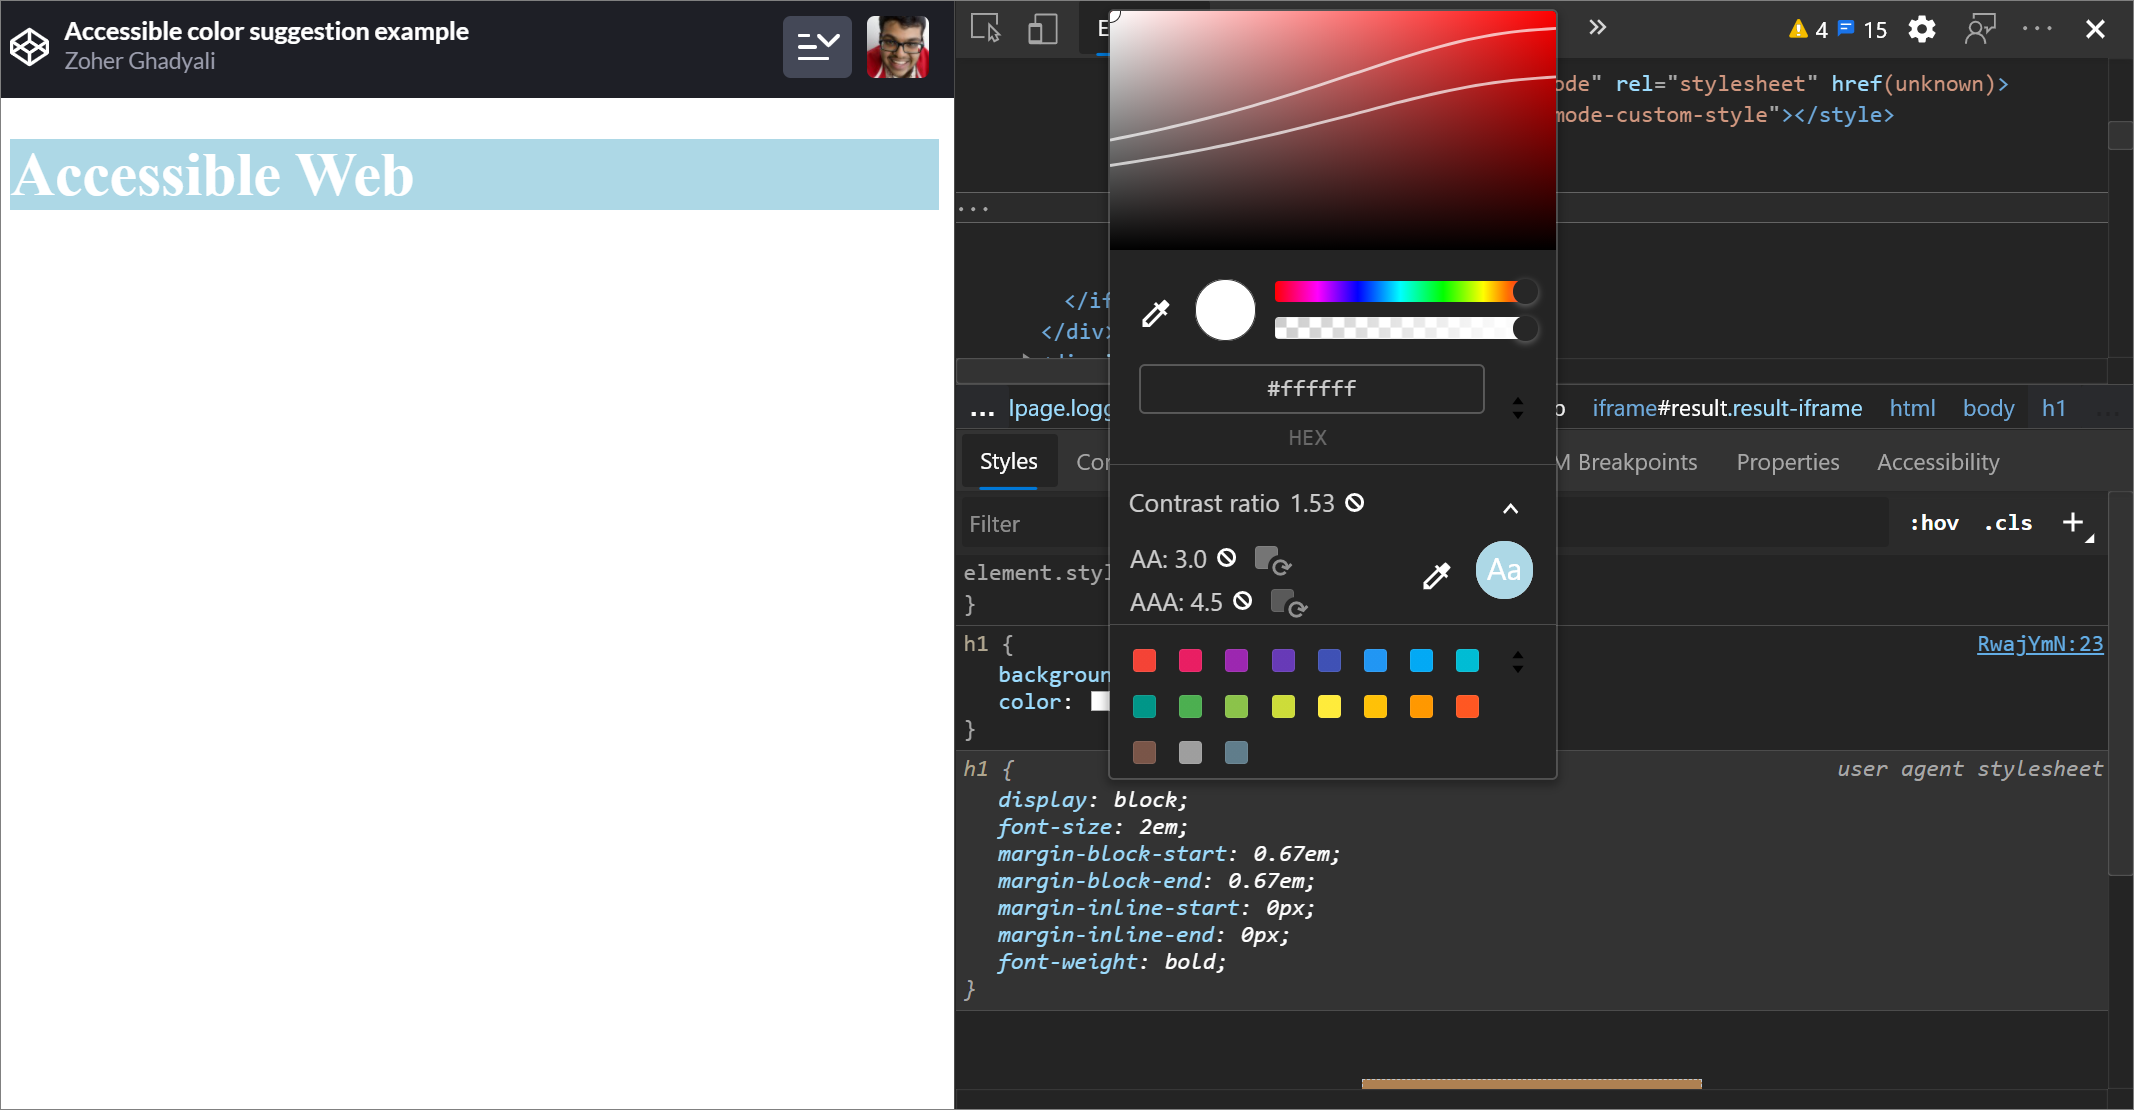
DevTools now provides color suggestions for low color contrast text.
In the example below, h1 has low-contrast text. To fix the contrast, open the color picker of the color property in the Styles pane. After you expand the Contrast ratio section, DevTools provides AA and AAA color suggestions. Select the suggested color, to apply the color.
Chromium issue: #1093227
See also:
- Change colors with the Color Picker in CSS features reference
- Test text-color contrast using the Color Picker
Reinstate Properties pane in the Elements panel
In the Elements tool, the Properties pane is back. The Properties pane was deprecated in Microsoft Edge 84. The Microsoft Edge DevTools team and the Chrome DevTools team are planning improvements for inspecting properties of elements.

Chromium issue: #1116085
See also:
Autocomplete custom fonts in the Styles pane
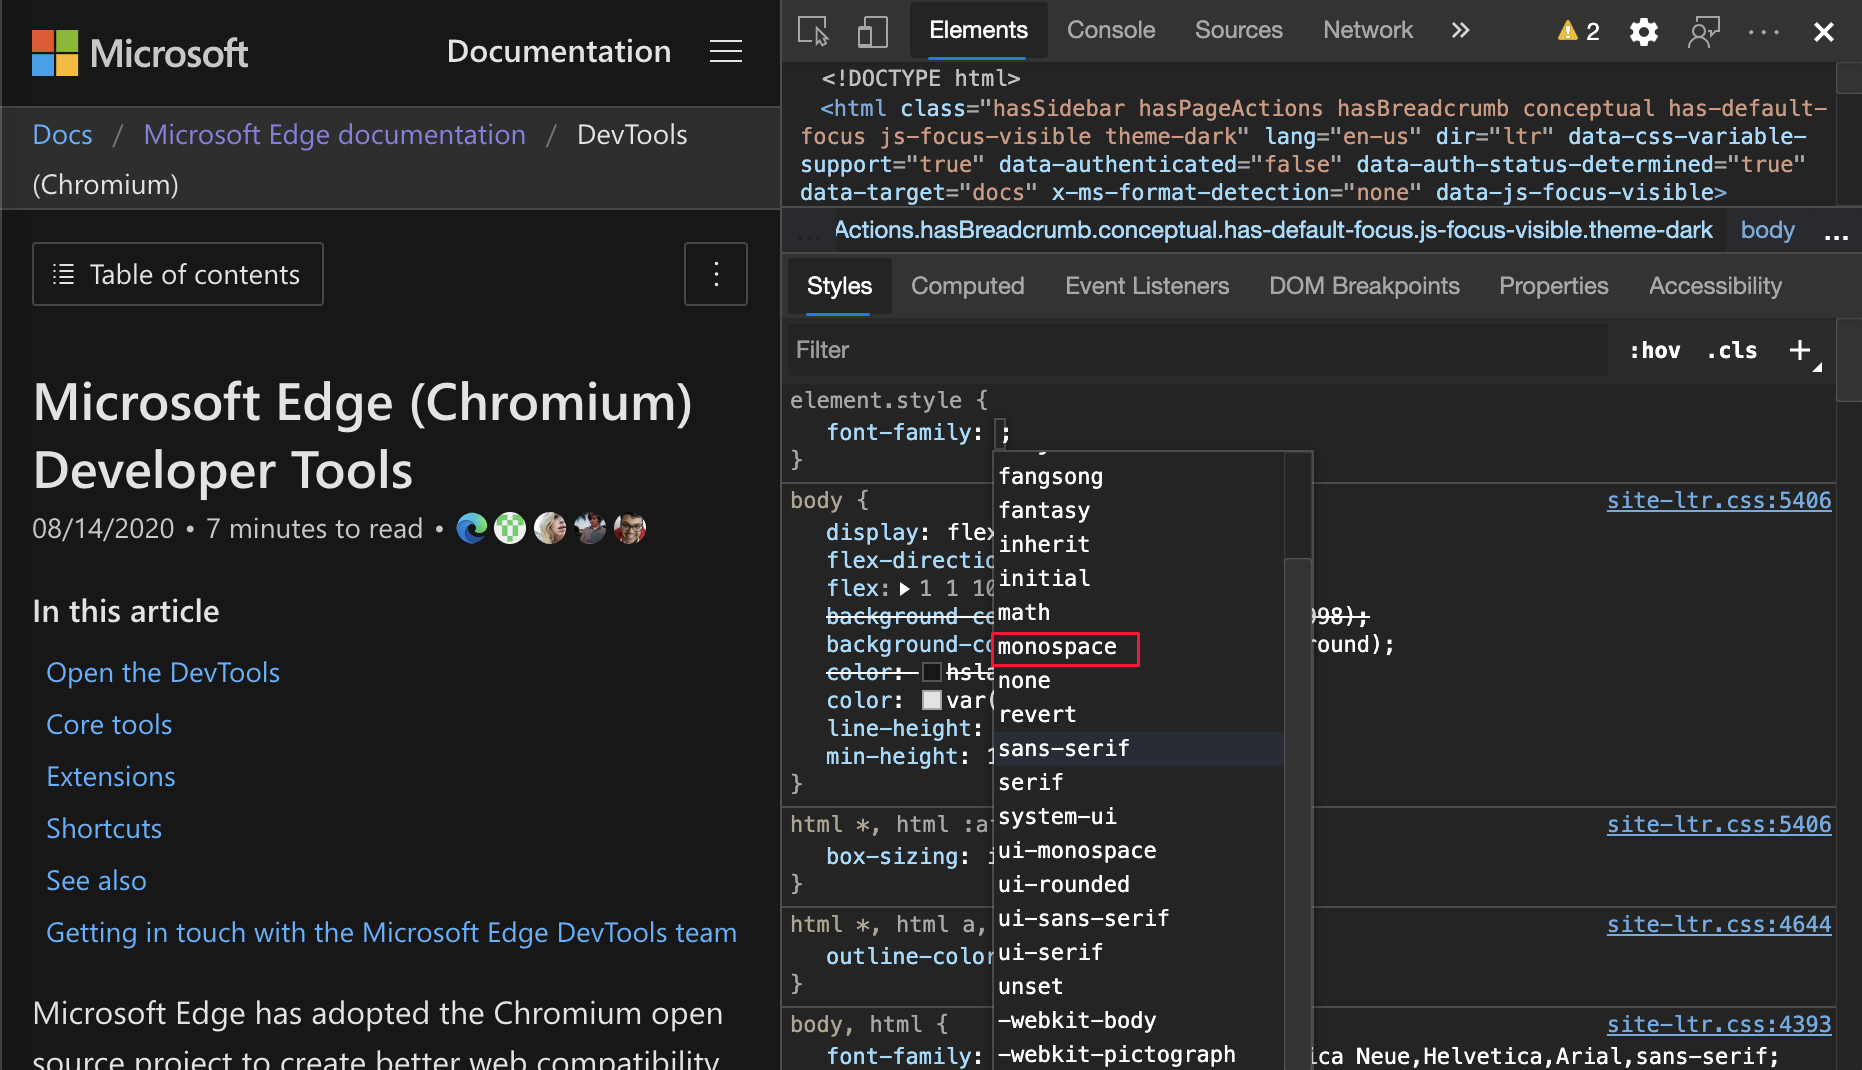
Imported font faces are now added to the list of CSS autocompletion when editing the font-family property in the Styles pane.
For example, if monospace is a custom font installed on the local machine, it appears in the CSS completion list. In previous versions of Microsoft Edge, the font was not displayed.
Chromium issue: #1106221
See also:
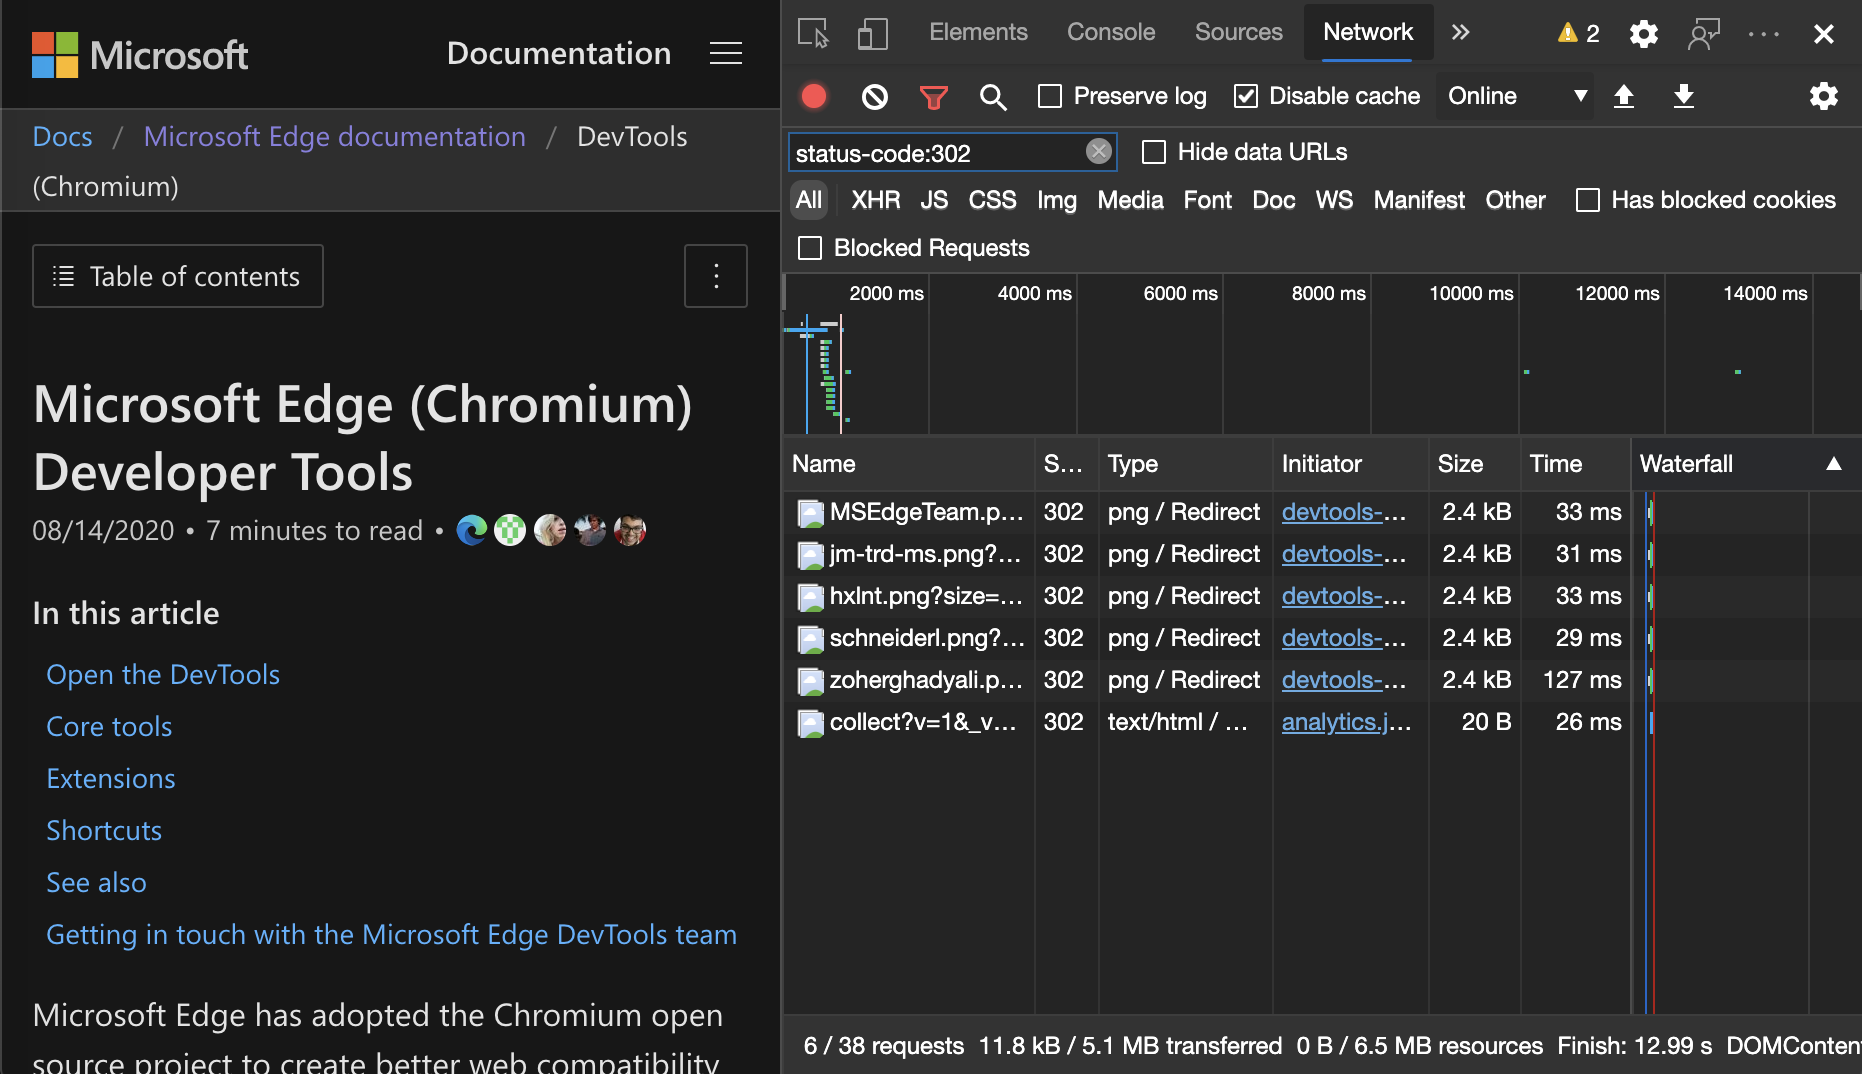
Consistently display resource type in Network panel
In the Network tool, DevTools now consistently displays the same resource type as the original network request. When redirection (HTTP status code 302) happens, DevTools appends / Redirect to the value in the Type column.
Previously, DevTools sometimes changed the value in the Type column to Other.
Chromium issue: #997694
See also:
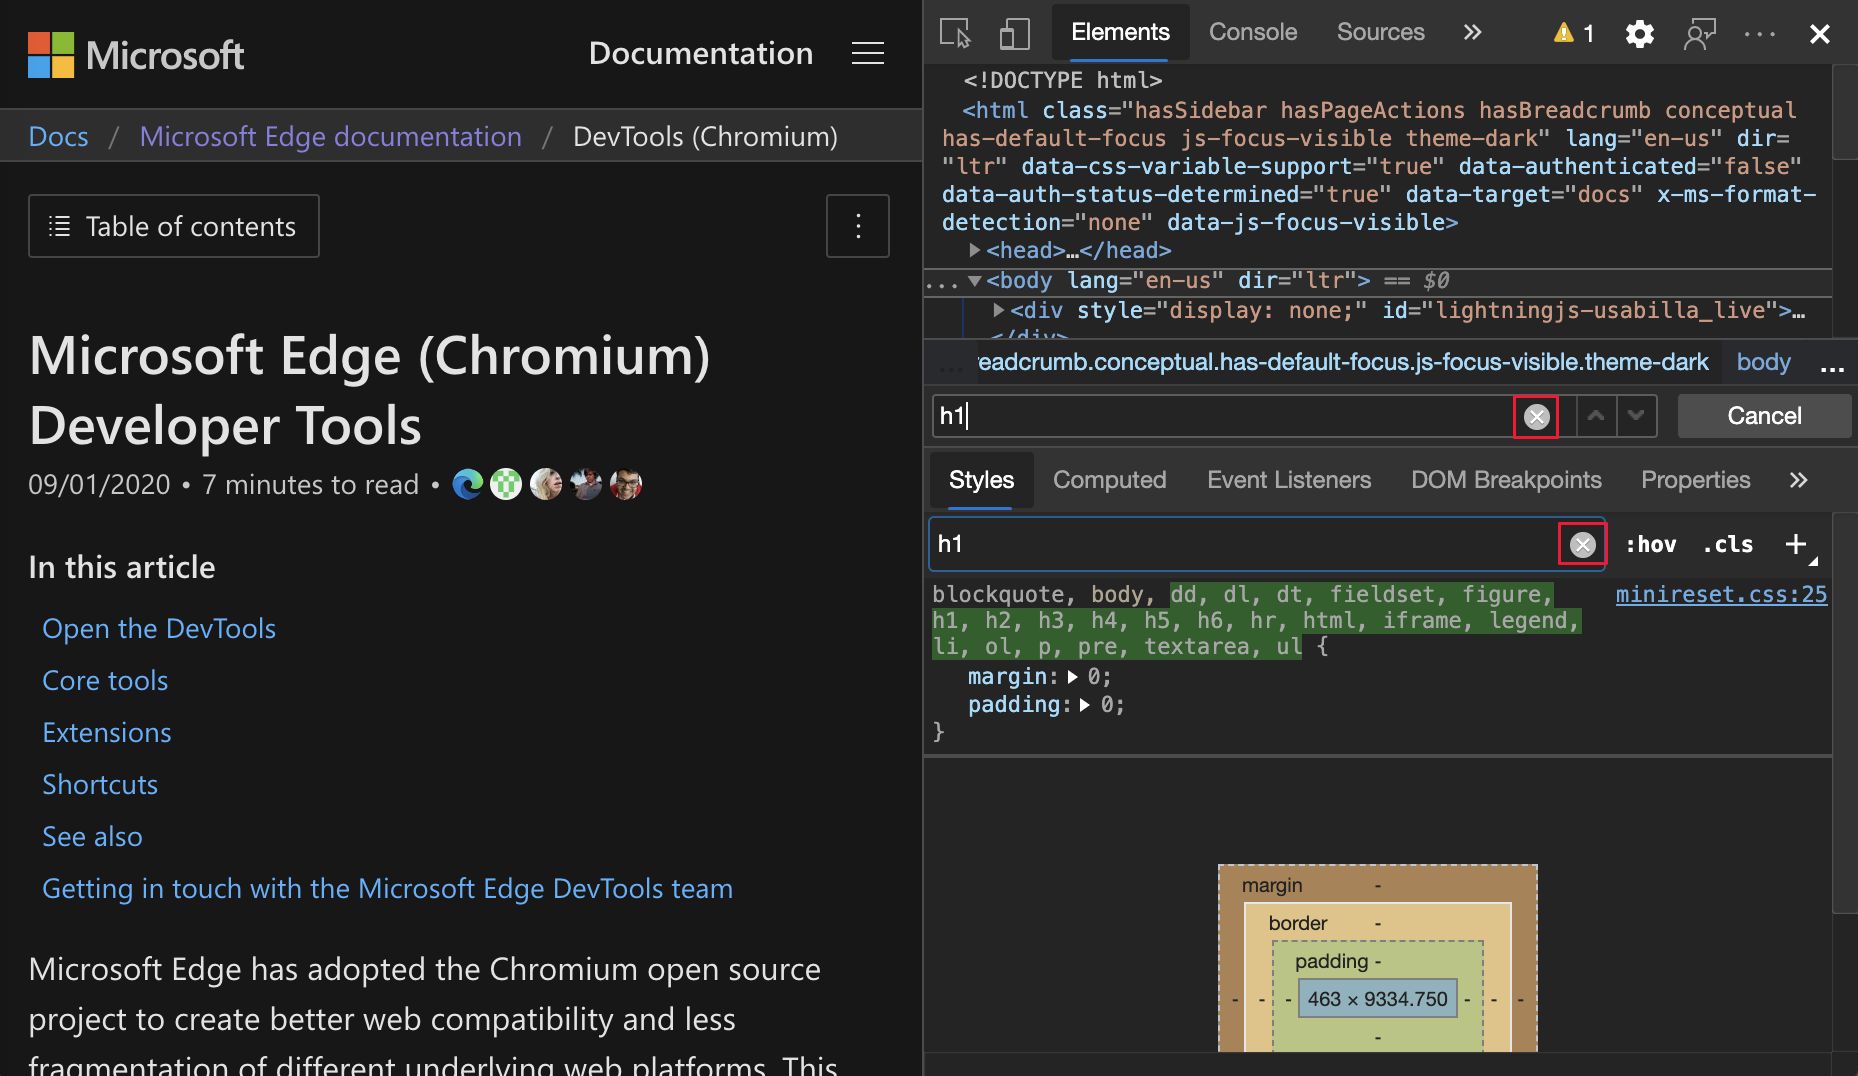
Clear buttons in the Elements and Network tools
The following text boxes now have Clear buttons:
- The filter text boxes in the Styles pane and Network tool.
- The DOM search text box in the Elements tool.
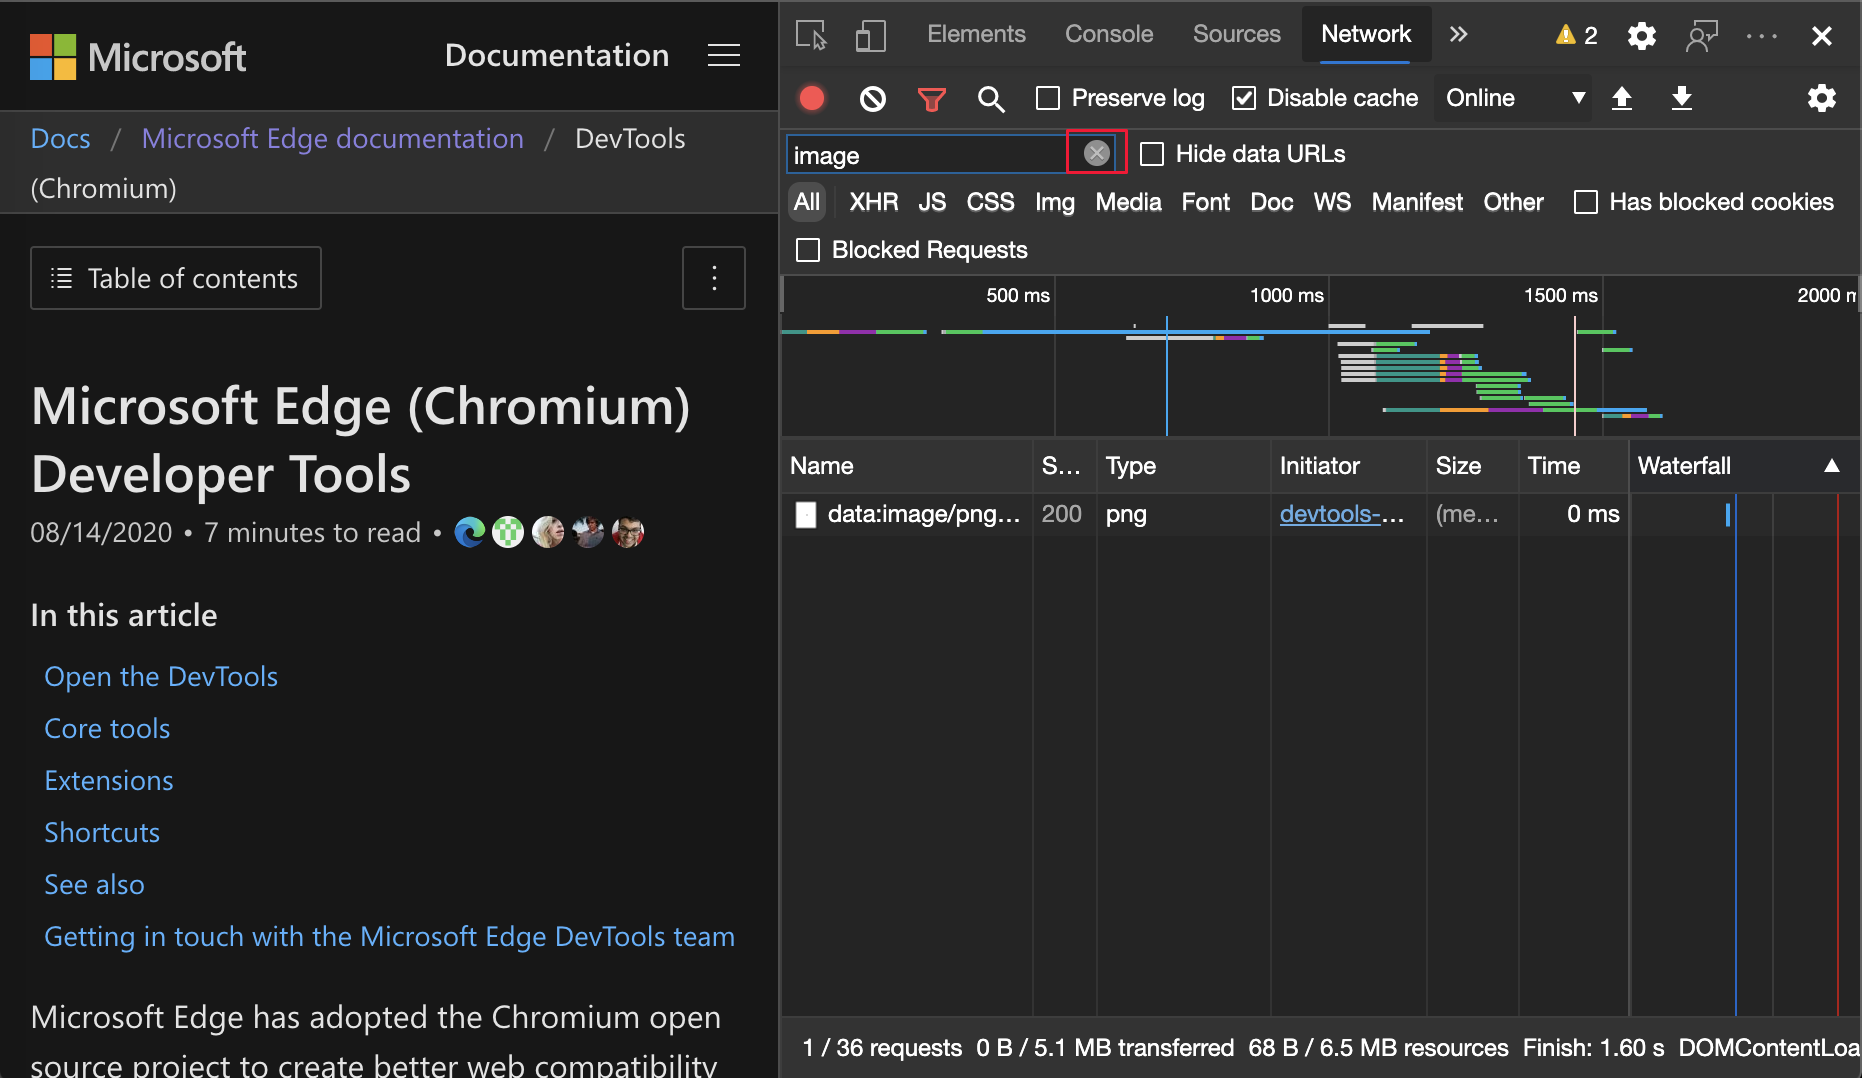
Click the Clear button to remove any inputted text.
Clear buttons in the Elements tools:
Clear buttons in the Network tools:
Chromium issue: #1067184
See also:
Note
Portions of this page are modifications based on work created and shared by Google and used according to terms described in the Creative Commons Attribution 4.0 International License. The original page is found here and is authored by Jecelyn Yeen (Developer advocate, Chrome DevTools).
![]() This work is licensed under a Creative Commons Attribution 4.0 International License.
This work is licensed under a Creative Commons Attribution 4.0 International License.
Feedback
Coming soon: Throughout 2024 we will be phasing out GitHub Issues as the feedback mechanism for content and replacing it with a new feedback system. For more information see: https://aka.ms/ContentUserFeedback.
Submit and view feedback for