C#
An object-oriented and type-safe programming language that has its roots in the C family of languages and includes support for component-oriented programming.
10,279 questions
This browser is no longer supported.
Upgrade to Microsoft Edge to take advantage of the latest features, security updates, and technical support.
' cx='32' cy='32' r='32' /%3E%3Ctext x='50%25' y='55%25' dominant-baseline='middle' text-anchor='middle' fill='%23FFF' %3EKM%3C/text%3E%3C/svg%3E)
Hi all,
I was taking the video course to create the combo chart from the video-create-a-combo-chart-c7921539-cda8-4913-9cd7-170f372d21a2. I am planning to implement that option using C# Interop Excel. But, I am not able to find the chart types with combo charts. Can someone help me to create a combo chart using C# Excel?
' cx='32' cy='32' r='32' /%3E%3Ctext x='50%25' y='55%25' dominant-baseline='middle' text-anchor='middle' fill='%23FFF' %3ED%3C/text%3E%3C/svg%3E)
Hi, you could use Free Spire.XLS for .NET to create a combination chart in Excel. The following code snippet shows you how to.
using Spire.Xls;
using Spire.Xls.Charts;
namespace CreateCombinationExcel
{
    class Program
    {

        static void Main(string[] args)
        {
            Workbook workbook = new Workbook();
            workbook.LoadFromFile("data.xlsx");
            Worksheet sheet = workbook.Worksheets[0];

            //add a chart based on the data from A1 to D5
            Chart chart = sheet.Charts.Add();
            chart.DataRange = sheet.Range["A1:D5"];
            chart.SeriesDataFromRange = false;

            //set position of chart
            chart.LeftColumn = 6;
            chart.TopRow = 1;
            chart.RightColumn = 12;
            chart.BottomRow = 13;

            //apply different chart type to different series
            var cs1 = (ChartSerie)chart.Series[0];
            cs1.SerieType = ExcelChartType.ColumnClustered;
            var cs2 = (ChartSerie)chart.Series[1];
            cs2.SerieType = ExcelChartType.ColumnClustered;
            var cs3 = (ChartSerie)chart.Series[2];
            cs3.SerieType = ExcelChartType.LineMarkers;

            //add a secondary axis to chart
            chart.SecondaryCategoryAxis.IsMaxCross = true;
            cs3.UsePrimaryAxis = false;

            //save and launch the file
            workbook.SaveToFile("result.xlsx", ExcelVersion.Version2010);
        }
    }
}
More details can be found here.
' cx='32' cy='32' r='32' /%3E%3Ctext x='50%25' y='55%25' dominant-baseline='middle' text-anchor='middle' fill='%23FFF' %3EDZ%3C/text%3E%3C/svg%3E)
Hi kamalasubhamuthukumar-9493,
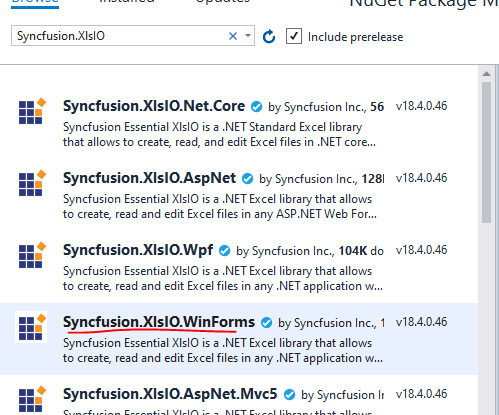
You can try to create combination chart in Excel using Syncfusion Excel (XlsIO) library.
First, add Syncfusion.XlsIO.WinForms.nupkg into your project.
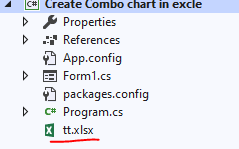
Then embed your excle file as a resource in your solution.
Next refer to the following code example:
using (ExcelEngine excelEngine = new ExcelEngine())
{
IApplication application = excelEngine.Excel;
application.DefaultVersion = ExcelVersion.Excel2016;
//Open existing workbook with data entered
Assembly assembly = typeof(Program).GetTypeInfo().Assembly;
//Create_Combo_chart_in_excle is my namespace and tt.xlsx is my embedded excle file
Stream fileStream = assembly.GetManifestResourceStream("Create_Combo_chart_in_excle.tt.xlsx");
IWorkbook workbook = application.Workbooks.Open(fileStream);
IWorksheet worksheet = workbook.Worksheets[0];
//Initialize chart and assign data
IChartShape chart = worksheet.Charts.Add();
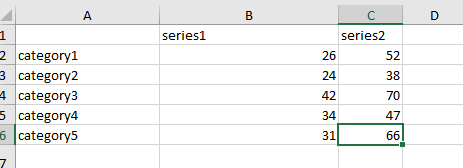
chart.DataRange = worksheet["A1:C6"];
//Apply chart elements
//Set Chart Title
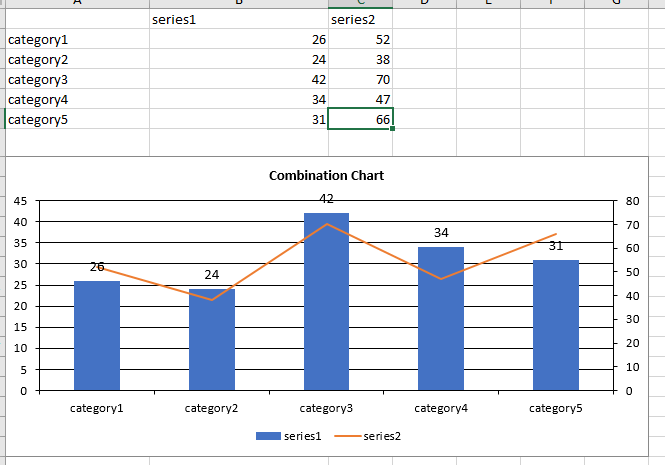
chart.ChartTitle = "Combination Chart";
chart.IsSeriesInRows = false;
//Set Legend
chart.HasLegend = true;
chart.Legend.Position = ExcelLegendPosition.Bottom;
//Set Serie type
IChartSerie serie1 = chart.Series[0];
IChartSerie serie2 = chart.Series[1];
serie1.SerieType = ExcelChartType.Column_Clustered;
serie2.SerieType = ExcelChartType.Line;
serie2.UsePrimaryAxis = false;
//set Data labels
serie1.DataPoints.DefaultDataPoint.DataLabels.IsValue = true;
//Positioning the chart in the worksheet
chart.TopRow = 8;
chart.LeftColumn = 1;
chart.BottomRow = 23;
chart.RightColumn = 8;
//Saving and closing the workbook
Stream stream = File.Create(@"C:\Users\Desktop\output.xlsx");
workbook.SaveAs(stream);
tt.xlsx:
output.xlsx:
Best Regards,
Daniel Zhang
If the response is helpful, please click "Accept Answer" and upvote it.
Note: Please follow the steps in our documentation to enable e-mail notifications if you want to receive the related email notification for this thread.
Hi, Thanks for your reply. SyncFusion is the third-party library?
Hi @kamalasubha muthukumar ,
Essential XlsIO is a native .NET class library that can be used to create and modify Microsoft Excel files by using C#, VB.NET and managed C++ code. It is a non-UI component that provides a full-fledged object model that facilitates accessing & manipulating the spreadsheets without any dependency of Microsoft Office COM libraries & Microsoft Office.
More details you can refer to this link.
Best Regards,
Daniel Zhang

In declarations for XlChartType, there is :
xlCombo = -4152,
xlComboColumnClusteredLine = 113,
xlComboColumnClusteredLineSecondaryAxis = 114,
xlComboAreaStackedColumnClustered = 115,
xlOtherCombinations = 116,
Hi, Thanks for your suggestion. I tried the same thing in C# by including Excel 16.0 Object Library and getting an error that it doesn't exist. Please find the screenshot