Log Analytics: Displaying a Value for Calculated Percentage (%) on a Custom Number Tile or View
The View Designer allows you to create a variety of custom tiles and views in the Azure Portal in your Log Analytics workspace. There are 4 types of tiles and visualization parts (views) that can be created with the View Designer to display text values that represent the counts of records from log analytics queries, lets call them Number Tiles or Views.They consist of:
- Single Number Tile: The count of records from a query.

- Two Numbers Tile: The counts of records from two different queries.

- Single Number and List View: The header displays a single number that shows a count of records from a log search query.
The list displays the top ten results from a query.
- Two Numbers and List View: The header displays two numbers that show counts of records from separate log search queries.
The list displays the top ten results from a query.
To allow a Number Tile or View to display a calculated percentage value from a Log Analytics query in KQL, the log query used will need to return the exact number of rows or records to represent the calculated percentage. Here are the steps to tweak a log query to achieve that.
Update April 2018: As an alternative, the print tabular operator can also be used to achieve the same result:
(Note that the print operator is useful as a quick way to test scalar expression evaluation in the system. Without it, one has to resort to tricks such as prepending the evaluation with a range x from 1 to 1 step 1 | project ...)
Step 1:
Develop a query that will return a record set with the required columns and values.
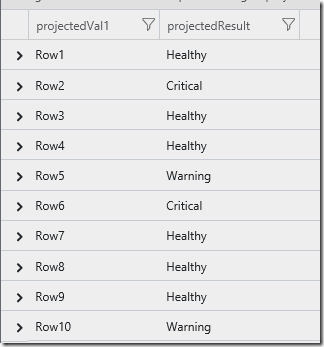
In this example, a data table (testTable) is used to represent a table with two columns of string values. The first column contains the row name, and the second column contains the health state of that row record.
 let testTable=datatable(projectedVal1: string, projectedResult: string)
[
'Row1','Healthy',
'Row2','Critical',
'Row3','Healthy',
'Row4','Healthy',
'Row5','Warning',
'Row6','Critical',
'Row7','Healthy',
'Row8','Healthy',
'Row9','Healthy',
'Row10','Warning'
];
testTable | project projectedVal1, projectedResult
Here is the log query result in the Advanced Analytics Portal:

Step 2:
Modify the log query to calculate the required percentage value based on the total number of records.
In this example, a original query is modified with two column extensions. The first extended column is assigned a value of “1” if the “projectedResult” column of a record contains a value of “Healthy”. The second extended column is assigned with a value of “1” for every record. With these values assigned correctly, the number of records with a “Healthy” values and the total number of records in the record set can be calculated by the summarize operator. Hence the percentage of “Healthy” records in the record set can also be calculated as follows, in this case, the result is 60%.
 testTable
| extend count1=iff(projectedResult == "Healthy" , 1 , 0) //If Healthy, Return 1, else 0
| extend count2=1 // to be used for total row count
| summarize HealthyCount=sum(count1), TotalRecords=sum(count2)
| extend percentAvailable=(HealthyCount*100)/TotalRecords
Here is the log query result in the Advanced Analytics Portal:

Step 3:
Create a dummy table with 100 rows and join it with the result returned from the previous step.
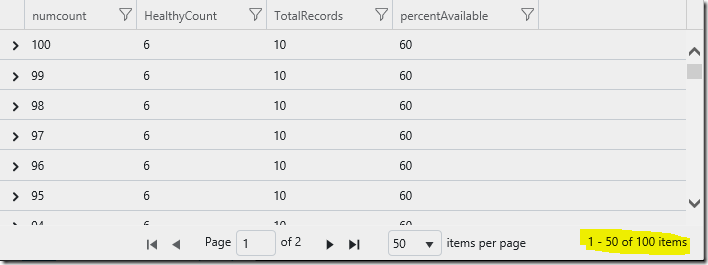
In this example, a dummy table with 100 rows is created and right-outer-joined with the calculated results from Step 2to create a new record set with 100 rows. Note that the dummy table has a column “numcount”that represents the row number of the record. Hence, the maximum value of “numcount” in the new record set will be100.
 range i from 0 to 99 step 1 // create dummy table
| project numcount=i+1, mergecol="oms"
| join kind=rightouter (testTable
| extend count1=iff(projectedResult == "Healthy" , 1 , 0) //If Healthy, Return 1, else 0
| extend count2=1 // to be used for total row count
| summarize HealthyCount=sum(count1), TotalRecords=sum(count2)
| extend percentAvailable=(HealthyCount*100)/TotalRecords
| extend mergecol="oms" ) on mergecol
| project numcount, HealthyCount, TotalRecords, percentAvailable
Here is the log query result in the Advanced Analytics Portal:

…
Step 4:
Calculate and count the number of records returned
In this example, a filter is applied to return only the records with their row number values less than or equal to the value in the “percentAvailable” column, i.e. the percentage of Healthy records in the sample table from Step 1. The total number of resultant records is then calculated for the Number Tile or View.
 range i from 0 to 99 step 1
| project numcount=i+1, mergecol="oms"
| join kind=rightouter (testTable
| extend count1=iff(projectedResult == "Healthy" , 1 , 0) //If Healthy, Return 1, else 0
| extend count2=1 // to be used for total row count
| summarize HealthyCount=sum(count1), TotalRecords=sum(count2)
| extend percentAvailable=(HealthyCount*100)/TotalRecords
| extend mergecol="oms" ) on mergecol
| project numcount, HealthyCount, TotalRecords, percentAvailable
| where numcount <= percentAvailable
| count
Here is the log query result in the Advanced Analytics Portal:

Step 5:
Configure the Number Tile or View.
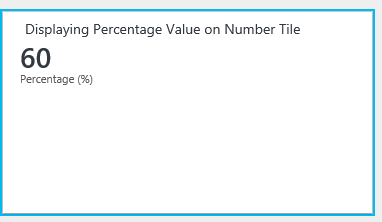
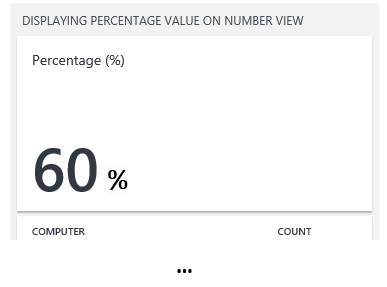
From Step 4, copy and paste the query into the Query Field of any Number Tile or View in the View Designer. Here is what it would look like on a Number Tile and a Number View:
For a Number Tile:

For a Number View (using a 31x33 JPG of a “ % ” symbol):

Note to remove the comments and reformat the query into a long string as follows to test the full query of the example from Step 1:
let testTable=datatable(projectedVal1:string, projectedResult:string) ['Row1','Healthy','Row2','Critical','Row3','Healthy','Row4','Healthy','Row5','Warning','Row6','Critical','Row7','Healthy','Row8','Healthy','Row9','Healthy','Row10','Warning'];range i from 0 to 99 step 1 | project numcount=i+1, mergecol="oms" | join kind=rightouter (testTable | extend count1=iff(projectedResult == "Healthy" , 1 , 0) | extend count2=1 | summarize HealthyCount=sum(count1), TotalRecords=sum(count2) | extend percentAvailable=(HealthyCount*100)/TotalRecords | extend mergecol="oms" ) on mergecol| project numcount, HealthyCount, TotalRecords, percentAvailable | where numcount <= percentAvailable| count
or if without the datatable declaration:
range i from 0 to 99 step 1 | project numcount=i+1, mergecol="oms" | join kind=rightouter (testTable | extend count1=iff(projectedResult == "Healthy" , 1 , 0) | extend count2=1 | summarize HealthyCount=sum(count1), TotalRecords=sum(count2) | extend percentAvailable=(HealthyCount*100)/TotalRecords | extend mergecol="oms" ) on mergecol| project numcount, HealthyCount, TotalRecords, percentAvailable | where numcount <= percentAvailable| count
Alternatively, if the print tabular operator is used, the query would look like the following example provided by my colleague Divyadeep Dayal.
 let tot1=toscalar ( Perf | summarize count() ) ;
let tot2=toscalar ( Perf | where ObjectName == "Processor" | summarize count() ) ;
let perc = tot2*100/tot1;
print perc
(Note: the print operator cannot follow pipe ('|') )
Additional Resources:
The Azure Log Analytics Query Language Reference can be used to search for examples and further information on query operators and functions:
https://docs.loganalytics.io/docs/Language-Reference
Log Analytics Demo Portal:
https://portal.loganalytics.io/demo