Add an Azure Monitor workspace to Azure Managed Grafana to collect Prometheus data
In this guide, learn how to connect an Azure Monitor workspace to Grafana directly from an Azure Managed Grafana workspace. This feature is designed to provide a quick way to collect Prometheus metrics stored in an Azure Monitor workspace and enables you to monitor your Azure Kubernetes Service (AKS) clusters in Grafana.
Prerequisites
- An Azure account with an active subscription. Create an account for free.
- An Azure Managed Grafana instance in the Standard tier. Create a new instance if you don't have one.
- An Azure Monitor workspace with Prometheus data.
Add a new role assignment
In the Azure Monitor workspace, assign the Monitoring Data Reader role to the Azure Managed Grafana resource's managed identity, so that Grafana can collect data from the Azure Monitor workspace.
Note
A system-assigned managed identity must be enabled in your Azure Managed Grafana resource. If needed, enable it by going to Identity and select Status: On.
To assign the Monitoring Data Reader role:
- Open the Azure Monitor workspace that holds Prometheus data.
- Go to Access control (IAM) > Add > Add role assignment.
- Select the Monitoring Data Reader role, then Next.
- For Assign access to, select Managed identity
- Open Select members and select your Azure Managed Grafana resource.
- Select Review + assign to initiate the role assignment
Add an Azure Monitor workspace
Open your Azure Managed Grafana workspace.
In the left menu, select Integrations > Azure Monitor workspaces.
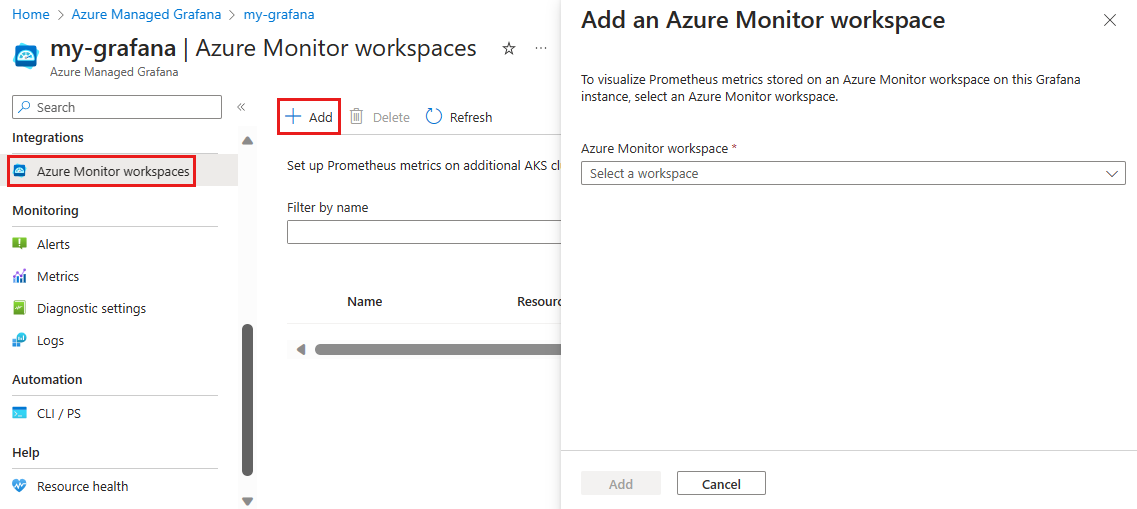
Select Add.
In the pane that opens, select an Azure Monitor workspace from the list and confirm with Add.
Once the operation is complete, Azure displays all the Azure Monitor workspaces added to the Azure Managed Grafana workspace. You can add more Azure Monitor workspaces by selecting Add again.
Display Prometheus data in Grafana
When you added the Azure Monitor workspace to Azure Managed Grafana in the previous step, Azure added a new Prometheus data source to Grafana.
To get a dashboard with Prometheus metrics, either use one of the prebuilt dashboards or build a brand new one.
Use a prebuilt dashboard
In Grafana, go to Dashboards from the left menu and expand the Managed Prometheus data source. Review the list of prebuilt dashboards and open one that seems interesting to you.
The following automatically generated dashboards are available, as of November 7, 2023:
- Kubernetes / Compute Resources / Cluster
- Kubernetes / Compute Resources / Cluster (Windows)
- Kubernetes / Compute Resources / Namespace (Pods)
- Kubernetes / Compute Resources / Namespace (Windows)
- Kubernetes / Compute Resources / Namespace (Workloads)
- Kubernetes / Compute Resources / Node (Pods)
- Kubernetes / Compute Resources / Pod
- Kubernetes / Compute Resources / Pod (Windows)
- Kubernetes / Compute Resources / Workload
- Kubernetes / Kubelet
- Kubernetes / Networking
- Kubernetes / USE Method / Cluster (Windows)
- Kubernetes / USE Method / Node (Windows)
- Node Exporter / Nodes
- Node Exporter / USE Method / Node
- Overview
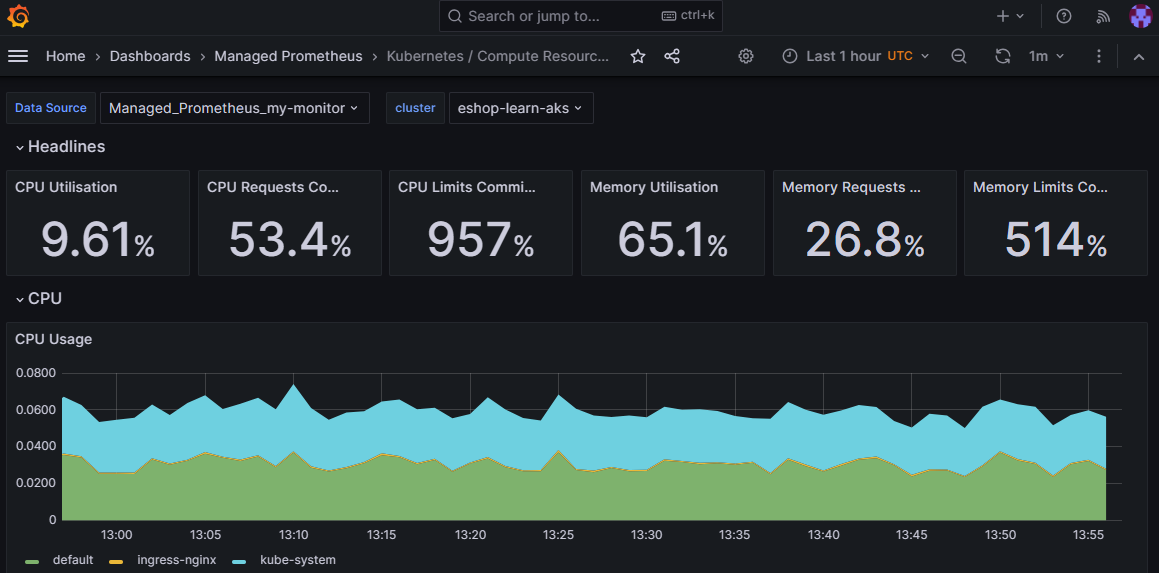
The following screenshot shows some of the panels from the "Kubernetes / Compute Resources / Cluster" dashboard.
Edit the dashboard as desired. For more information about editing a dashboard, read Edit a dashboard panel.
Create a new dashboard
To build a brand new dashboard with Prometheus metrics:
Open Grafana and select Connections > Your connections from the left menu.
Find the new Prometheus data source.

Select Build a dashboard to start creating a new dashboard with Prometheus metrics.
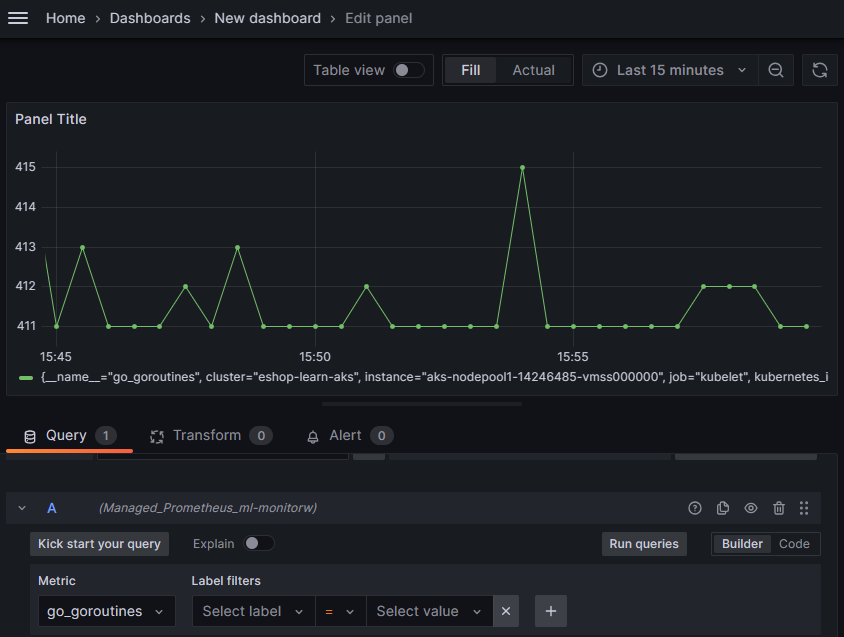
Select Add visualization to start creating a new panel.
Under metrics, select a metric and then Run queries to check that your dashboard can collect and display your Prometheus data.
For more information about editing a dashboard, read Edit a dashboard panel.
Tip
If you're unable to get Prometheus data in your dashboard, check if your Azure Monitor workspace is collecting Prometheus data. Go to Troubleshoot collection of Prometheus metrics in Azure Monitor for more information.
Remove an Azure Monitor workspace
If you no longer need it, you can remove an Azure Monitor workspace from your Azure Managed Grafana workspace:
- In your Azure Managed Grafana workspace, select Integrations > **Azure Monitor workspaces from the left menu.
- Select the row with the resource to delete and select Delete > Yes.
Optionally also remove the role assignment that was previously added in the Azure Monitor workspace:
- In the Azure Monitor workspace resource, select Access control (IAM) > Role assignments.
- Under Monitoring Data Reader, select the row with the name of your Azure Managed Grafana resource and select Remove > OK.
To learn more about Azure Monitor managed service for Prometheus, read the Azure Monitor managed service for Prometheus guide.
Next steps
In this how-to guide, you learned how to connect an Azure Monitor workspace to Grafana. To learn how to create and configure Grafana dashboards, go to Create dashboards.
Feedback
Coming soon: Throughout 2024 we will be phasing out GitHub Issues as the feedback mechanism for content and replacing it with a new feedback system. For more information see: https://aka.ms/ContentUserFeedback.
Submit and view feedback for