Enable diagnostics logs for Notification Hubs
When you start using your Azure Notification Hubs namespace, you might want to monitor how and when your namespace is created, deleted, or accessed. This article provides an overview of all the operational and diagnostics logs that are available.
Azure Notification Hubs currently supports activity and operational logs, which capture management operations that are performed on the Azure Notification Hubs namespace.
Diagnostic logs schema
All logs are stored in JavaScript Object Notation (JSON) format in the following two locations:
- AzureActivity: Displays logs from operations and actions that are conducted against your namespace in the Azure portal or through Azure Resource Manager template deployments.
- AzureDiagnostics: Displays logs from operations and actions that are conducted against your namespace by using the API, or through management clients on the language SDK.
Diagnostic log JSON strings include the elements listed in the following table:
| Name | Description |
|---|---|
| time | UTC timestamp of the log |
| resourceId | Relative path to the Azure resource |
| operationName | Name of the management operation |
| category | Log category. Valid values: OperationalLogs |
| callerIdentity | Identity of the caller who initiated the management operation |
| resultType | Status of the management operation. Valid values: Succeeded or Failed |
| resultDescription | Description of the management operation |
| correlationId | Correlation ID of the management operation (if specified) |
| callerIpAddress | The caller IP address. Empty for calls that originated from the Azure portal |
Here's an example of an operational log JSON string:
{
    "operationName": "Microsoft.NotificationHubs/Namespaces/NotificationHubs/authorizationRules/action",
    "resourceId": "/SUBSCRIPTIONS/2CAC2A14-BA6B-46A6-BCE8-2D9781A41BA2/RESOURCEGROUPS/SAMPLES/PROVIDERS/MICROSOFT.NOTIFICATIONHUBS/NAMESPACES/SAMPLE-NS",
    "time": "1/1/2021 5:16:32 AM +00:00",
    "category": "OperationalLogs",
    "resultType": "Succeeded",
    "resultDescription": "Gets Hub Authorization Rules",
    "correlationId": "00000000-0000-0000-0000-000000000000",
    "callerIdentity": "{ \"identityType\": \"Portal\", \"identity\": \"\" }"
}
The callerIdentity field can be empty, or a JSON string with one of the following formats.
For calls originating from the Azure portal the identity field is empty. The log can be correlated to activity logs to determine the logged in user.
{
    "identityType": "Portal",
    "identity": ""
}
For calls made through Azure Resource Manager the identity field contains the username of the logged in user.
{
   "identityType": "Username",
   "identity": "test@foo.com"
}
For calls to the Notification Hubs REST API the identity field contains the name of the access policy used to generate the SharedAccessSignature token.
{
   "identityType": "KeyName",
   "identity": "SharedAccessRootKey2"
}
Events and operations captured in operational logs
Operational logs capture all management operations that are performed on the Azure Notification Hubs namespace. Data operations aren't captured, because of the high volume of data operations that are conducted on notification hubs.
For a list of the management operations that are captured in operational logs, see Microsoft.NotificationHubs resource provider operations.
Enable operational logs
Operational logs are disabled by default. To enable logs, do the following:
In the Azure portal, go to your Azure Notification Hubs namespace and then, under Monitoring, select Diagnostic settings.

In the Diagnostics settings pane, select Add diagnostic setting.
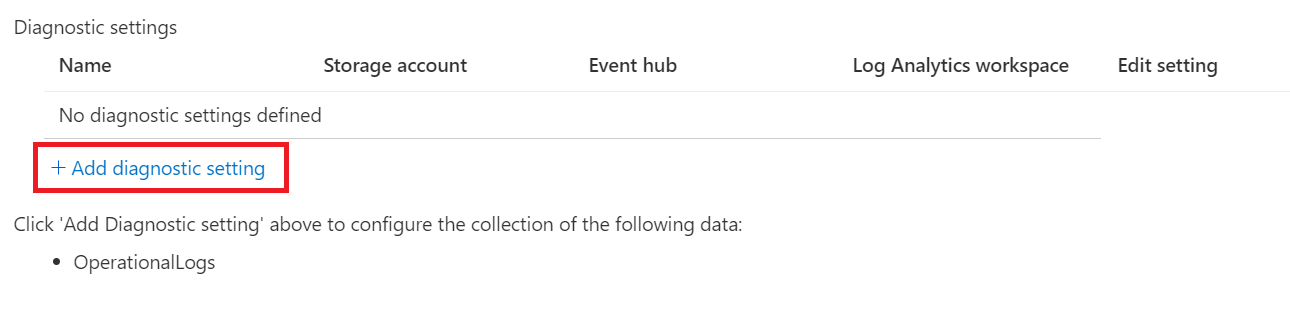
Configure the diagnostics settings by doing the following:
a. In the Name box, enter a name for the diagnostics settings.
b. Select one of the following three destinations for your diagnostics logs:
- If you select Send to Log Analytics workspace, you need to specify which instance of Log Analytics the diagnostics will be sent to.
- If you select Archive to a storage account, you need to configure the storage account where the diagnostics logs will be stored.
- If you select Stream to an event hub, you need to configure the event hub that you want to stream the diagnostics logs to.
c. Select the OperationalLogs check box.

Select Save.
The new settings take effect in about 10 minutes. The logs are displayed in the configured archival target, in the Diagnostics logs pane.
Related content
To learn more about configuring diagnostics settings, see:
To learn more about Azure Notification Hubs, see:
Feedback
Coming soon: Throughout 2024 we will be phasing out GitHub Issues as the feedback mechanism for content and replacing it with a new feedback system. For more information see: https://aka.ms/ContentUserFeedback.
Submit and view feedback for