Build real-time dashboard with Power BI dataset produced from Stream Analytics no code editor
This article describes how you can use the no code editor to easily create a Stream Analytics job to produce processed data into Power BI dataset. It continuously reads from your Event Hubs, processes and outputs the data into Power BI dataset to build the real-time Power BI dashboard.
Prerequisites
- Your Azure Event Hubs resources must be publicly accessible and not be behind a firewall or secured in an Azure Virtual Network
- You should have an existing Power BI workspace, and you have the permission to create dataset there.
- The data in your Event Hubs must be serialized in either JSON, CSV, or Avro format.
Develop a Stream Analytics job to create Power BI dataset with selected data
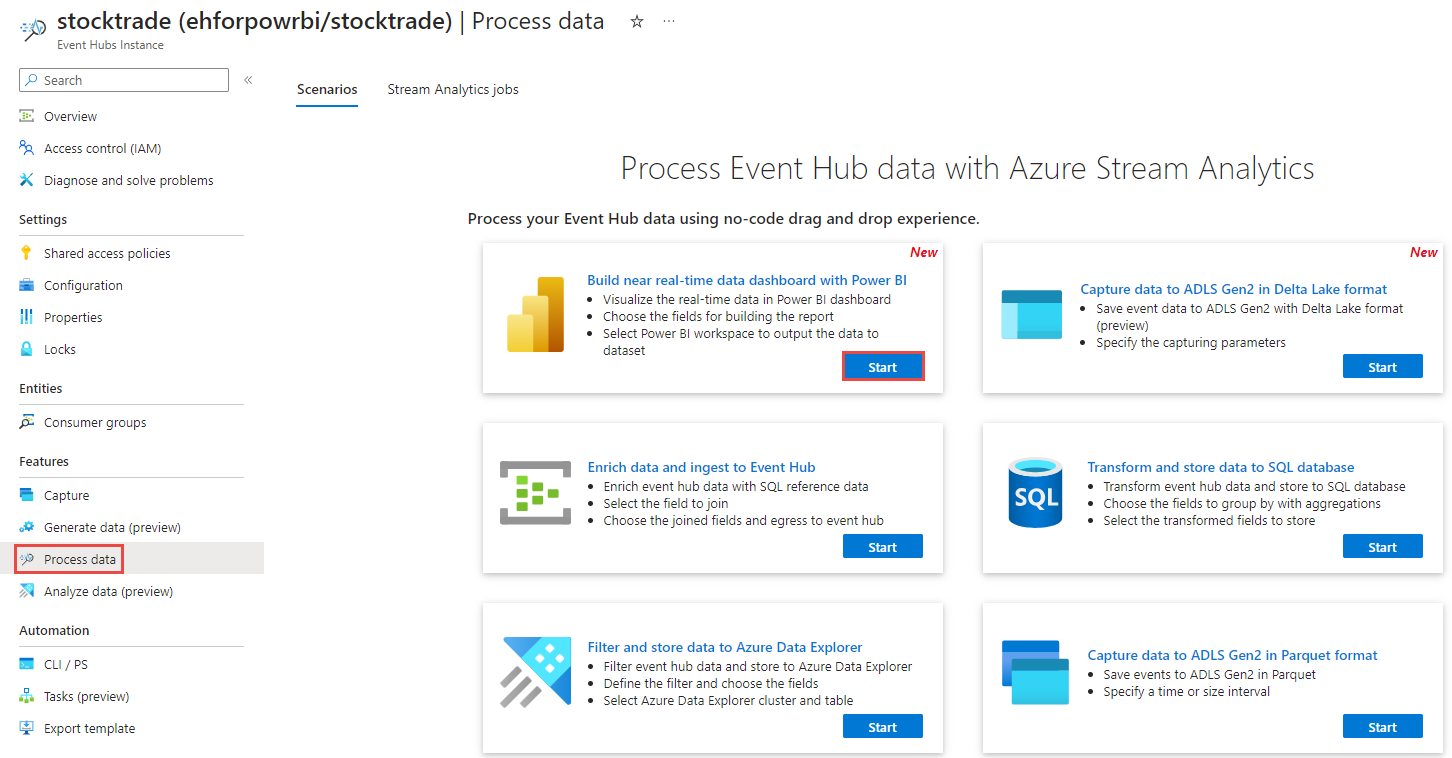
In the Azure portal, locate and select the Azure Event Hubs instance.
Select Features > Process Data and then select Start on the Build near real-time data dashboard with Power BI card.
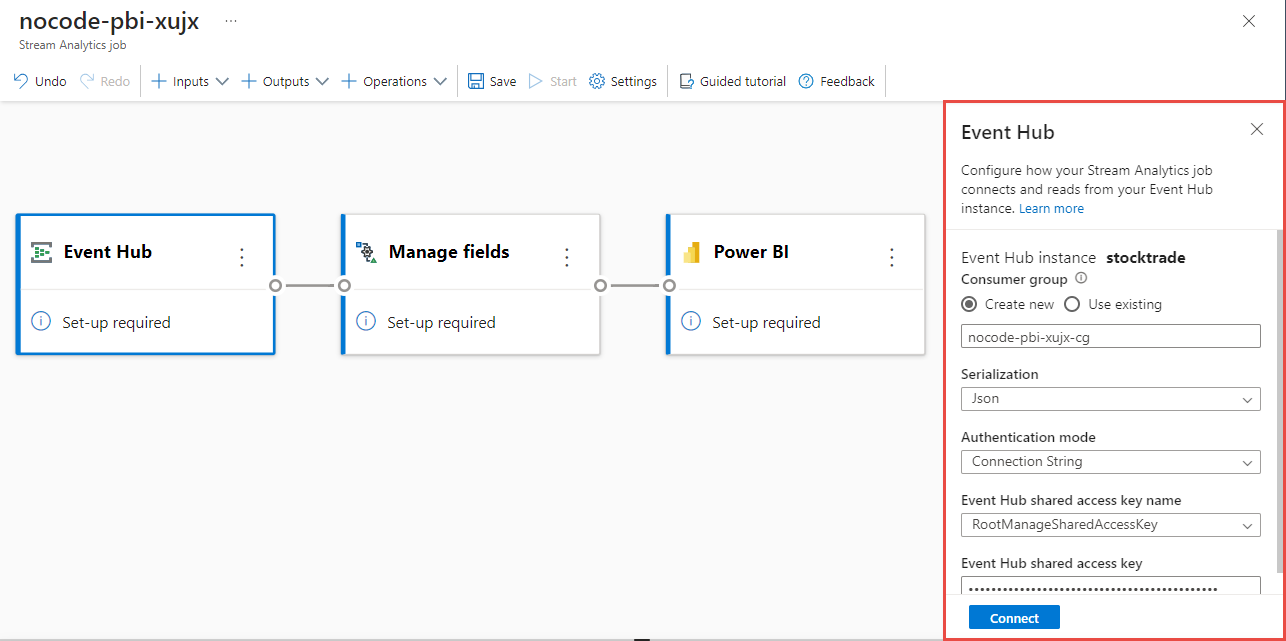
Enter a name for the Stream Analytics job, then select Create.

Specify the Serialization type of your data in the Event Hubs window and the Authentication method that the job uses to connect to the Event Hubs. Then select Connect.
When the connection is established successfully and you have data streams flowing into your Event Hubs instance, you immediately see two things:
Fields that are present in the input data. You can choose Add field or select the three dot symbol next to a field to remove, rename, or change its type.

A live sample of incoming data in the Data preview table under the diagram view. It automatically refreshes periodically. You can select Pause streaming preview to see a static view of the sample input data.

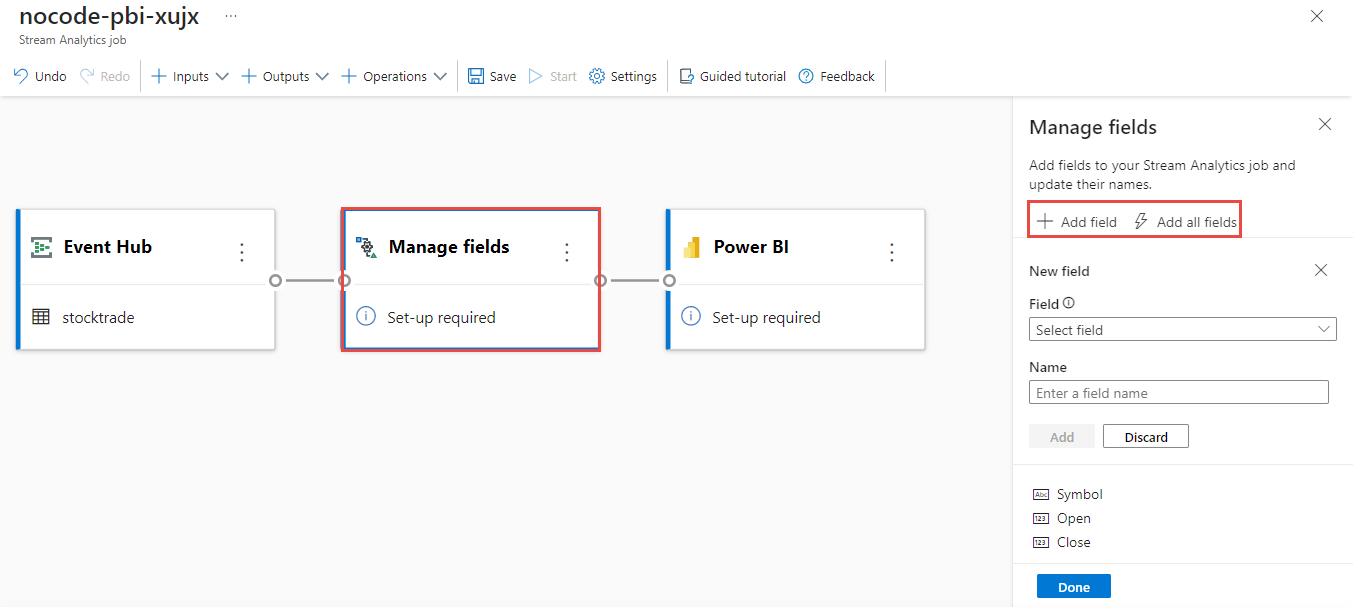
Select the Manage tile. In the Manage fields configuration panel, choose the fields you want to output. If you want to add all the fields, select Add all fields.
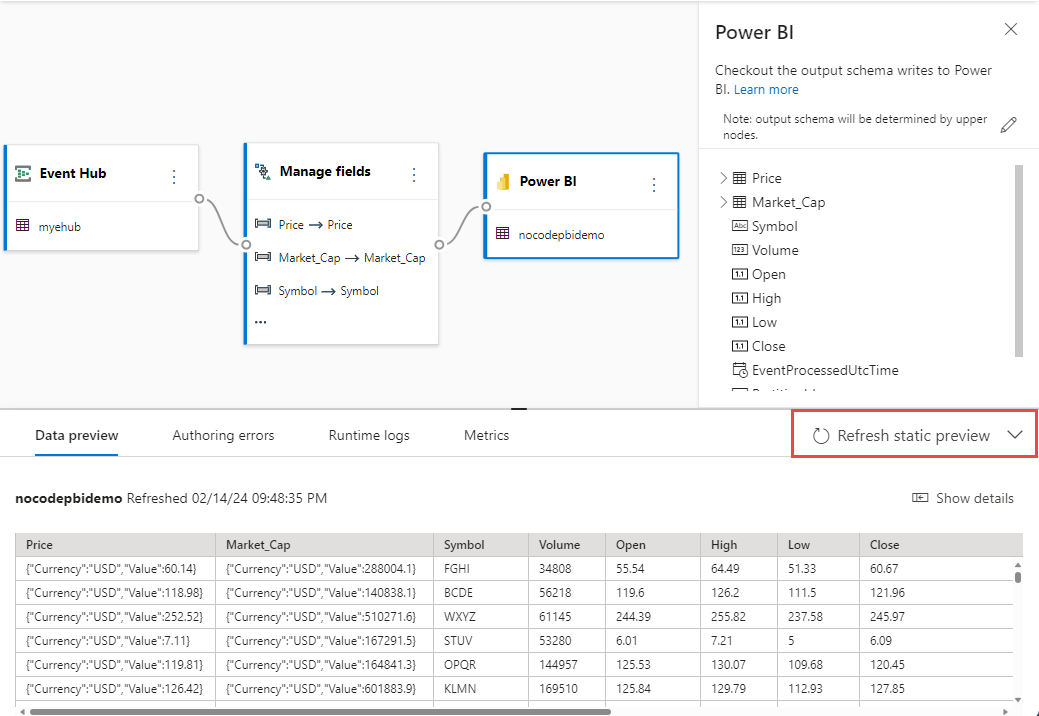
Select Power BI tile. In the Power BI configuration panel, fill in needed parameters and connect.
- Dataset: it's the Power BI destination where the Azure Stream Analytics job output data is written into.
- Table: it's the table name in the Dataset where the output data goes to.

Optionally, select Get static preview/Refresh static preview to see the data preview that will be ingested in event hub.
Select Save and then select Start the Stream Analytics job.
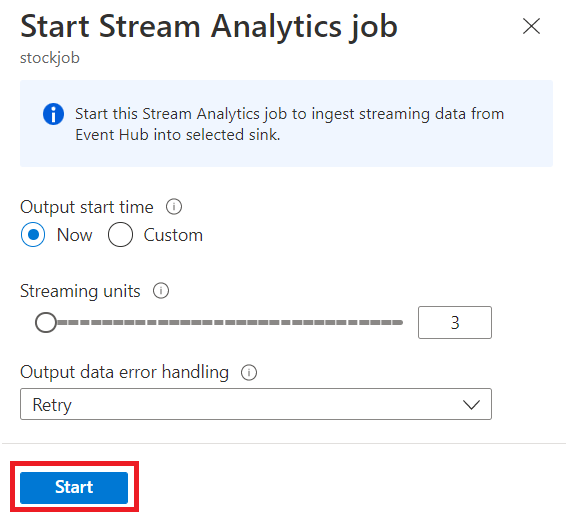
To start the job, specify:
- The number of Streaming Units (SUs) the job runs with. SUs represents the amount of compute and memory allocated to the job. We recommended that you start with three and then adjust as needed.
- Output data error handling – It allows you to specify the behavior you want when a job’s output to your destination fails due to data errors. By default, your job retries until the write operation succeeds. You can also choose to drop such output events.
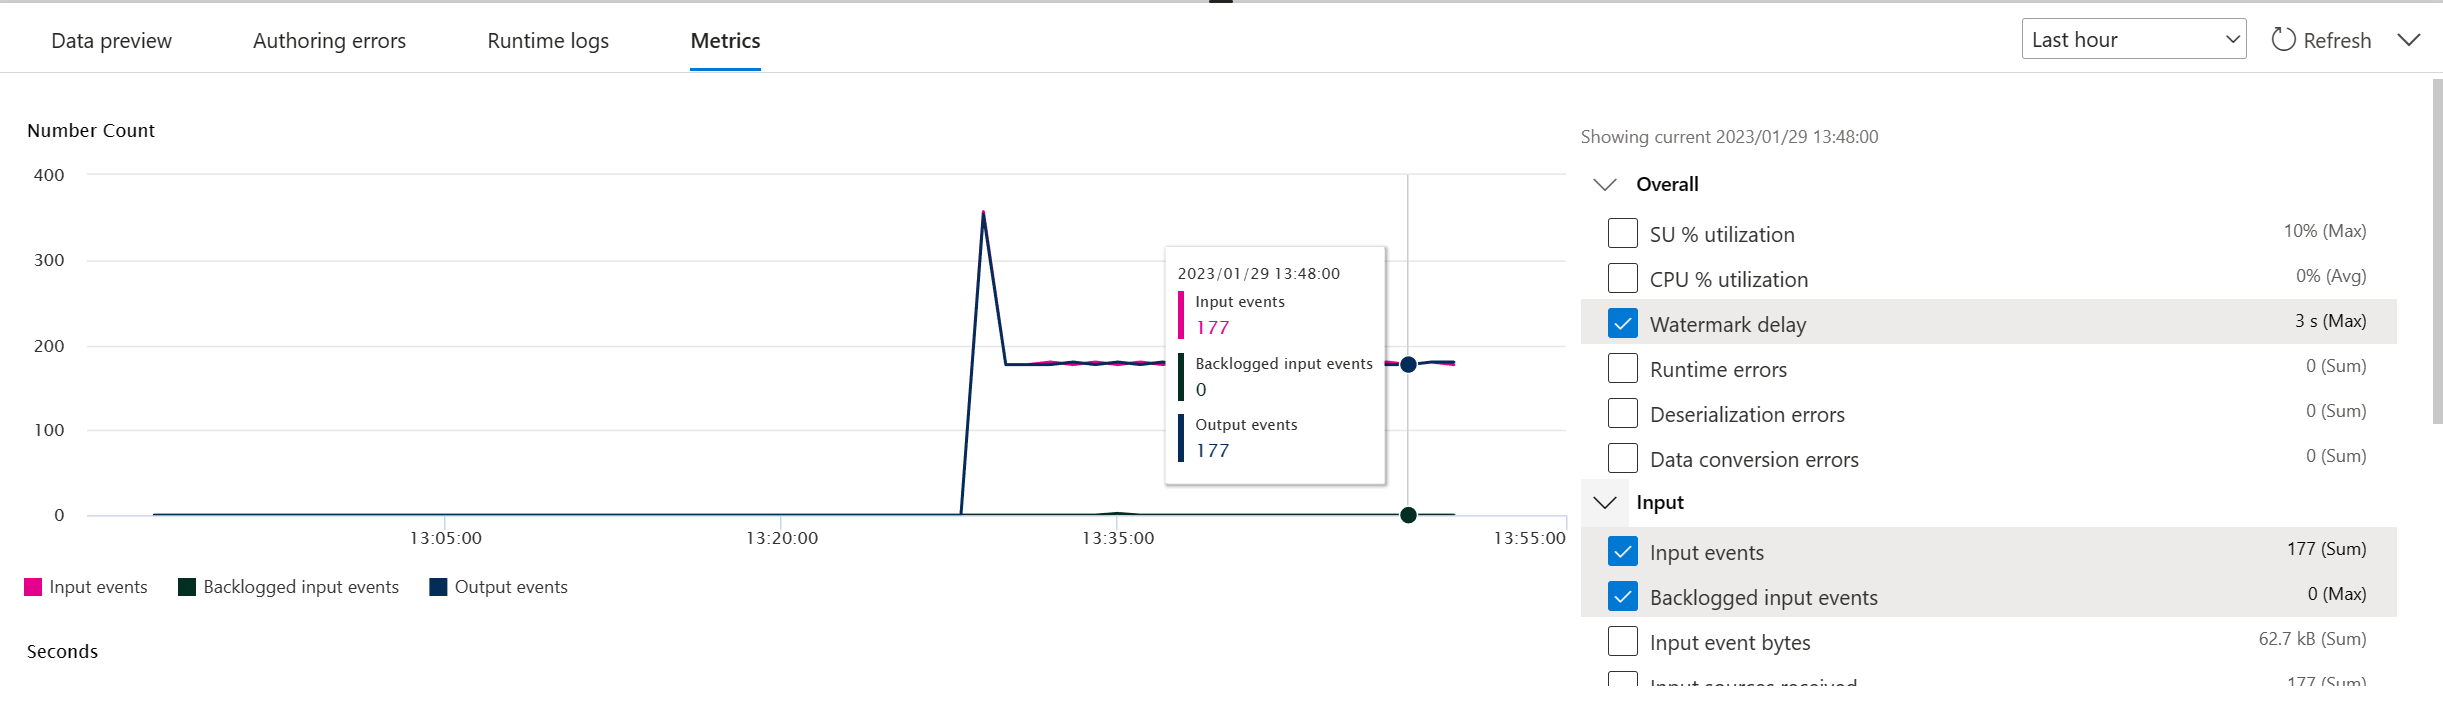
After you select Start, the job starts running within two minutes, and the metrics will be open in tab section.
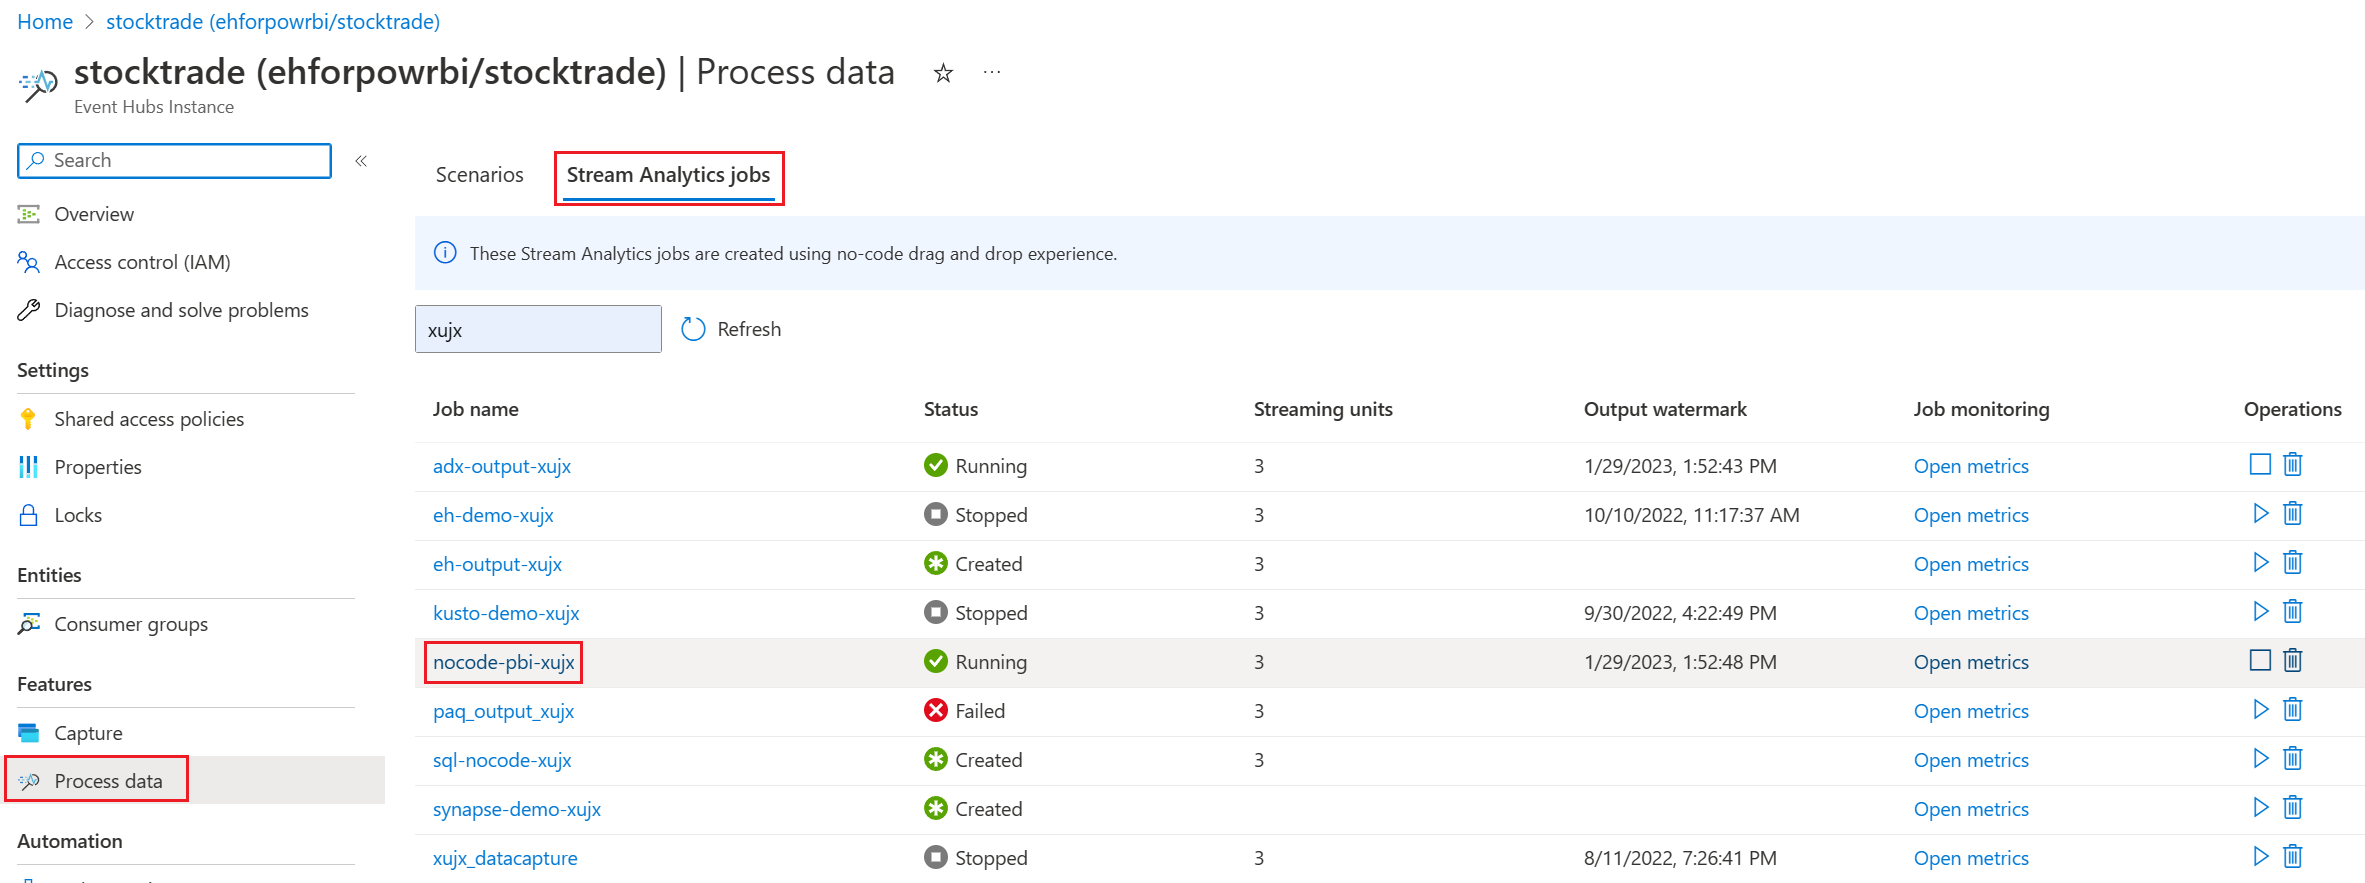
You can also see the job under the Process Data section on the Stream Analytics jobs tab. Select Open metrics to monitor it or stop and restart it, as needed.


Build the real-time dashboard in Power BI
Now, you have the Azure Stream Analytics job running and the data is continuously written into the table in the Power BI dataset you've configured. You can now create the real-time dashboard in Power BI workspace.
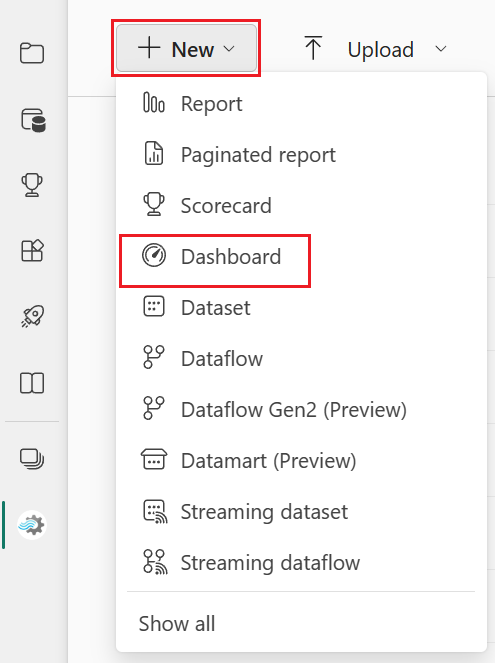
- Go to the Power BI workspace, which you've configured in above Power BI output tile, and select + New in the top left corner, then choose Dashboard to give the new dashboard a name.
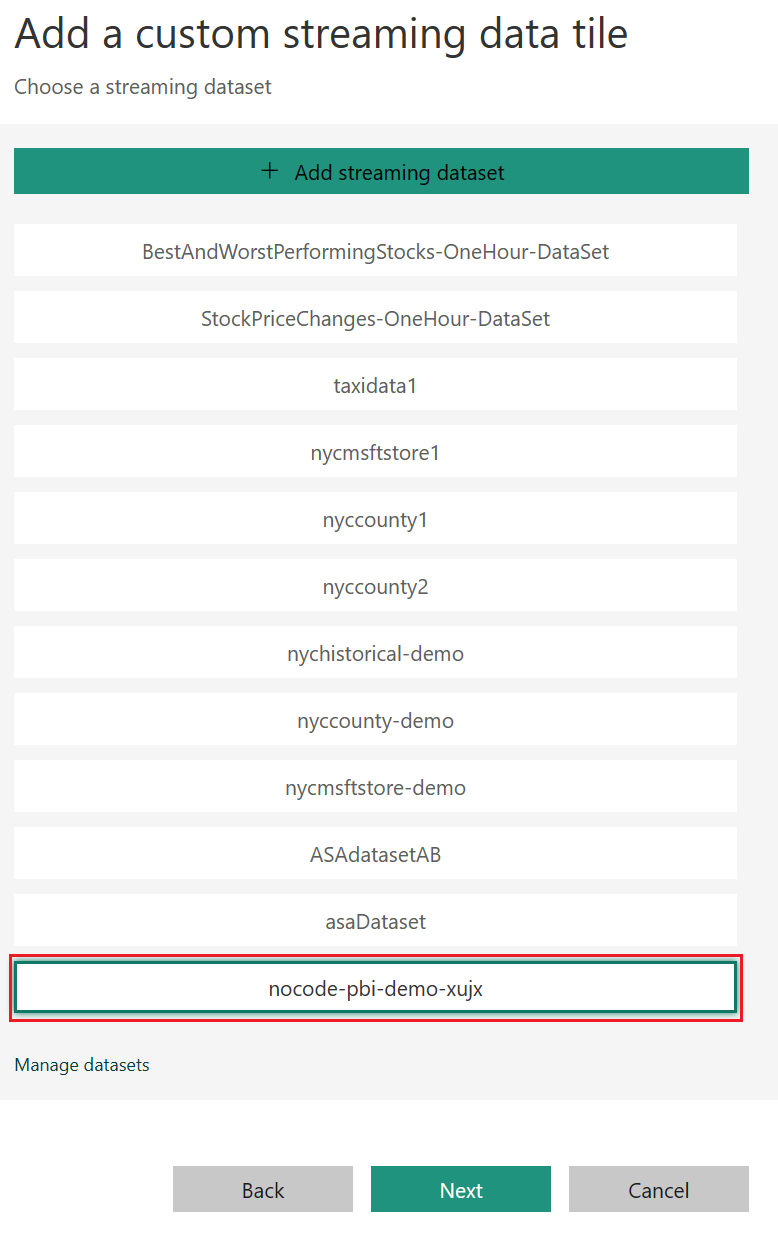
- Once the new dashboard is created, you'll be led to the new dashboard. Select Edit, and choose + Add a tile in the top menu bar. A right pane is open. Select Custom Streaming Data to go to next page.

- Select the streaming dataset (for example nocode-pbi-demo-xujx) which you've configured in Power BI node, and go to next page.
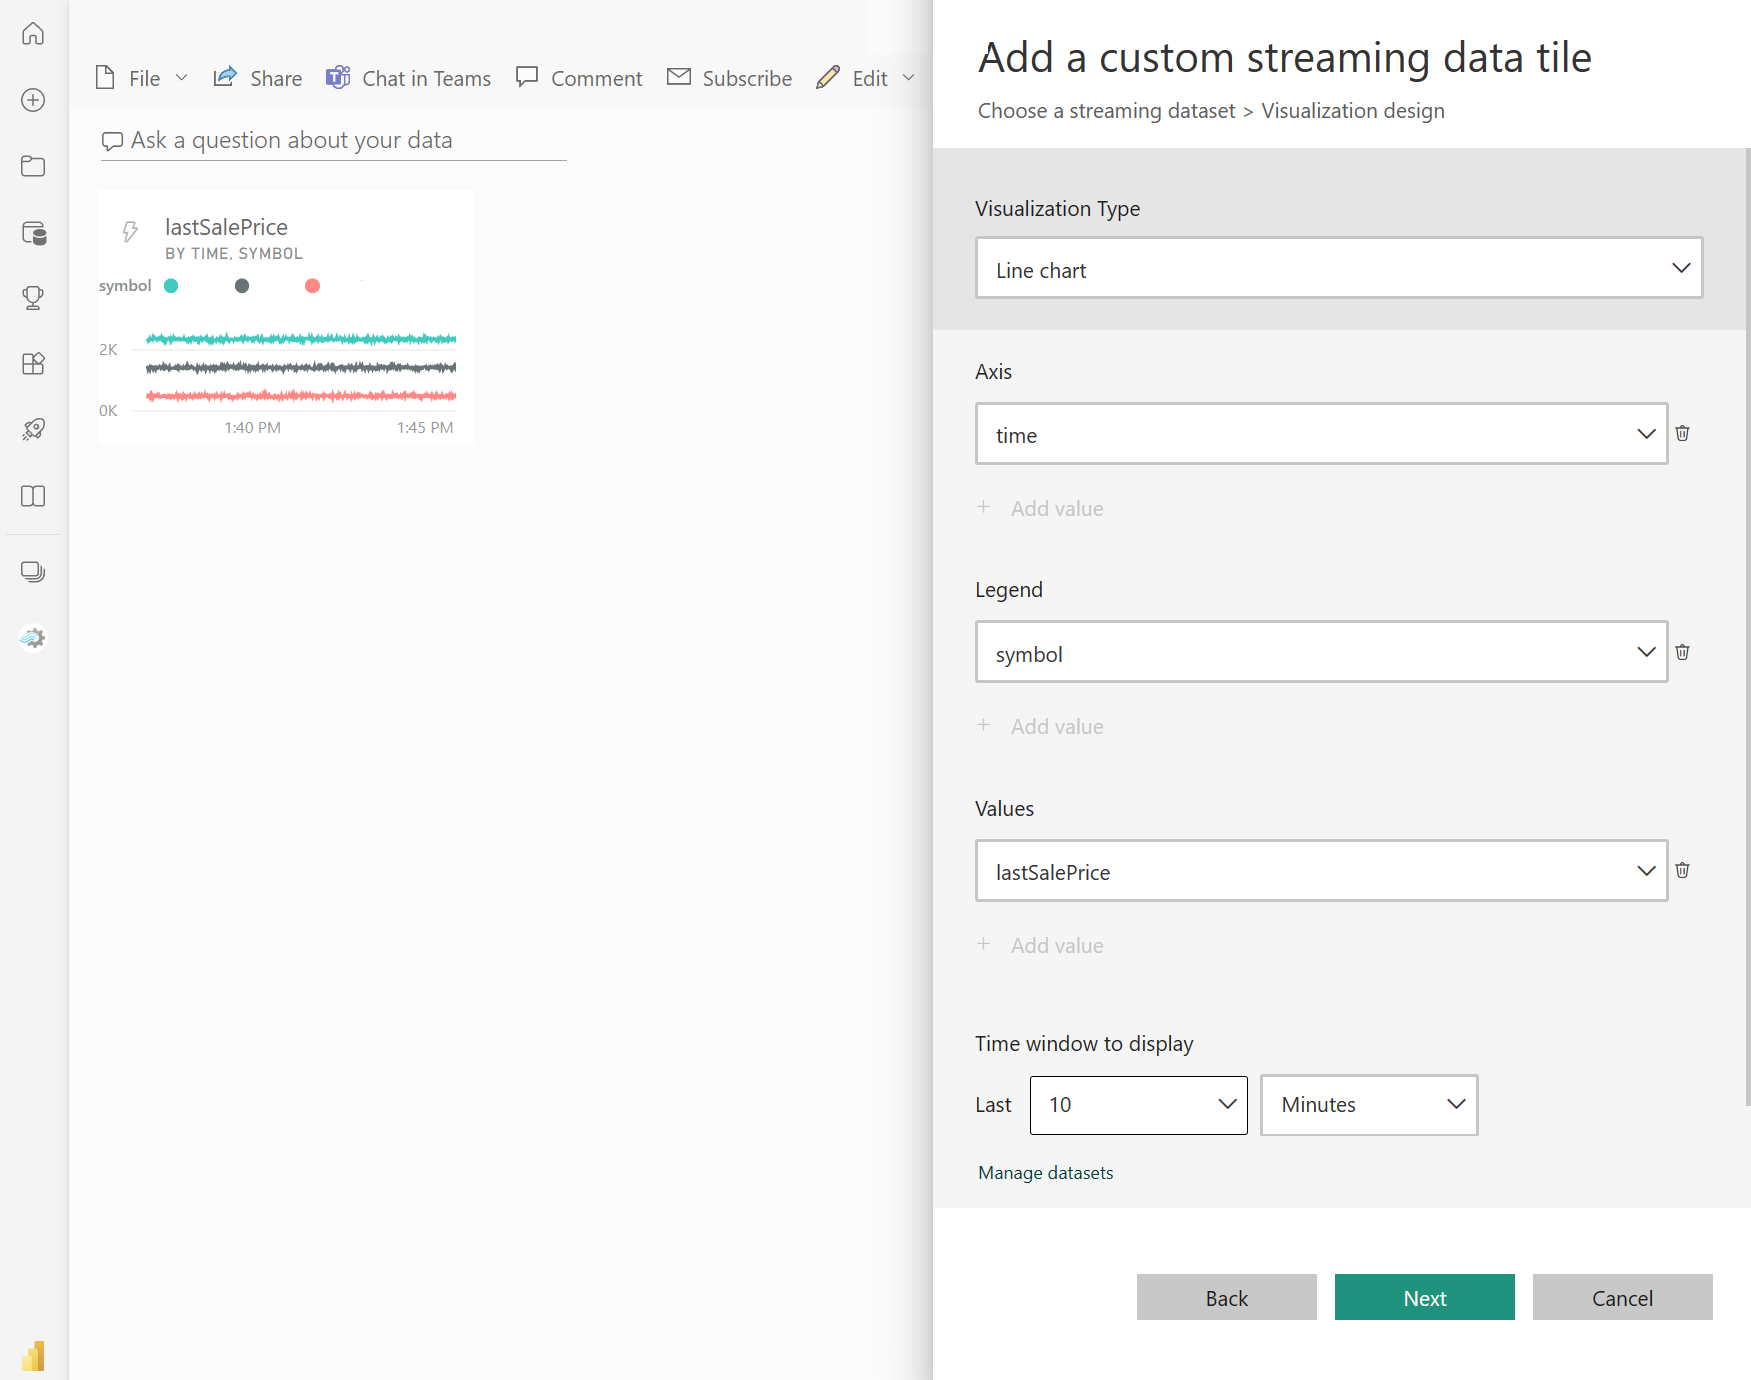
- Fill in the tile details, and follow the next step to complete the tile configuration.
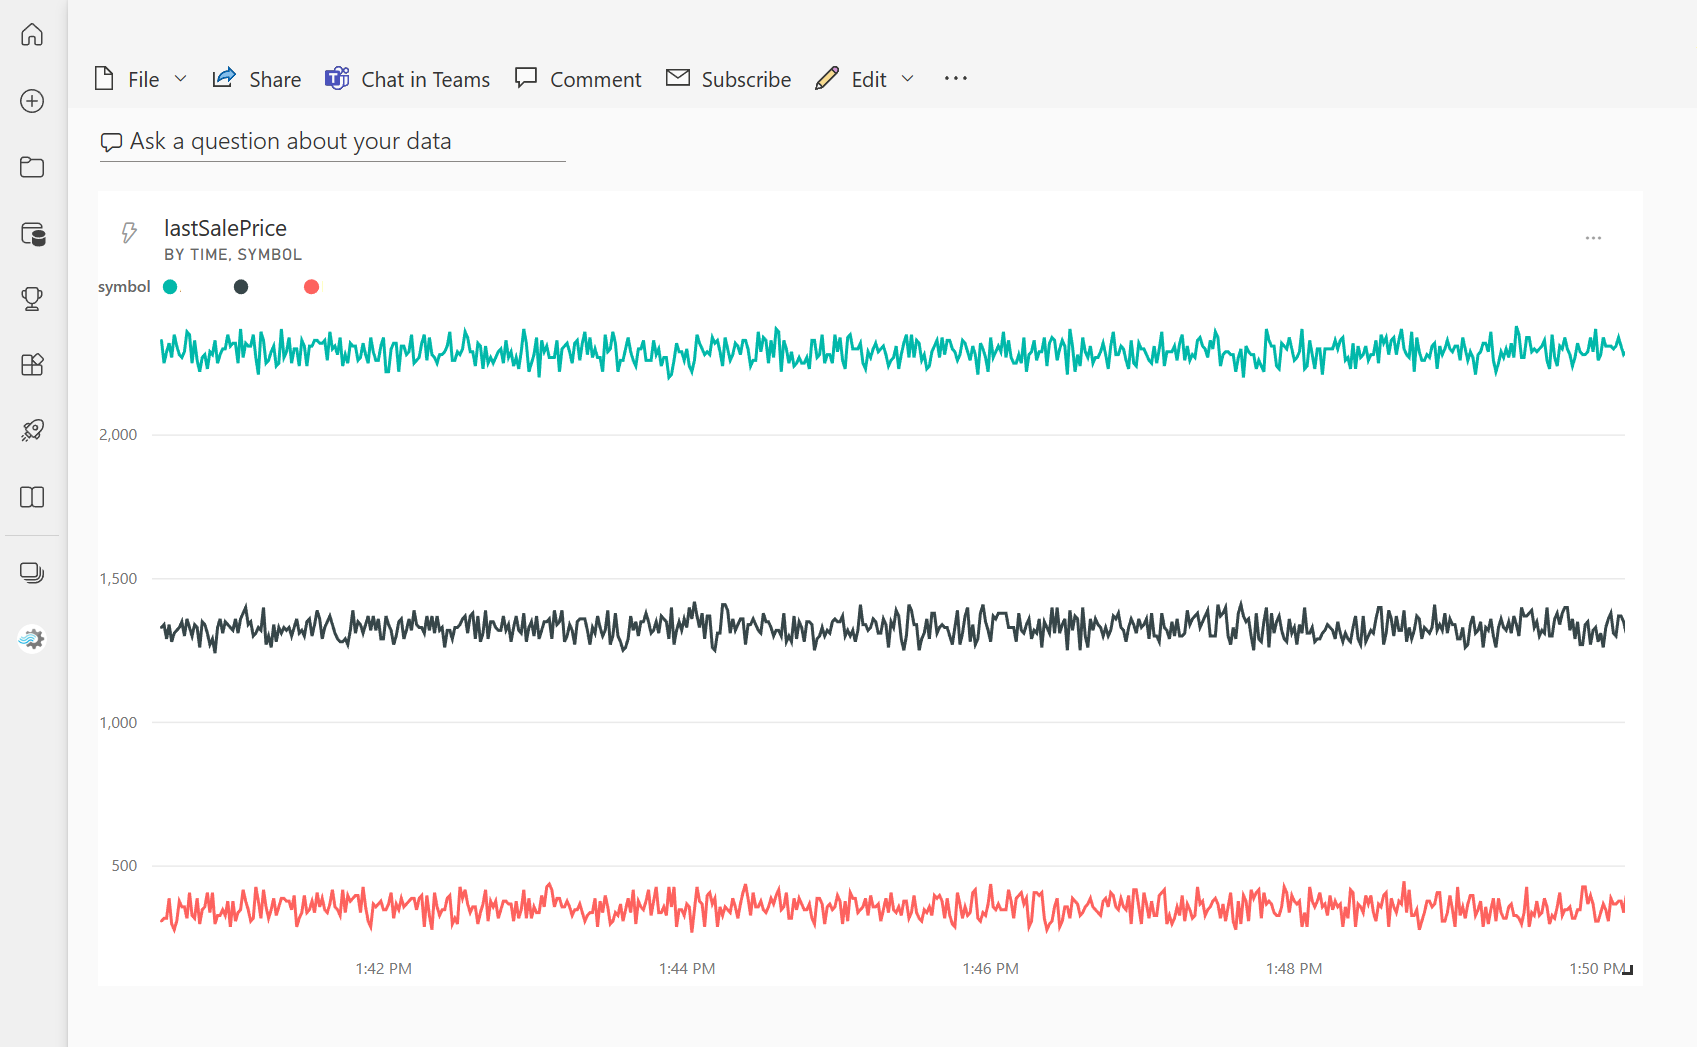
- Then, you can adjust its size and get the continuously updated dashboard as shown in the following example.


Next steps
Learn more about Azure Stream Analytics and how to monitor the job you've created.
Feedback
Coming soon: Throughout 2024 we will be phasing out GitHub Issues as the feedback mechanism for content and replacing it with a new feedback system. For more information see: https://aka.ms/ContentUserFeedback.
Submit and view feedback for