Přidání podpory přechodu k podrobnostem
Pokud má vizuál hierarchii, můžete uživatelům povolit, aby pomocí funkce přechodu k podrobnostem Power BI zobrazili další podrobnosti.
Přečtěte si další informace o funkci přechodu k podrobnostem Power BI v režimu přechodu k podrobnostem v služba Power BI. Pokud chcete vizuálu povolit nebo zakázat funkci přechodu k podrobnostem dynamicky, přečtěte si článek Dynamické řízení přechodu k podrobnostem.
Povolení podpory přechodu k podrobnostem ve vizuálu
Pokud chcete podporovat akce přechodu k podrobnostem ve vizuálu, přidejte do pojmenovaného drill-downpole nové polecapabilities.json. Toto pole má jednu vlastnost s názvem roles dataRole, pro kterou chcete povolit akce přechodu k podrobnostem.
    "drilldown": {
        "roles": [
            "category"
        ]
    }
Poznámka:
DataRole přechodu k podrobnostem musí být typu Grouping .
max vlastnost v podmínkách dataRole musí být nastavena na hodnotu 1.
Po přidání role do pole přechodu k podrobnostem můžou uživatelé přetáhnout více polí do role dat.
Příklad:
{
    "dataRoles": [
        {
            "displayName": "Category",
            "name": "category",
            "kind": "Grouping"
        },
        {
            "displayName": "Value",
            "name": "value",
            "kind": "Measure"
        }
    ],
    "drilldown": {
        "roles": [
            "category"
        ]
    },
    "dataViewMappings": [
        {
            "categorical": {
                "categories": {
                    "for": {
                        "in": "category"
                    }
                },
                "values": {
                    "select": [
                        {
                            "bind": {
                                "to": "value"
                            }
                        }
                    ]
                }
            }
        }
    ]
}
Vytvoření vizuálu s podporou přechodu k podrobnostem
Pokud chcete vytvořit vizuál s podporou přechodu k podrobnostem, spusťte následující příkaz:
pbiviz new testDrillDown -t default
Pokud chcete vytvořit výchozí ukázkový vizuál, použijte výše uvedený vzorek nově vytvořeného vizuálu capabilities.json .
Vytvořte vlastnost kontejneru pro div uložení elementů HTML vizuálu:
"use strict";

import "core-js/stable";
import "./../style/visual.less";
// imports

export class Visual implements IVisual {
    // visual properties
    // ...
    private div: HTMLDivElement; // <== NEW PROPERTY

    constructor(options: VisualConstructorOptions) {
        // constructor body
        // ...
    }

    public update(options: VisualUpdateOptions) {
        // update method body
        // ...
    }

    /**
     * Returns properties pane formatting model content hierarchies, properties and latest formatting values, Then populate properties pane.
     * This method is called once each time we open the properties pane or when the user edits any format property.
     */
    public getFormattingModel(): powerbi.visuals.FormattingModel {
        return this.formattingSettingsService.buildFormattingModel(this.formattingSettings);
    }
}
Aktualizujte konstruktor vizuálu:
export class Visual implements IVisual {
    // visual properties
    // ...
    private div: HTMLDivElement;

    constructor(options: VisualConstructorOptions) {
        console.log('Visual constructor', options);
        this.formattingSettingsService = new FormattingSettingsService();
        this.target = options.element;
        this.updateCount = 0;

        if (document) {
            const new_p: HTMLElement = document.createElement("p");
            new_p.appendChild(document.createTextNode("Update count:"));
            const new_em: HTMLElement = document.createElement("em");
            this.textNode = document.createTextNode(this.updateCount.toString());
            new_em.appendChild(this.textNode);
            new_p.appendChild(new_em);
            this.div = document.createElement("div"); // <== CREATE DIV ELEMENT
            this.target.appendChild(new_p);
        }
    }
}
Chcete-li vytvořit button, aktualizujte metodu vizuálu update :
export class Visual implements IVisual {
    // ...

    public update(options: VisualUpdateOptions) {
        this.formattingSettings = this.formattingSettingsService.populateFormattingSettingsModel(VisualFormattingSettingsModel, options.dataViews);
        console.log('Visual update', options);

        const dataView: DataView = options.dataViews[0];
        const categoricalDataView: DataViewCategorical = dataView.categorical;

        // don't create elements if no data
        if (!options.dataViews[0].categorical ||
            !options.dataViews[0].categorical.categories) {
            return
        }

        // to display current level of hierarchy
        if (typeof this.textNode !== undefined) {
            this.textNode.textContent = categoricalDataView.categories[categoricalDataView.categories.length - 1].source.displayName.toString();
        }

        // remove old elements
        // for better performance use D3js pattern:
        // https://d3js.org/#enter-exit
        while (this.div.firstChild) {
            this.div.removeChild(this.div.firstChild);
        }

        // create buttons for each category value
        categoricalDataView.categories[categoricalDataView.categories.length - 1].values.forEach( (category: powerbi.PrimitiveValue, index: number) => {
            let button = document.createElement("button");
            button.innerText = category.toString();

            this.div.appendChild(button);
        })

    }
    // ...
Použití jednoduchých stylů v .\style\visual.less:
button {
    margin: 5px;
    min-width: 50px;
    min-height: 50px;
}
Příprava ukázkových dat pro testování vizuálu:
| H1 | H2 | H3 | HODNOTY |
|---|---|---|---|
| A | A1 | A11 | 0 |
| A | A1 | A12 | 2 |
| A | A2 | A21 | 3 |
| A | A2 | A22 | 4 |
| A | A3 | A31 | 5 |
| A | A3 | A32 | 6 |
| T | B1 | B11 | 7 |
| T | B1 | B12 | 8 |
| T | B2 | B21 | 9 |
| T | B2 | B22 | 10 |
| T | B3 | B31 | 11 |
| T | B3 | B32 | 12 |
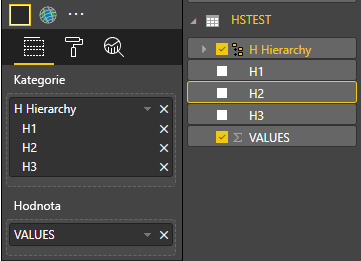
A vytvořte hierarchii v Power BI Desktopu:
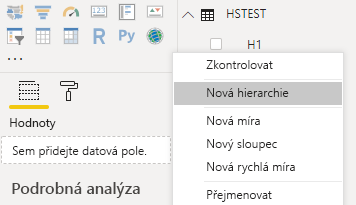
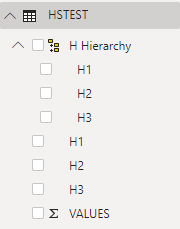
Do nové hierarchie zahrňte všechny sloupce kategorií (H1, H2, H3):
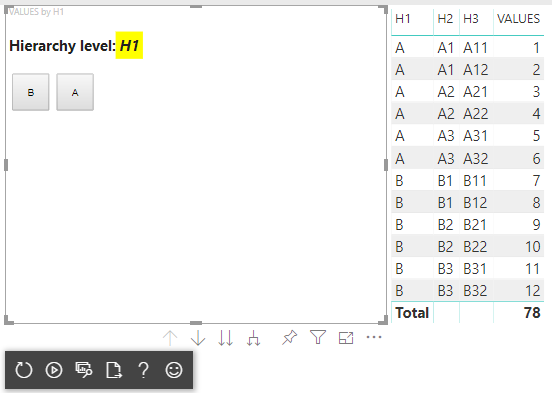
Po těchto krocích byste měli získat následující vizuál:
Přidání místní nabídky k vizuálním prvkům
Přidání místní nabídky do tlačítek ve vizuálu:
Uložte host objekt ve vlastnostech vizuálu a createSelectionManager volání metody pro vytvoření správce výběru, který zobrazí místní nabídku pomocí rozhraní API vizuálů Power BI.
"use strict";

import "core-js/stable";
import "./../style/visual.less";
// default imports

import IVisualHost = powerbi.extensibility.visual.IVisualHost;
import ISelectionManager = powerbi.extensibility.ISelectionManager;
import ISelectionId = powerbi.visuals.ISelectionId;

export class Visual implements IVisual {
    // visual properties
    // ...
    private div: HTMLDivElement;
    private host: IVisualHost; // <== NEW PROPERTY
    private selectionManager: ISelectionManager; // <== NEW PROPERTY

    constructor(options: VisualConstructorOptions) {
        // constructor body
        // save the host in the visuals properties
        this.host = options.host;
        // create selection manager
        this.selectionManager = this.host.createSelectionManager();
        // ...
    }

    public update(options: VisualUpdateOptions) {
        // update method body
        // ...
    }

    // ...
}
Změňte tělo zpětného forEach volání funkce na:
    categoricalDataView.categories[categoricalDataView.categories.length - 1].values.forEach( (category: powerbi.PrimitiveValue, index: number) => {
        // create selectionID for each category value
        let selectionID: ISelectionId = this.host.createSelectionIdBuilder()
            .withCategory(categoricalDataView.categories[0], index)
            .createSelectionId();

        let button = document.createElement("button");
        button.innerText = category.toString();

        // add event listener to click event
        button.addEventListener("click", (event) => {
            // call select method in the selection manager
            this.selectionManager.select(selectionID);
        });

        button.addEventListener("contextmenu", (event) => {
            // call showContextMenu method to display context menu on the visual
            this.selectionManager.showContextMenu(selectionID, {
                x: event.clientX,
                y: event.clientY
            });
            event.preventDefault();
        });

        this.div.appendChild(button);
    });
Použití dat ve vizuálu:
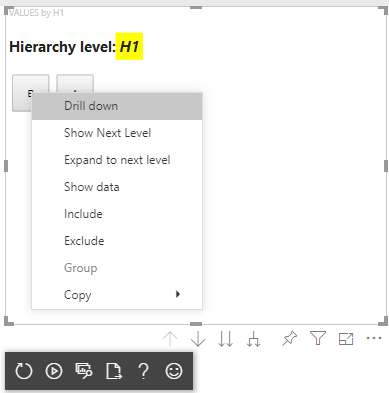
V posledním kroku byste měli získat vizuál s výběry a místní nabídkou:
Přidání podpory přechodu k podrobnostem pro mapování zobrazení maticových dat
Pokud chcete vizuál otestovat pomocí mapování zobrazení maticových dat, nejprve připravte ukázková data:
| Řádek 1 | Řádek 2 | Řádek 3 | Sloupec 1 | Sloupec 2 | Sloupec 3 | Hodnoty |
|---|---|---|---|---|---|---|
| R1 | R11 | R111 | S1 | C11 | C111 | 0 |
| R1 | R11 | R112 | S1 | C11 | C112 | 2 |
| R1 | R11 | R113 | S1 | C11 | C113 | 3 |
| R1 | R12 | R121 | S1 | C12 | C121 | 4 |
| R1 | R12 | R122 | S1 | C12 | C122 | 5 |
| R1 | R12 | R123 | S1 | C12 | C123 | 6 |
| R1 | R13 | R131 | S1 | C13 | C131 | 7 |
| R1 | R13 | R132 | S1 | C13 | C132 | 8 |
| R1 | R13 | R133 | S1 | C13 | C133 | 9 |
| R2 | R21 | R211 | C2 | C21 | C211 | 10 |
| R2 | R21 | R212 | C2 | C21 | C212 | 11 |
| R2 | R21 | R213 | C2 | C21 | C213 | 12 |
| R2 | R22 | R221 | C2 | C22 | C221 | 13 |
| R2 | R22 | R222 | C2 | C22 | C222 | 14 |
| R2 | R22 | R223 | C2 | C22 | C223 | 16 |
| R2 | R23 | R231 | C2 | C23 | C231 | 17 |
| R2 | R23 | R232 | C2 | C23 | C232 | 18 |
| R2 | R23 | R233 | C2 | C23 | C233 | 19 |
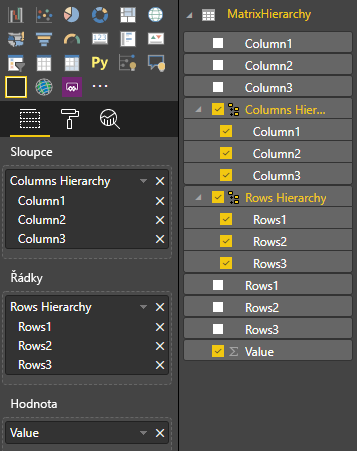
Pak na vizuál použijte následující mapování zobrazení dat:
{
    "dataRoles": [
        {
            "displayName": "Columns",
            "name": "columns",
            "kind": "Grouping"
        },
        {
            "displayName": "Rows",
            "name": "rows",
            "kind": "Grouping"
        },
        {
            "displayName": "Value",
            "name": "value",
            "kind": "Measure"
        }
    ],
    "drilldown": {
        "roles": [
            "columns",
            "rows"
        ]
    },
    "dataViewMappings": [
        {
            "matrix": {
                "columns": {
                    "for": {
                        "in": "columns"
                    }
                },
                "rows": {
                    "for": {
                        "in": "rows"
                    }
                },
                "values": {
                    "for": {
                        "in": "value"
                    }
                }
            }
        }
    ]
}
Použití dat ve vizuálu:
Import požadovaných rozhraní pro zpracování mapování zobrazení maticových dat:
// ...
import DataViewMatrix = powerbi.DataViewMatrix;
import DataViewMatrixNode = powerbi.DataViewMatrixNode;
import DataViewHierarchyLevel = powerbi.DataViewHierarchyLevel;
// ...
Vytvořte dvě vlastnosti pro dva divřádky a prvky sloupců:
export class Visual implements IVisual {
    // ...
    private rowsDiv: HTMLDivElement;
    private colsDiv: HTMLDivElement;
    // ...
    constructor(options: VisualConstructorOptions) {
        // constructor body
        // ...
        // Create div elements and append to main div of the visual
        this.rowsDiv = document.createElement("div");
        this.target.appendChild(this.rowsDiv);

        this.colsDiv = document.createElement("div");
        this.target.appendChild(this.colsDiv);
    }
    // ...
}
Před vykreslováním prvků zkontrolujte data a zobrazte aktuální úroveň hierarchie:
export class Visual implements IVisual {
    // ...
    constructor(options: VisualConstructorOptions) {
        // constructor body
    }

    public update(options: VisualUpdateOptions) {
        this.formattingSettings = this.formattingSettingsService.populateFormattingSettingsModel(VisualFormattingSettingsModel, options.dataViews);
        console.log('Visual update', options);

        const dataView: DataView = options.dataViews[0];
        const matrixDataView: DataViewMatrix = dataView.matrix;

        // if the visual doesn't receive the data no reason to continue rendering
        if (!matrixDataView ||
            !matrixDataView.columns ||
            !matrixDataView.rows ) {
            return
        }

        // to display current level of hierarchy
        if (typeof this.textNode !== undefined) {
            this.textNode.textContent = categoricalDataView.categories[categoricalDataView.categories.length - 1].source.displayName.toString();
        }
        // ...
    }
    // ...
}
Vytvoření funkce treeWalker pro procházení hierarchie:
export class Visual implements IVisual {
    // ...
    public update(options: VisualUpdateOptions) {
        // ...

        // if the visual doesn't receive the data no reason to continue rendering
        if (!matrixDataView ||
            !matrixDataView.columns ||
            !matrixDataView.rows ) {
            return
        }

        const treeWalker = (matrixNode: DataViewMatrixNode, index: number, levels: DataViewHierarchyLevel[], div: HTMLDivElement)  => {
            // ...
            if (matrixNode.children) {
                // ...
                // traversing child nodes
                matrixNode.children.forEach((node, index) => treeWalker(node, index, levels, childDiv));
            }
        }

        // traversing rows
        const rowRoot: DataViewMatrixNode = matrixDataView.rows.root;
        rowRoot.children.forEach((node, index) => treeWalker(node, index, matrixDataView.rows.levels, this.rowsDiv));

        // traversing columns
        const colRoot = matrixDataView.columns.root;
        colRoot.children.forEach((node, index) => treeWalker(node, index, matrixDataView.columns.levels, this.colsDiv));
    }
    // ...
}
Vygenerujte výběry pro datové body.
const treeWalker = (matrixNode: DataViewMatrixNode, index: number, levels: DataViewHierarchyLevel[], div: HTMLDivElement)  => {
    // generate selectionID for each node of matrix
    const selectionID: ISelectionID = this.host.createSelectionIdBuilder()
        .withMatrixNode(matrixNode, levels)
        .createSelectionId();
    // ...
    if (matrixNode.children) {
        // ...
        // traversing child nodes
        matrixNode.children.forEach((node, index) => treeWalker(node, index, levels, childDiv));
    }
}
Vytvořte div pro každou úroveň hierarchie:
const treeWalker = (matrixNode: DataViewMatrixNode, index: number, levels: DataViewHierarchyLevel[], div: HTMLDivElement)  => {
    // generate selectionID for each node of matrix
    const selectionID: ISelectionID = this.host.createSelectionIdBuilder()
        .withMatrixNode(matrixNode, levels)
        .createSelectionId();
    // ...
    if (matrixNode.children) {
        // create div element for level
        const childDiv = document.createElement("div");
        // add to current div
        div.appendChild(childDiv);
        // create paragraph element to display next
        const p = document.createElement("p");
        // display level name on paragraph element
        const level = levels[matrixNode.level];
        p.innerText = level.sources[level.sources.length - 1].displayName;
        // add paragraph element to created child div
        childDiv.appendChild(p);
        // traversing child nodes
        matrixNode.children.forEach((node, index) => treeWalker(node, index, levels, childDiv));
    }
}
Vytvoření buttons pro interakci s vizuálem a zobrazení místní nabídky pro maticové datové body:
const treeWalker = (matrixNode: DataViewMatrixNode, index: number, levels: DataViewHierarchyLevel[], div: HTMLDivElement)  => {
    // generate selectionID for each node of matrix
    const selectionID: ISelectionID = this.host.createSelectionIdBuilder()
        .withMatrixNode(matrixNode, levels)
        .createSelectionId();

    // create button element
    let button = document.createElement("button");
    // display node value/name of the button's text
    button.innerText = matrixNode.value.toString();

    // add event listener on click
    button.addEventListener("click", (event) => {
        // call select method in the selection manager
        this.selectionManager.select(selectionID);
    });

    // display context menu on click
    button.addEventListener("contextmenu", (event) => {
        // call showContextMenu method to display context menu on the visual
        this.selectionManager.showContextMenu(selectionID, {
            x: event.clientX,
            y: event.clientY
        });
        event.preventDefault();
    });

    div.appendChild(button);

    if (matrixNode.children) {
        // ...
    }
}
Před dalším vykreslením prvků vymažte div prvky:
public update(options: VisualUpdateOptions) {
    // ...
    const treeWalker = (matrixNode: DataViewMatrixNode, index: number, levels: DataViewHierarchyLevel[], div: HTMLDivElement)  => {
        // ...
    }

    // remove old elements
    // to better performance use D3js pattern:
    // https://d3js.org/#enter-exit
    while (this.rowsDiv.firstChild) {
        this.rowsDiv.removeChild(this.rowsDiv.firstChild);
    }
    // create label for row elements
    const prow = document.createElement("p");
    prow.innerText = "Rows";
    this.rowsDiv.appendChild(prow);

    while (this.colsDiv.firstChild) {
        this.colsDiv.removeChild(this.colsDiv.firstChild);
    }
    // create label for columns elements
    const pcol = document.createElement("p");
    pcol.innerText = "Columns";
    this.colsDiv.appendChild(pcol);

    // render elements for rows
    const rowRoot: DataViewMatrixNode = matrixDataView.rows.root;
    rowRoot.children.forEach((node, index) => treeWalker(node, index, matrixDataView.rows.levels, this.rowsDiv));

    // render elements for columns
    const colRoot = matrixDataView.columns.root;
    colRoot.children.forEach((node, index) => treeWalker(node, index, matrixDataView.columns.levels, this.colsDiv));
}
Nakonec byste měli získat vizuál s místní nabídkou:
Související obsah
Váš názor
Připravujeme: V průběhu roku 2024 budeme postupně vyřazovat problémy z GitHub coby mechanismus zpětné vazby pro obsah a nahrazovat ho novým systémem zpětné vazby. Další informace naleznete v tématu: https://aka.ms/ContentUserFeedback.
Odeslat a zobrazit názory pro