Monitor scenario health in Configuration Manager
Applies to: Configuration Manager (current branch)
You can use Configuration Manager to monitor the health of end-to-end scenarios. Monitoring scenario health enhances awareness of system latency and component backlogs which are critical for cloud service-attached features. Configuration Manager simulates activities to expose performance metrics and failure points.It simulates activities to expose performance metrics and failure points. These synthetic activities are similar to methods that Microsoft uses to monitor some components in its cloud services. Use this additional data to better understand timeframes for activities. If failures occur, it can help focus your investigation.
Starting in version 2010, Configuration Manager monitors the health for the following two scenarios:
SQL Server Service Broker: Many of the core subsystems in Configuration Manager use the service broker.
Client action health: Monitor the health of the fast channel used for client actions.
In the Configuration Manager console, go to the Monitoring workspace, and select the Scenario Health node. The list view displays the available scenarios:

Note
If you use a high availability option, scenario health only monitors the active node. For the SQL Server Service Broker scenario, it only applies to the primary replica of the SQL Server Always On availability group. The client action health scenario only applies to the site server in active mode.
Prerequisites
- Full administrator role in Configuration Manager, with scope to the top-level site
Actions for all scenarios
In the Scenario Health node, when you select a scenario, the following actions are available in the ribbon:
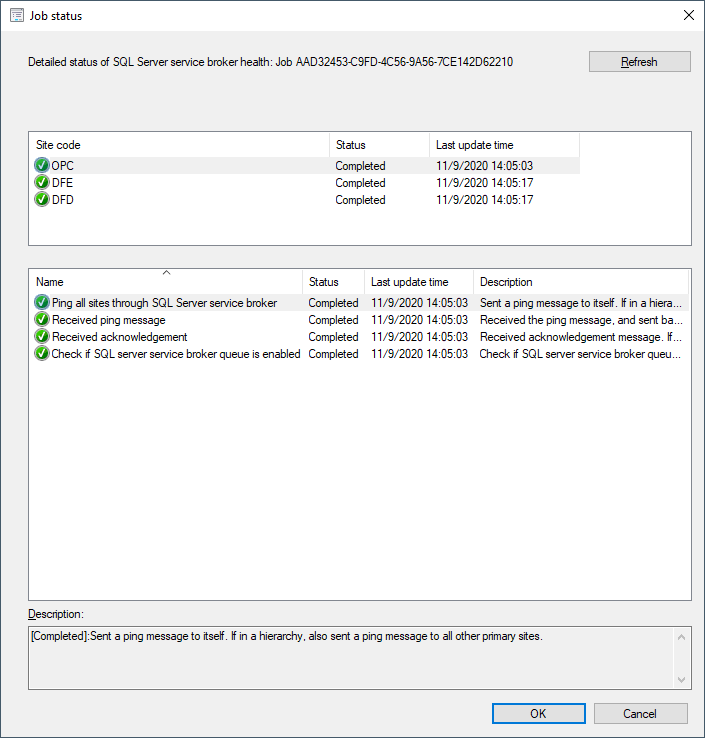
Show Status: This action is the main one you'll use to view the latest results of tests for the scenario. This action opens a window with more information. The top section shows the overall status per site. Select a site, to see more detailed status for that site in the bottom section.
Scenario Settings: Configure the settings for this scenario: such as whether it's enabled, and the time interval in minutes.
- Enable activity simulation and measurement: Enable the scenario health checks.
- Run time interval (minute): How frequently the site runs the scenario health checks. By default, Configuration Manager tests scenarios every 30 minutes.
- Job timeout (minute): How long the site waits for a specific test to complete. By default, the timeout is one hour (60 minutes).
History: Display the previous instances of the synthetic transaction. Use this history to track the scenario's health over time. From the history node, you can also Show Status of a specific instance.
Run Now: Trigger the site to check the scenario health. If a previous check isn't successful, you might use this action after you make changes to a site component. This action creates audit status message ID 54099.

SQL Server Service Broker
The SQL Server Service Broker is a required configuration for the site database. Many of the core subsystems in Configuration Manager use the service broker.
Configuration Manager includes the following tests for this scenario:
- Ping all sites through SQL Server services broker
- Received ping message
- Received acknowledgment: Check the last update times between the first three tests. If there's a long delay, it will impact Configuration Manager performance.
- Check if SQL server service broker queue is enabled: This test makes sure that the ConfigMgrHMSQueue is enabled. If the queue is disabled, it will impact many core features of Configuration Manager.
Note
Not all sites run all tests.
With this health information, you can see how long it takes for SQL Server to exchange messages via the service broker. A longer delay or timeout shows a backlog in the processing queue. A failure indicates a larger problem with the service broker, such as the queue is disabled. Since SQL Server service broker is a core component, issues with it can impact many other scenarios. For example, client notifications, client status, and some tenant attach features.
Client action health
Monitor the health of the fast channel used for client actions. If your environment is tenant attached with devices uploaded, this feature helps you see potential issues with client actions from the Microsoft Intune admin center. You can also use this feature for on-premises client actions. For example, CMPivot, run scripts, and device wake-up.
Configuration Manager includes the following tests for this scenario:
- Created client action: Tests that the site can create a client action using the administration service.
- CMPivot configuration: Makes sure that CMPivot is correctly configured on the central administration site (CAS). For more detail, see rcmctrl.log.
- Client action result: Tests that the CAS receives client action results from primary sites. This test can fail if the SQL Server Service Broker is unhealthy, or the site is in maintenance mode.
- Processed client action: For more detail, see objreplmgr.log.
- Client action inbox backlog: Checks the backlog for the objmgr.box inbox. If there's a large backlog, it impacts how quickly the site sends actions to clients. For more detail, see objreplmgr.log.
- Message Processing Engine backlog: Checks the backlog for the message processing engine. If there's a large backlog, it impacts how quickly the site processes results for client actions. For more detail, see SMS_MESSAGE_PROCESSING_ENGINE.log.
- Management point client action backlog: Checks the backlog for the SQL Server service broker queue ConfigMgrBGBQueue. If there's a large backlog, it impacts how quickly the management point can push actions to clients. Check the scenario health for the SQL Server service broker. For more detail, see the management point's bgbserver.log.
- Client action result summary: Checks the task to calculate client operation summary. For more detail, see statesys.log.
- Management point online status: Checks that management points are online and able to send actions to clients. For details, check the management point's ccmexec.log, bgbsetup.log, and bgbserver.log.
- Client health summary: Checks the client health scheduled task. For more detail, see statesys.log.
- Client state system inbox backlog: Checks the backlog for the inbox auth\statesys.box\incoming. If there's a large backlog, it impacts how quickly the site processes results for client actions. For more detail, see statesys.log.
Note
Not all sites run all tests.
Next steps
Feedback
Kommer snart: I hele 2024 udfaser vi GitHub-problemer som feedbackmekanisme for indhold og erstatter det med et nyt feedbacksystem. Du kan få flere oplysninger under: https://aka.ms/ContentUserFeedback.
Indsend og få vist feedback om