Collect diagnostic logs for Azure Stack HCI
Applies to: Azure Stack HCI, version 23H2
This article describes how to collect diagnostic logs and send them to Microsoft to help identify and fix any issues with your Azure Stack HCI solution.
On-demand log collection
On-demand log collection involves manually collecting and sending diagnostic logs to Microsoft using the Send-DiagnosticData cmdlet from any node within the Azure Stack HCI cluster. When you run this cmdlet, the logs are temporarily copied locally. This copy is parsed, sent to Microsoft, and then deleted from your system. Microsoft retains this diagnostic data for up to 30 days and handles it as per the standard privacy practices.
When to use on-demand log collection
Here are the scenarios in which you can perform on-demand log collection:
- Microsoft Support requests for logs based on an open case.
- Logs are collected when a cluster is connected and registered.
- Logs are collected when the Observability components are operational and installed.
- Logs are collected when a cluster is only partly registered.
- Logs are collected for issues not related to registration failures.
To explore additional log collection methods in Azure Stack HCI and understand when to use them, see Diagnostics.
Prerequisites
Before you collect on-demand logs, you must complete the following prerequisites:
- You must have access to an Azure Stack HCI cluster.
- You must have access to Azure.
- You must have installed the
AzureEdgeTelemetryAndDiagnosticsextension to collect telemetry and diagnostics information from your Azure Stack HCI system. For information about the extension, see Azure Stack HCI telemetry and diagnostics extension overview.
Perform on-demand log collection via PowerShell
You can perform on-demand log collection using PowerShell, the recommended method, or Windows Admin Center in the Azure portal, as described later in this article.
Run the Send-DiagnosticData cmdlet from any node on your Azure Stack HCI cluster to perform on-demand log collection.
Here are some important points to consider:
- The completion time of the
Send-DiagnosticDatacmdlet varies depending on factors, such as the roles for which logs are being collected, time duration specified, and the number of nodes in your Azure Stack HCI environment. - If you don't specify any parameters, the
Send-DiagnosticDatacmdlet collects data from all nodes for the previous one-hour duration.
Here's the syntax of Send-DiagnosticData:
Send-DiagnosticData [[-FilterByRole] <string[]>] [[-FromDate] <datetime>] [[-ToDate] <datetime>] [[-CollectSddc] <bool>] [<CommonParameters>]
For reference information on Send-DiagnosticData, see the Send-DiagnosticData command reference section later in this article.
Examples and sample outputs
Here are some example commands with sample outputs that show how to use the Send-DiagnosticData cmdlet with different parameters.
Send diagnostics data with date filtering
In this example, you send diagnostics data with date filtering for log files for the past two hours:
Send-DiagnosticData -FromDate (Get-Date).AddHours(-2) -ToDate (Get-Date)
Here's a sample output of this command:
PS C:\CloudDeployment\logs> Send-DiagnosticData -FromDate (Get-Date).AddHours(-2) -ToDate (Get-Date)
Converting FromDate and ToDate to UTC
FromDate in UTC is now 12/04/2023 19:14:18. ToDate in UTC is now 12/04/2023 21:14:18
The correlation Id is <Correlation-ID>. This is used to query for this log collection in the diagnostic pipeline.
Provide the below information to the customer support engineer working on your case.
AEORegion: eastus
AEODeviceARMResourceUri: /Subscriptions/<Subscription-ID>/resourceGroups/EDGECI-REGISTRATION/providers/Microsoft.AzureStackHCI/clusters/<cluster-name>
AEOClusterNodeArcResourceUri: /subscriptions/<Subscription-ID>/resourceGroups/EDGECI-REGISTRATION/providers/Microsoft.HybridCompute/machines/<v-host-name>
CorrelationId: <Correlation-ID>
Observability Agent is running.
Successfully submitted on-demand. Log collection Job Id: <Job-ID>. This is used to track the log collection with Get-LogCollectionHistory.
Current log collection status: Running
Waiting for log collection to complete...
==== CUT ==================== CUT =======
Log collection ended with status: Succeeded
PS C:\CloudDeployment\logs>
Send diagnostic data for specified roles
In this example, you send diagnostic data with role filtering for BareMetal and ECE:
Send-DiagnosticData -FilterByRole BareMetal, ECE –CollectSddc $false
Here's a sample output of this command:
PS C:\Users\docsuser> Send-DiagnosticData -FilterByRole BareMetal, ECE –CollectSddc $false
FromDate parameter not specified. Setting to default value 12/04/2023 20:41:21
ToDate parameter not specified. Setting to default value 12/04/2023 21:41:21
Converting FromDate and ToDate to UTC
FromDate in UTC is now 12/04/2023 20:41:21. ToDate in UTC is now 12/04/2023 21:41:21
The correlation Id is <Correlation-ID>. This is used to query for this log collection in the diagnostic pipeline.
Provide the below information to the customer support engineer working on your case.
AEORegion: eastus
AEODeviceARMResourceUri: /Subscriptions/<Subscription-ID>/resourceGroups/EDGECI-REGISTRATION/providers/Microsoft.AzureStackHCI/clusters/cluster-e5c7b2aa9a36490f9567b432a0eb51f1
AEOClusterNodeArcResourceUri: /subscriptions/<Subscription-ID>/resourceGroups/EDGECI-REGISTRATION/providers/Microsoft.HybridCompute/machines/v-Host1
CorrelationId: <Correlation-ID>
Observability Agent is running.
Successfully submitted on-demand. Log collection Job Id: <Job-ID>. This is used to track the log collection with Get-LogCollectionHistory.
Current log collection status: Running
Waiting for log collection to complete...
==== CUT ==================== CUT =======
Log collection ended with status: Succeeded
PS C:\Users\docsuser>
Get a history of log collection
You can get a history of all the log collections that you have performed. This history helps you learn about the kinds of log collections, the sizes of log collections, the times when logs were collected, and the methods of log collection.
To get a history of log collections for the last 90 days, enter:
Get-LogCollectionHistory
Here's a sample output of the Get-LogCollectionHistory cmdlet. Note that the datetime parameters are in the UTC timezone.
PS C:\CloudDeployment\logs> Get-LogCollectionHistory
Name                           Value
----                           -----
TimeCollected                  9/29/2022 5:08:14 PM +00:00
Status                         Succeeded
CollectionFromDate             9/29/2022 4:07:57 PM +00:00
CollectionToDate               9/29/2022 5:07:57 PM +00:00
LogCollectionId                fdcd94c8-1bd2-4ec6-8612-c92d5abd9a84
Type                           OnDemand
LogUploadSizeMb                1598
UploadNumberOfFiles            1924
Directory
Location
Error
----------                     ---------------------------------------------------------
TimeCollected                  9/27/2022 11:57:25 PM +00:00
Status                         Succeeded
CollectionFromDate             9/27/2022 9:57:16 PM +00:00
CollectionToDate               9/27/2022 11:57:16 PM +00:00
LogCollectionId                f3d8dcc6-901e-4c72-a3cc-210055e6f198
Type                           OnDemand
LogUploadSizeMb                1069
UploadNumberOfFiles            1941
Directory
Location
Error
PS C:\CloudDeployment\logs>
Save logs to a local file share
You can store diagnostic logs on a local Server Message Block (SMB) share if you have network issues or prefer to save data locally instead of sending it to Azure.
Follow these steps to save logs to a local share:
Run the following command to create a share:
New-SMBShare -Name <share-name> -Path <path-to-share> -FullAccess Users -ChangeAccess 'Server Operators'Run the following commands to create PSCredentials to the share:
$user = "<username>"
$pass = "<password>"
$sec=ConvertTo-SecureString -String $pass -AsPlainText -Force
$shareCredential = New-Object System.Management.Automation.PSCredential ($user, $sec)
Run the following command on each node of the cluster to collect logs and save them locally:
Send-DiagnosticData -SaveToPath <path to share> -ShareCredential $shareCredential
If you have outbound connectivity from the SMB share where you saved the logs, you can run the following command to send the logs to Microsoft:
Send-DiagnosticData NoLogCollection -SupplementaryLogs <path-to-share> -ShareCredentail $shareCredential
Provide required information in a support case
If you encounter an issue and need help from Microsoft Support, they might ask for specific information to locate your logs.
You can obtain this information from either the output of the Send-DiagnosticData cmdlet or directly from the problematic page in the Azure portal.
Provide information from the Send-DiagnosticData output
When you use Send-DiagnosticData to collect logs, it also provides key details in its output that you need to share with Microsoft Support. After you collect logs, they're sent to the Kusto database. Microsoft Support can then use the information provided to locate your logs in Kusto and help you in resolving the reported issue.
When requested, share the following information with Microsoft Support. Get this information from the Send-DiagnosticData output.
AEORegion: The location where your device is registered.AEODeviceARMResourceUri: A unique identifier to locate the resource, for example:/subscriptions/<subscription GUID>/resourceGroups/<Name of Resource group>/providers/Microsoft.AzureStackHCI/clusters/<Name of Cluster>.AEOClusterNodeArcResourceUri: A unique identifier to locate the ARC resource, for example:/subscriptions/<subscription GUID>/resourceGroups/<Name of Resource group>/providers/Microsoft.HybridCompute/Machines/<machine name>.CorrelationId: A unique identifier to locate the logs.
Provide information from the Azure portal page where issue occurs
On the problematic page in the Azure portal, press CTRL+ALT+A to download a diagnostic file with the following information: session ID and the URL. In most cases, this information is sufficient to get Microsoft Support started on troubleshooting.
If you're on any of the Azure Stack HCI blades where you're experiencing issues, the current URI has the resource ID needed to debug the service.
Send-DiagnosticData command reference
This section provides reference information on Send-DiagnosticData, including its parameters, syntax, and usage examples.
FromDate and ToDate
These parameters enable you to collect logs for a specific time period.
Syntax
Send-DiagnosticData [[-FilterByRole] <string[]>] [[-FromDate] <datetime>] [[-ToDate] <datetime>] [[-CollectSddc] <bool>] [<CommonParameters>]
Example
$fromDate = Get-Date -Date "11/30/2023 18:35:00"
$fromDate = Get-Date -Date "11/30/2023 18:35:00"
$toDate = Get-Date -Date "11/30/2023 19:35:00"
Send-DiagnosticData –FromDate $fromDate –ToDate $toDate
Extension version
All
FilterByRole
This parameter lets you choose which roles’ logs you want to collect. You can specify multiple roles. For a list of available roles on which you can filter logs, see Roles available for filtering logs.
Syntax
Send-DiagnosticData [[-FilterByRole] <string[]>]
Example
Send-DiagnosticData –FilterByRole “ALM” -CollectSddc $false
Extension version
All
CollectSddc
Determines whether to include or exclude software-defined data center (SDDC) logs. By default, SDDC logs are included. Set it to $false if you want to exclude them. For more information about using SDDC diagnostic tools, see Collect diagnostic data for clusters.
Syntax
Send-DiagnosticData [-CollectSddc <bool>]
Example
Send-DiagnosticData –CollectSddc $false
Extension version
All
BypassObsAgent
When bypassing the observability agent, logs are collected only on the node where the log collection was initiated. No record of the collection is kept in the history.
Syntax
Send-DiagnosticData [-BypassObsAgent]
Example
Send-DiagnosticData –BypassObsAgent
Extension version
All
SaveToPath
This parameter allows you to save the diagnostic logs to a specified path on the host machine, rather than transmitting them to Microsoft.
Syntax
Send-DiagnosticData -SaveToPath <string> [-FilterByRole <string[]>] [-FromDate <datetime>] [-ToDate <datetime>] [-CollectSddc <bool>] [-SupplementaryLogs <string>] [-ShareCredential <pscredential>] [-BypassObsAgent] [<CommonParameters>]
Examples
You can provide either a share path or an output path on the host to the SaveToPath parameter.
Send-DiagnosticData –SaveToPath <output path>
Send-DiagnosticData –SaveToPath <share path>
If you’re using a share path that is not mapped, you must also use the -ShareCredential parameter.
Send-DiagnosticData –SaveToPath <share path> -ShareCredential <credentials for share path>
You can use SaveToPath with other parameters, such as FilterByRole, FromDate, ToDate, CollectSddc, SupplementaryLogs, ShareCredential, and BypassObsAgent.
Send-DiagnosticData –SaveToPath <output path> -FIlterByRole <role>
Extension version
Versions 1.0.2.0 and above
NoLogCollection
The NoLogCollection switch parameter allows you to send an ad-hoc set of logs to Microsoft. When using this parameter, consider the following details:
- You can combine the
SupplementaryLogs,ShareCredential, andBypassObsAgentparameters with theNoLogCollectionparameter. - The
SupplementaryLogsparameter is mandatory when usingNoLogCollection. It specifies the path to the logs that need to be sent to Microsoft. - You have the flexibility to pass either a share path or an output path on the host to the
SupplementaryLogsparameter. If you’re using an unmapped share path, you must also use the-ShareCredentialparameter.
Syntax
Send-DiagnosticData -SupplementaryLogs <string> -NoLogCollection [-ShareCredential <pscredential>] [-BypassObsAgent] [<CommonParameters>]
Examples
Use –NoLogCollection with the mandatory SupplementaryLogs parameter:
Send-DiagnosticData –NoLogCollection –SupplementaryPath <output path>
Use –NoLogCollection with unmapped share path:
Send-DiagnosticData –NoLogCollection –SupplementaryPath <share path>
-ShareCredential <credential to share path>
Extension version
Versions 1.0.2.0 and above
SupplementaryLogs
The SupplementaryLogs parameter allows you to send ad-hoc logs to Microsoft.
Syntax
You can use it in the following ways:
With SaveToPath. In this scenario, both diagnostic logs and ad-hoc logs are collected and saved to a specified path.
Send-DiagnosticData [-SupplementaryLogs <string>] -SaveToPath <path>
With NoLogCollection. Here, only ad-hoc logs are collected and sent to Microsoft. No diagnostic logs are collected.
Send-DiagnosticData -SupplementaryLogs <string> -NoLogCollection
Without SaveToPath or NoLogCollection. This means that both diagnostic logs and ad-hoc logs are collected and sent to Microsoft.
Send-DiagnosticData [-SupplementaryLogs <string>]
When collecting both diagnostic and ad-hoc logs, you can use the SupplementaryLogs parameter with other parameters such as FilterByRole, FromDate, ToDate, and CollectSddc.
Examples
Without SaveToPath or NoLogCollection:
Send-DiagnosticData –SupplementaryLogs <path to adhoc logs to collect>
With SaveToPath:
Send-DiagnosticData –SaveToPath <path> -SupplementaryLogs <path to adhoc logs to collect>
With NoLogCollection:
Send-DiagnosticData –NoLogCollection –SupplemenatryLogs <path to adhoc logs to collect>
Extension version
Versions 1.0.2.0 and above
ShareCredential
This parameter provides the flexibility to either collect logs and save them to a share path or directly send logs from a share path to Microsoft.
Syntax
Save logs to a path:
Send-DiagnosticData [-ShareCredential <pscredential>] -SaveToPath <path>
Send logs on a share path to Microsoft:
Send-DiagnosticData [-ShareCredential <pscredential>] -SupplementaryLogs <path> -NoLogCollection;
Examples
Save logs to a path:
Send-DiagnosticData –SaveToPath <share path> -ShareCredential <credential to share path>
Send logs on a share path to Microsoft:
Send-DiagnosticData –NoLogCollection –SupplementaryLogs <share path> –ShareCredential <credential to the share path>
Extension version
All
(Plan to deprecate) ToSMBShare
This parameter allows you to save logs either to an output path or a share path. If you were using a share path that wasn't mapped, you needed to use the ShareCredential parameter as well. Since this parameter will be removed in future versions of the extension, use the -SaveToPath parameter instead.
Syntax
Send-DiagnosticData –ToSMBShare –SharePath <path> [-ShareCredential <pscredential>]
Examples
Save logs to an output path or share path:
Send-DiagnosticData –ToSMBShare –SharePath <output path or share path>
Save logs to a share path that's not mapped:
Send-DiagnosticData –ToSMBShare –SharePath <share path> -ShareCredential <credential for the share path>
Extension version
Initially accessible across all versions, however, this parameter will eventually be limited to Versions 0.1.42 and earlier.
(Plan to deprecate) FromSMBShare
This parameter allows you to send logs from an output path or share path directly to Microsoft. If you were using a share path that wasn't mapped, you needed to use the ShareCredential parameter as well. Since this parameter will be removed in future versions of the extension, use the -NoLogCollection parameter instead.
Syntax
Send-DiagnosticData –FromSMBShare –SharePath <path> [-ShareCredential <pscredential>]
Examples
Send-DiagnosticData –FromSMBShare –SharePath <output path or share path>
Send-DiagnosticData –FromSMBShare –SharePath <share path>
Extension version
Initially accessible across all versions, however, this parameter will eventually be limited to Versions 0.1.42 and earlier.
(Plan to deprecate) SharePath
The SharePath parameter can be used for one of the following purposes:
- Save diagnostic logs to a share path or output path.
- Send logs to Microsoft from a share path or output path. If you're using a share path and the share path is not mapped, then the
ShareCredentialparameter must also be used.
Since this parameter will be removed in future versions of the extension, use the –SaveToPath to save logs to a path, or –SupplementaryLogs when sending ad-hoc logs to Microsoft instead.
Syntax
Send-DiagnosticData –ToSMBShare –SharePath <path> [-ShareCredential <pscredential>];
Send-DiagnosticData –FromSMBShare –SharePath <path> [-ShareCredential <pscredential>];
Examples
Send-DiagnosticData –ToSMBShare –SharePath <output path or share path>
Send-DiagnosticData –ToSMBShare –SharePath <share path> -ShareCredential <credential for the share path>
Send-DiagnosticData –FromSMBShare –SharePath <output path or share path>
Send-DiagnosticData –FromSMBShare –SharePath <share path>
Extension version
Initially accessible across all versions, however, this parameter will eventually be limited to Versions 0.1.42 and earlier.
Roles available for filtering logs
The following roles are available for filtering by the FilterByRole parameter. The available roles may be different in a future release.
| Role name | Description |
|---|---|
| ALM | Application Lifecycle Management (ALM) involves managing the development, testing, deployment, and maintenance for software applications. |
| ArcAgent | An agent that allows management of Windows Server via Azure Arc. See Overview of Azure Connected Machine agent. |
| BareMetal | Infrastructure role that allows you to run services on bare metal servers without a virtualization layer. You can have full access and control over the operating system and hardware. |
| CommonInfra | Collects logs for common infrastructure components, such as networking, storage, and security. |
| DeploymentLogs | Records details of the deployment process, including steps taken, encountered errors, and operation status. |
| ECE | Manages lifecycle workflows, including deployment, update, add-node, and node replacement. |
| Extension | Data related to Azure managed extensions. |
| FleetDiagnosticsAgent | Listens for health triggers to start log collection. These logs are used to diagnose problems with FleetDiagnosticsAgent and log collection. |
| HCICloudService | An Azure cloud service that provides core functionality for Azure Stack HCI. It combines Azure power with the flexibility of on-premises servers. |
| DownloadService | Part of infra service to download update content. |
| Health | Collects health, performance, and usage data from various sources, such as event logs and performance counters. |
| HostNetwork | Logs used to troubleshoot Network ATC, the underlying operating system component used to configure host networking. |
| MOC_ARB | Management stack that enables cloud-based management of virtual machines on Azure Stack HCI and Windows Server. |
| NC | Information related to the network infrastructure. |
| ObservabilityLogmanTraces | Collects logs for Observability traces. These logs help with troubleshooting issues with sending diagnostic data. |
| ObservabilityVolume | Collects logs for Observability volume. |
| OEMDiagnostics | Collects logs for OEM diagnostics, which can help to identify and resolve issues with your server hardware, such as BIOS, drivers, sensors, and more. |
| OSUpdateLogs | Role that collects logs related to operating system updates on Azure Stack HCI nodes, useful for troubleshooting update-related issues. |
| RemoteSupportAgent | Logs that help troubleshoot issues with remote support sessions, which are used to address customer support cases. |
| TestObservability | Collects logs from the Test-Observability cmdlet, which is used to test that the TelemetryAndDiagnostics extension is working properly. |
| URP | Consists of logs related to the UpdateService and OsUpdate ECE role events. The Update Service manages updates for Azure Stack HCI systems. The OsUpdate ECE role is used to acquire and install operating system updates on machines (physical hosts and InfraVMs) which aren't part of the cluster during the deployment, add node, repair node, and Infra VMs update scenarios. Traces from these two components are part of the URP role. |
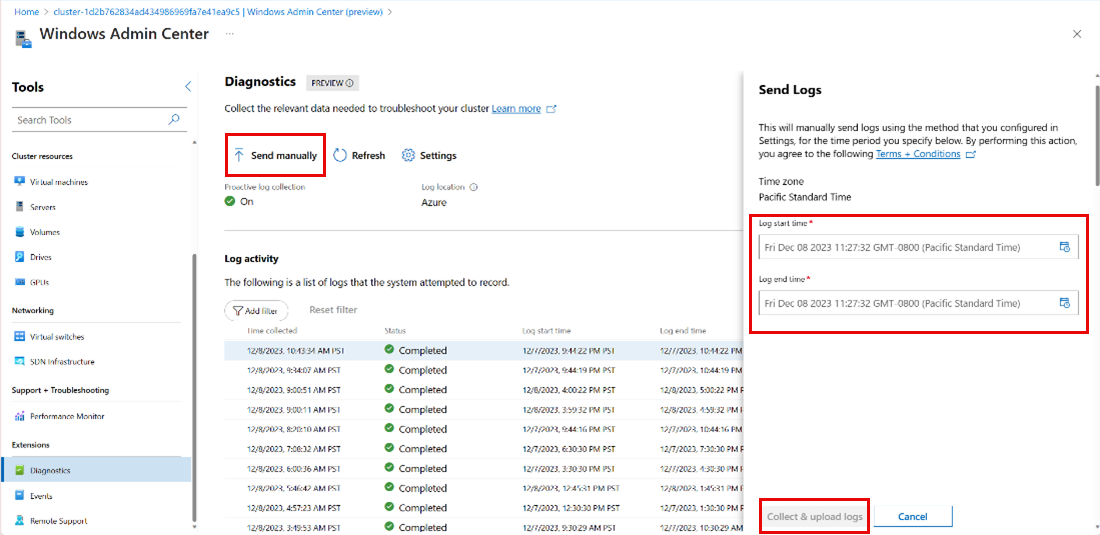
Perform on-demand log collection via Windows Admin Center in the Azure portal
The Diagnostics extension in Windows Admin Center in the Azure portal enables you to perform on-demand log collection and share the logs with Microsoft.
Follow these steps to perform on-demand log collection via Windows Admin Center in the Azure portal:
Connect to Windows Admin Center in the Azure portal. For information, see Manage Azure Stack HCI clusters using Windows Admin Center in Azure.
In the left pane, under Extensions, select Diagnostics.
On the Diagnostics page, under Log activity review log collection history or select a row to show the details about a specific log collection.
Select Send manually. In the context pane on the right, enter the log start and end time and then select Collect & upload logs.

Next steps
Feedback
Kommer snart: I hele 2024 udfaser vi GitHub-problemer som feedbackmekanisme for indhold og erstatter det med et nyt feedbacksystem. Du kan få flere oplysninger under: https://aka.ms/ContentUserFeedback.
Indsend og få vist feedback om