Set up metric alerts for Azure Stack HCI
Applies to: Azure Stack HCI, version 23H2
This article describes how to set up metric alerts for Azure Stack HCI.
For information about how to set up log alerts, see Set up log alerts for Azure Stack HCI systems.
Prerequisites
Before you begin, make sure that the following prerequisites are completed:
You have access to an Azure Stack HCI cluster that is deployed and registered.
The
AzureEdgeTelemetryAndDiagnosticsextension must be installed to collect telemetry and diagnostics information from your Azure Stack HCI system. For more information about the extension, see Azure Stack HCI telemetry and diagnostics extension overview.
Create metrics alerts
A metric alert rule monitors a resource by evaluating conditions on the resource metrics at regular intervals. If the conditions are met, an alert is fired. A metric time-series is a series of metric values captured over a period of time. You can use these metrics to create alert rules.
To learn more about metric alerts and how to create alert rules, see Metric alerts and Create Azure Monitor alert rules.
To learn about the metrics on which alerts can be set up, see What metrics are collected?.
You can create metric alerts for your Azure Stack HCI cluster through metrics explorer in the Azure portal or command-Line Interface (CLI).
Create metric alerts through metrics explorer
Follow these steps to create alerts through metrics explorer:
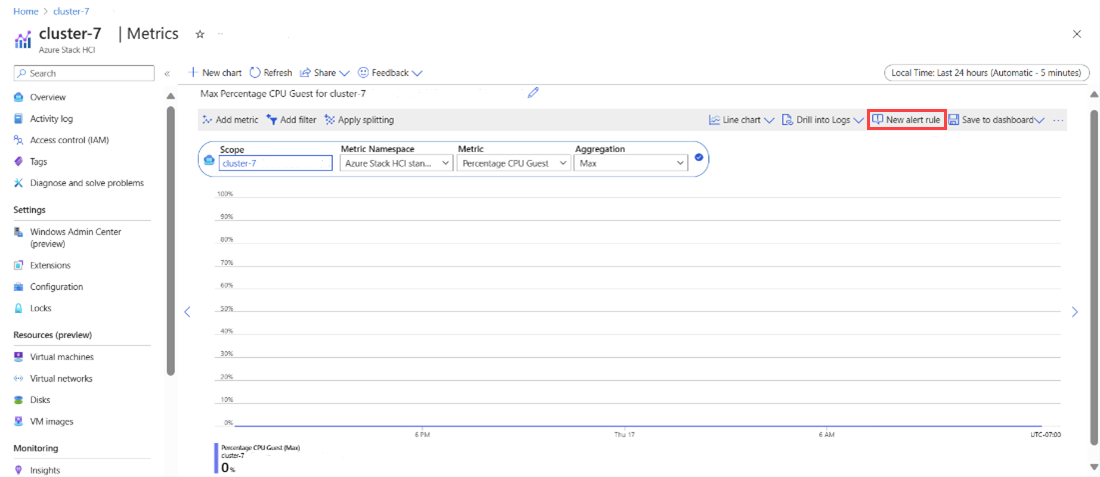
In the Azure portal, select Metrics under the Monitoring section.
Select Scope and then select Metric Namespace as Azure Stack HCI.
Select the Metric on which you want to set up alerts.
Select New alert rule.
Select the signal name and then select Apply.
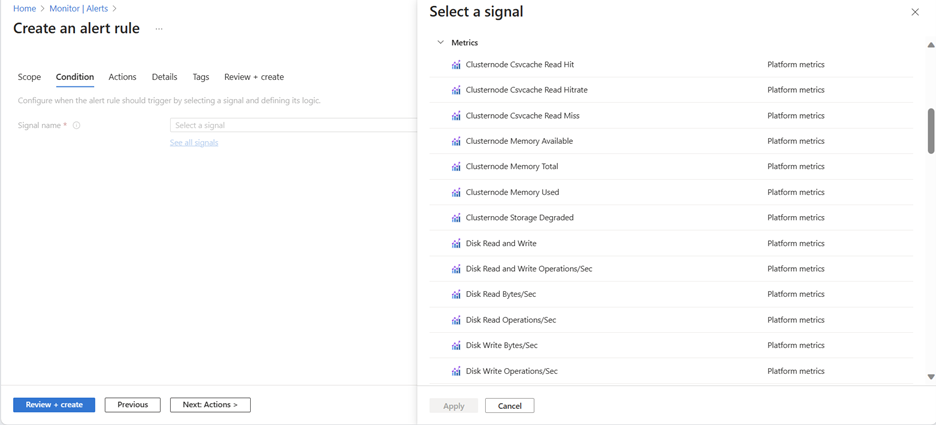
Preview the results of the selected metric signal in the Preview section. Select values for the Time range and Time series.
In the Alert logic section, add details like threshold, operator, aggregation type, threshold values, unit, threshold sensitivity, aggregation granularity, and frequency of evaluation and then select Next: Actions >.

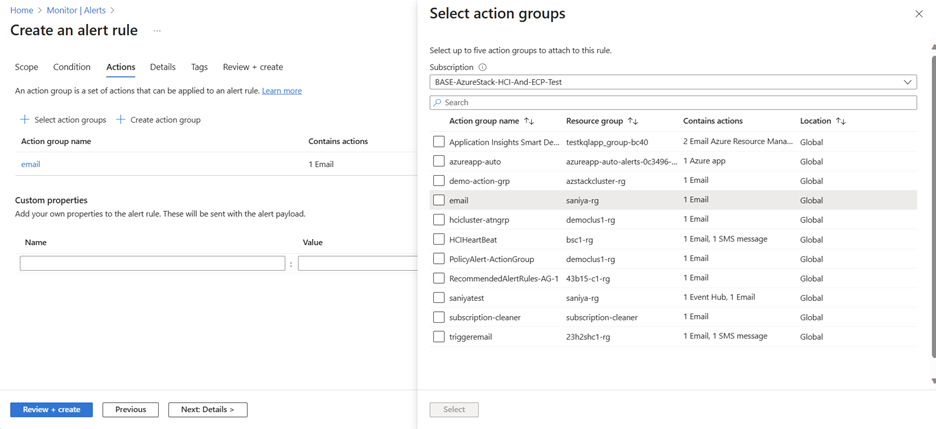
On the Actions tab of the Create and alert rule page, specify the action group to indicate your preferred method of notification, and then select Next: Details >.
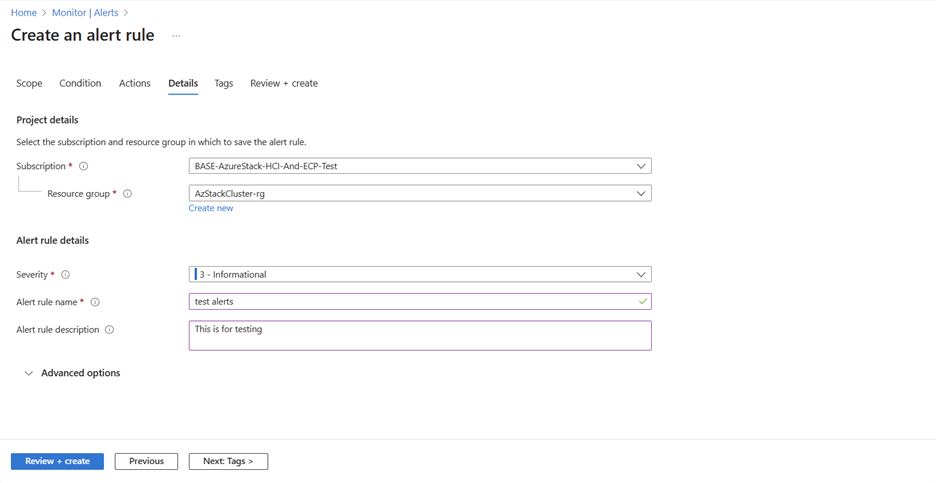
On the Details tab of the Create and alert rule page, select severity and alert rule description. Select Review+Create and then select Create.


Create metric alerts through Azure CLI
Use the az monitor metrics alert create command to create metrics alert rules through Azure CLI.
Here's an example of the command usage:
To create a metric alert rule that monitors if the average CPU usage of a VM is greater than 90, run the following command:
az monitor metrics alert create -n {nameofthealert} -g {ResourceGroup} --scopes {VirtualMachineResourceID} --condition "avg Percentage CPU > 90" --description {descriptionofthealert}
Next steps
- Learn how to Create Azure Monitor alert rules.
- Learn how to monitor Azure Stack HCI with Azure Monitor Metrics.
Feedback
Kommer snart: I hele 2024 udfaser vi GitHub-problemer som feedbackmekanisme for indhold og erstatter det med et nyt feedbacksystem. Du kan få flere oplysninger under: https://aka.ms/ContentUserFeedback.
Indsend og få vist feedback om