How to monitor the adaptive cache
This article describes how to monitor and troubleshoot slow query performance by determining whether your workload is optimally leveraging the adaptive cache for dedicated SQL pools.
The dedicated SQL pool storage architecture automatically tiers your most frequently queried columnstore segments in a cache residing on NVMe based SSDs. You will have greater performance when your queries retrieve segments that are residing in the cache.
Troubleshoot using the Azure portal
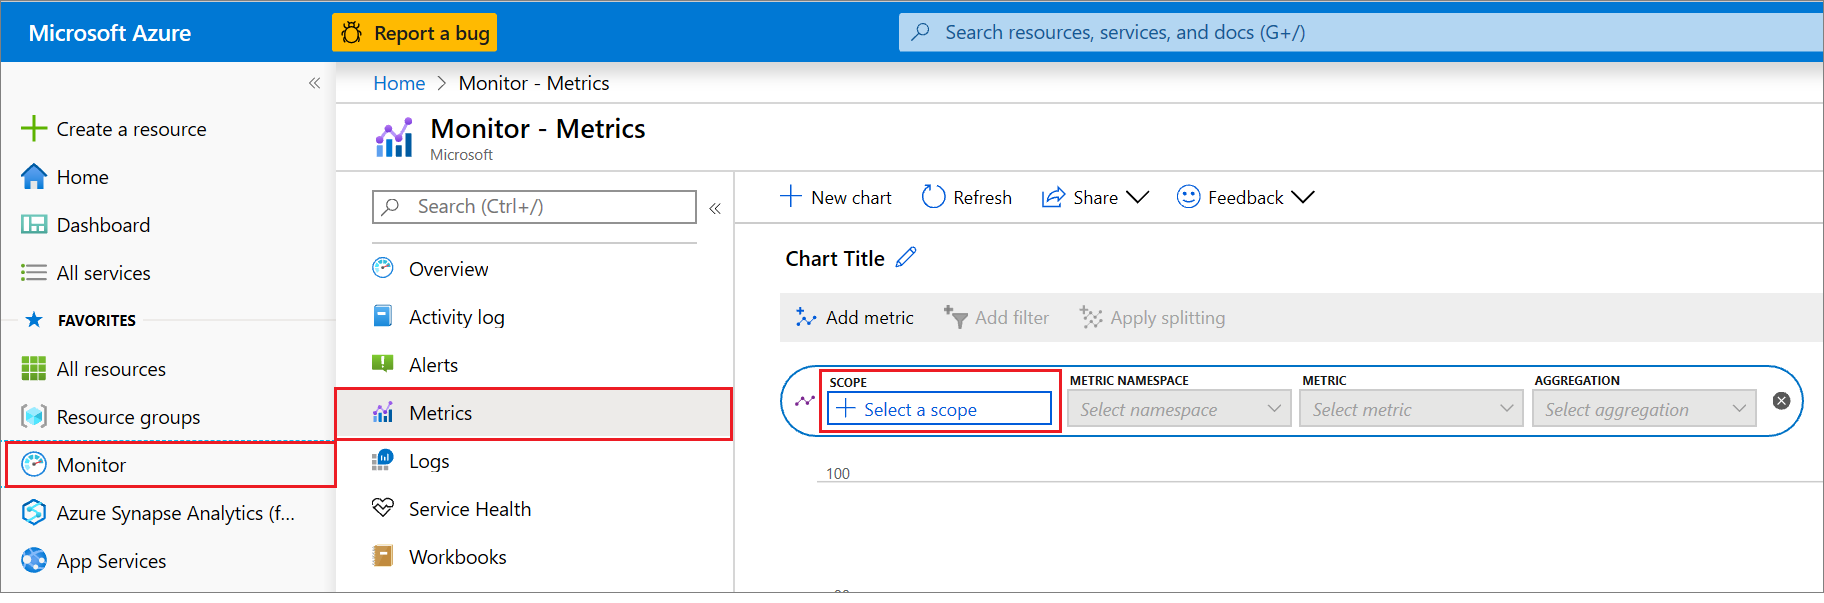
You can use Azure Monitor to view cache metrics to troubleshoot query performance. First go to the Azure portal and click on Monitor, Metrics and + Select a scope:
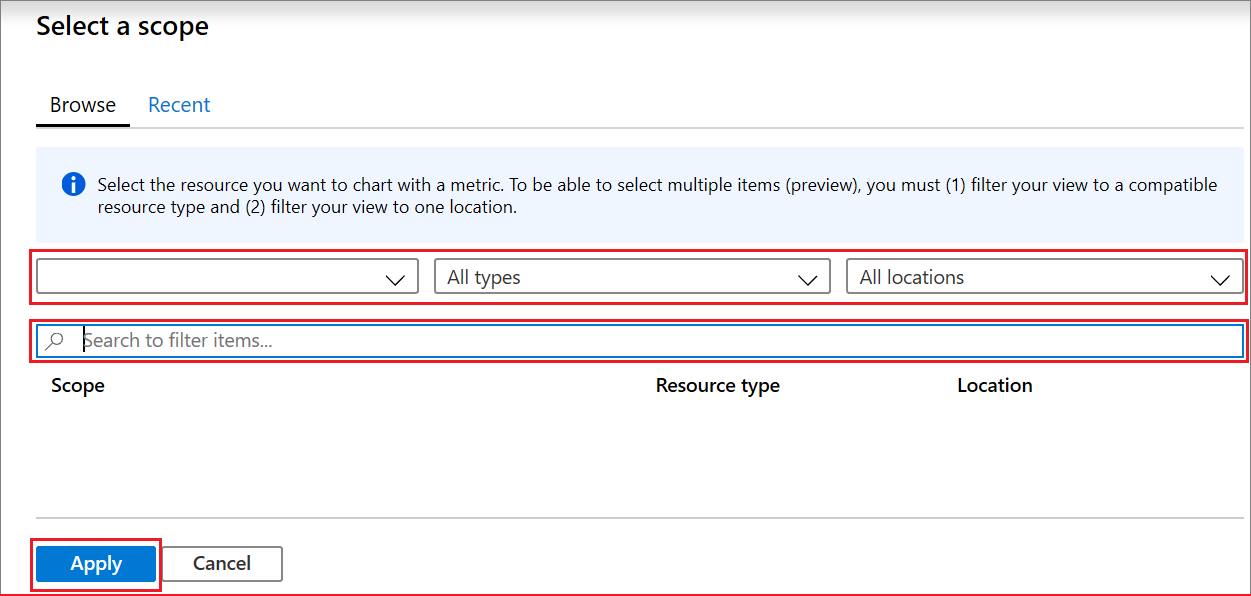
Use the search and drop down bars to locate your dedicated SQL pool. Then select apply.
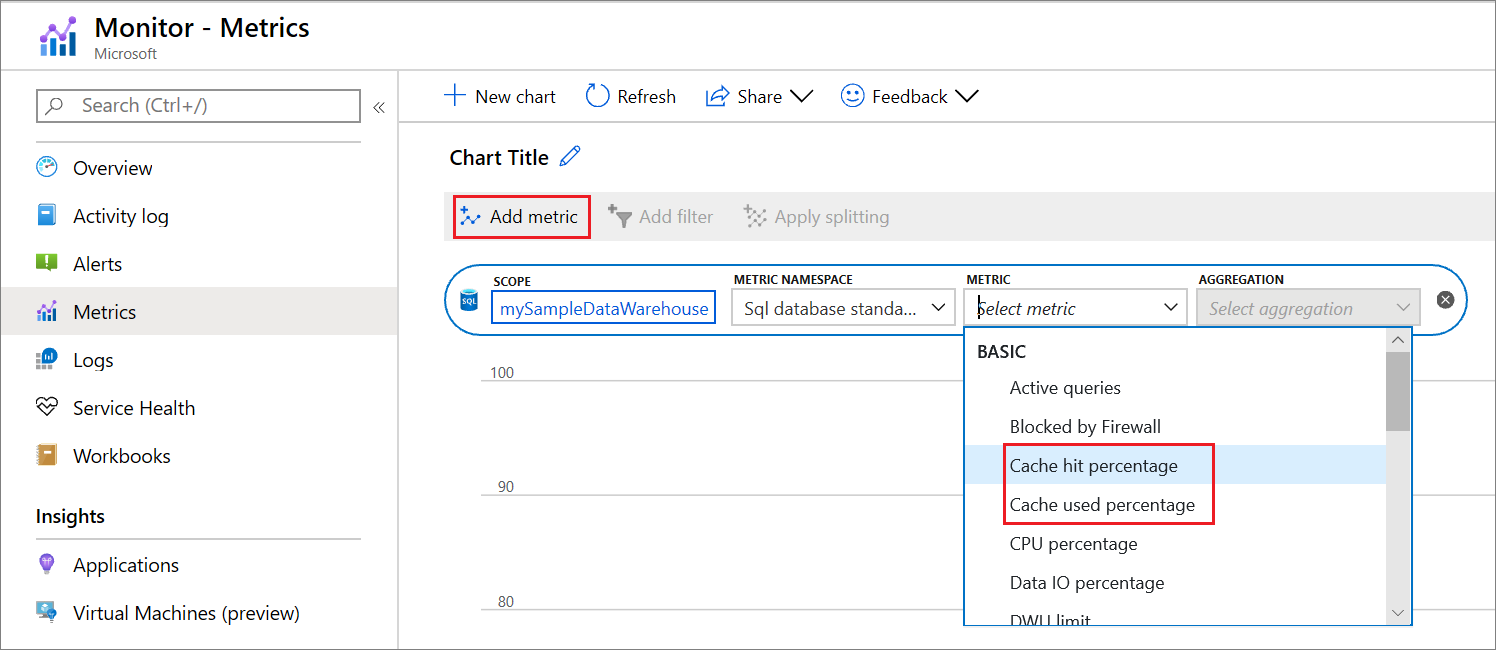
The key metrics for troubleshooting the cache are Cache hit percentage and Cache used percentage. Select Cache hit percentage then use the add metric button to add Cache used percentage.
Cache hit and used percentage
The matrix below describes scenarios based on the values of the cache metrics:
| High Cache hit percentage | Low Cache hit percentage | |
|---|---|---|
| High Cache used percentage | Scenario 1 | Scenario 2 |
| Low Cache used percentage | Scenario 3 | Scenario 4 |
Scenario 1: You are optimally using your cache. Troubleshoot other areas that may be slowing down your queries.
Scenario 2: Your current working data set cannot fit into the cache which causes a low cache hit percentage due to physical reads. Consider scaling up your performance level and rerun your workload to populate the cache.
Scenario 3: It is likely that your query is running slow due to reasons unrelated to the cache. Troubleshoot other areas that may be slowing down your queries. You can also consider scaling down your instance to reduce your cache size to save costs.
Scenario 4: You had a cold cache which could be the reason why your query was slow. Consider rerunning your query as your working dataset should now be in cached.
Important
If the cache hit percentage or cache used percentage isn't updating after rerunning your workload, your working set can already be residing in memory. Only clustered columnstore tables are cached.
Next steps
For more information on general query performance tuning, see Monitor query execution.
Feedback
Kommer snart: I hele 2024 udfaser vi GitHub-problemer som feedbackmekanisme for indhold og erstatter det med et nyt feedbacksystem. Du kan få flere oplysninger under: https://aka.ms/ContentUserFeedback.
Indsend og få vist feedback om