Map the processed code to your original source code, for debugging
To see and work with your original source code when you're debugging JavaScript in DevTools, rather than having to work with the compiled and minified version of your code that's returned by the web server, use source maps.
Source mapping keeps your client-side code readable and debuggable, even after your build process compiles and minifies your code and combines it into a single file. Source maps map your compiled, minified code to your original source code files. In DevTools, you can then read and debug your familiar, original source code, instead of the unrecognizable transformed and compiled code.
To use source maps, you must use a tool when you build your code that can produce source maps. There are many tools available, such as:
- Sass or PostCSS, which can produce source maps for CSS.
- The TypeScript compiler, which compiles TypeScript to JavaScript and can produce source maps to debug the original TypeScript code.
- The Babel transpiler which can produce both CSS and JavaScript source maps.
- Build tools like Webpack, Rollup, Vite, and Parcel, which can also produce source maps.
This article explains how to enable source maps in DevTools, and how to use them to debug your code. It doesn't explain how to produce source maps in your build process. To learn more about publishing source maps to the Azure Artifacts symbol server, see Securely debug original code by publishing source maps to the Azure Artifacts symbol server.
Source maps in DevTools
Source maps from build tools cause DevTools to load your original files in addition to your minified files, and replace the minified code with the original code. For example:
- In the Sources tool, you can see the original files and set breakpoints in them.
- In the Performance tool, you can see your original function names in the flame chart.
- In the Console tool, you can see your original file names and line numbers in stack traces.
Meanwhile, Microsoft Edge actually runs your minified code to render the webpage. Source maps are only used by DevTools, and only for displaying source code to developers.
DevTools knows how to load a source map when a //# sourceMappingURL= comment is found in a compiled file. For example, the following comment tells DevTools to load the source map from http://example.com/path/to/your/sourcemap.map:
//# sourceMappingURL=http://example.com/path/to/your/sourcemap.map
Enable source maps in DevTools
Source maps are enabled by default.
To make sure that source maps are enabled:
To open DevTools, in Microsoft Edge, right-click a webpage, and then select Inspect. Or, press Ctrl+Shift+I (Windows, Linux) or Command+Option+I (macOS).
In DevTools, click Customize and control DevTools (
 ) > Settings (
 ) > Preferences.
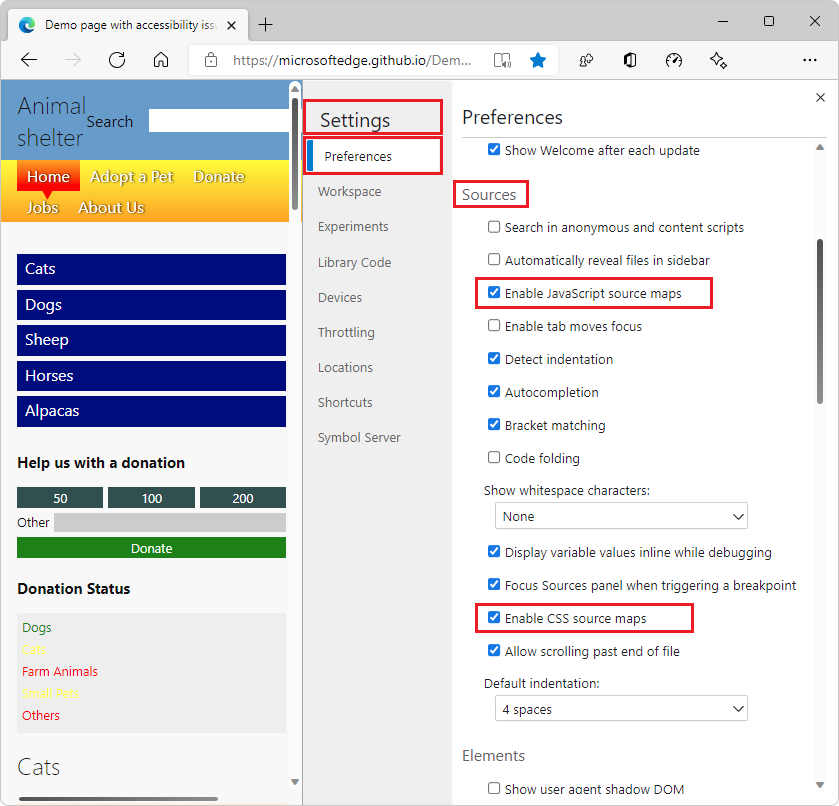
In the Preferences page, in the Sources section, make sure the Enable JavaScript source maps checkbox and the Enable CSS source maps checkbox are selected:
In the upper right of Settings, click the Close (
 ) button.
Enable loading source maps from remote file paths
By default, DevTools doesn't load source maps when the source map URL is a remote file path, such as when the source map URL starts with file:// and targets a file that's not on the current device.
To enable loading source maps from file paths:
In DevTools, click Customize and control DevTools (
) > Settings () > Preferences.In the Preferences page, in the Sources section, select the checkbox Allow DevTools to load resources, such as source maps, from remote file paths. Disabled by default for security reasons.
Debug with source maps
When debugging your code and when source maps are enabled, source maps are used in several places:
In the Console tool, links from log messages to source files go to the original files, not the compiled files.
When stepping through code in the Sources tool, the original files are displayed in the Navigator pane on the left. When you open an original file, its original code is displayed and you can set breakpoints in it. To learn more about debugging with breakpoints in the Sources tool, see Pause code with breakpoints.
In the Sources tool, the links to source files that appear in the Call Stack of the Debugger pane open the original source files.
In the Performance tool, the flame chart displays the original function names, not the compiled function names.
See also
- Securely debug original code by publishing source maps to the Azure Artifacts symbol server
- Securely debug original code by using Azure Artifacts symbol server source maps
- Source Maps Monitor tool
Note
Portions of this page are modifications based on work created and shared by Google and used according to terms described in the Creative Commons Attribution 4.0 International License. The original page is found here and is authored by Meggin Kearney (Technical Writer) and Paul Bakaus (Open Web Developer Advocate, Google: Tools, Performance, Animation, and UX).
![]() This work is licensed under a Creative Commons Attribution 4.0 International License.
This work is licensed under a Creative Commons Attribution 4.0 International License.
Feedback
Coming soon: Throughout 2024 we will be phasing out GitHub Issues as the feedback mechanism for content and replacing it with a new feedback system. For more information see: https://aka.ms/ContentUserFeedback.
Submit and view feedback for