Exercise - Track your build history
An easy way to track important events in your Microsoft Azure DevOps project is to create a dashboard. A dashboard allows team members and observers to understand and track build trends at a glance.
In this unit, you'll set up a dashboard and add widgets to track your build history.
Andy is putting together a report of the progress the team is making. He's in the middle of searching through all the build reports and pull requests to try to get the big picture when Mara walks in.
Mara: Hi Andy, I have a question on a feature I'm working on. Do you have a minute?
Andy: Sure! I could use a break. There has to be an easier way to sum up the builds and see whether there are patterns of failure.
Mara: Actually, there's an easier way. We can set up a dashboard.
Andy: So I can have a summary of the information I need in one place? I'm all ears.
What's the dashboard?
The dashboard is a customizable area in Azure DevOps where you can add widgets and extensions to help you visualize areas of your DevOps solution. For example, you can add a widget to:
- Show the history of your builds over time.
- Give you a burn down view of the work in progress.
- Show you the current pull requests.
Add a build history widget to the dashboard
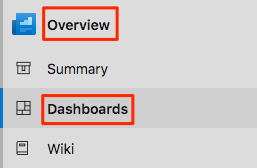
In Azure DevOps, select Overview, then select Dashboards.
Select Add a widget.
In the Add widget pane, search for Build History.
Drag the Build History tile to the canvas.
Select the Gear icon to configure the widget.
- Keep the Build History title.
- In the Pipeline drop-down list, select your pipeline.
- Keep All branches selected.
Select Save.
Select Done Editing.
The Build History widget is displayed on the dashboard.
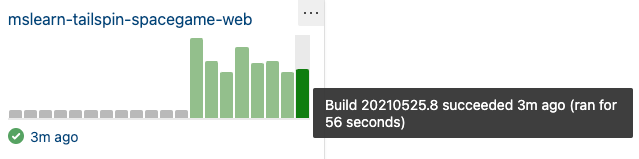
Hover over each build to view the build number, when the build was completed, and the elapsed build time.
Each build succeeded, so the bars on the widget are all green. If the build had failed, it would appear in red.
Select one of the bars to drill down into that build.
To display more widgets, select the Extension Gallery link at the bottom of the Add Widget pane.