Exercise - Create a new Power BI report in Synapse Studio
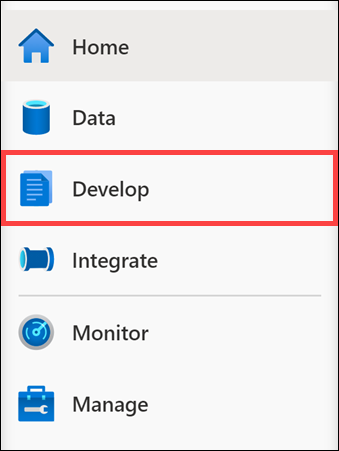
In Azure Synapse Studio, select Develop from the left menu.
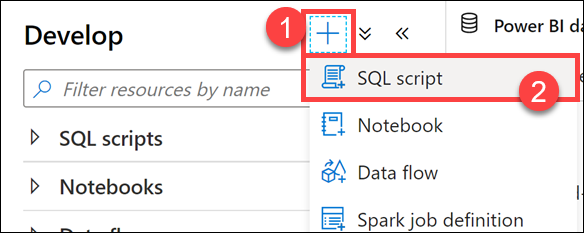
Select + (1), then SQL script (2).
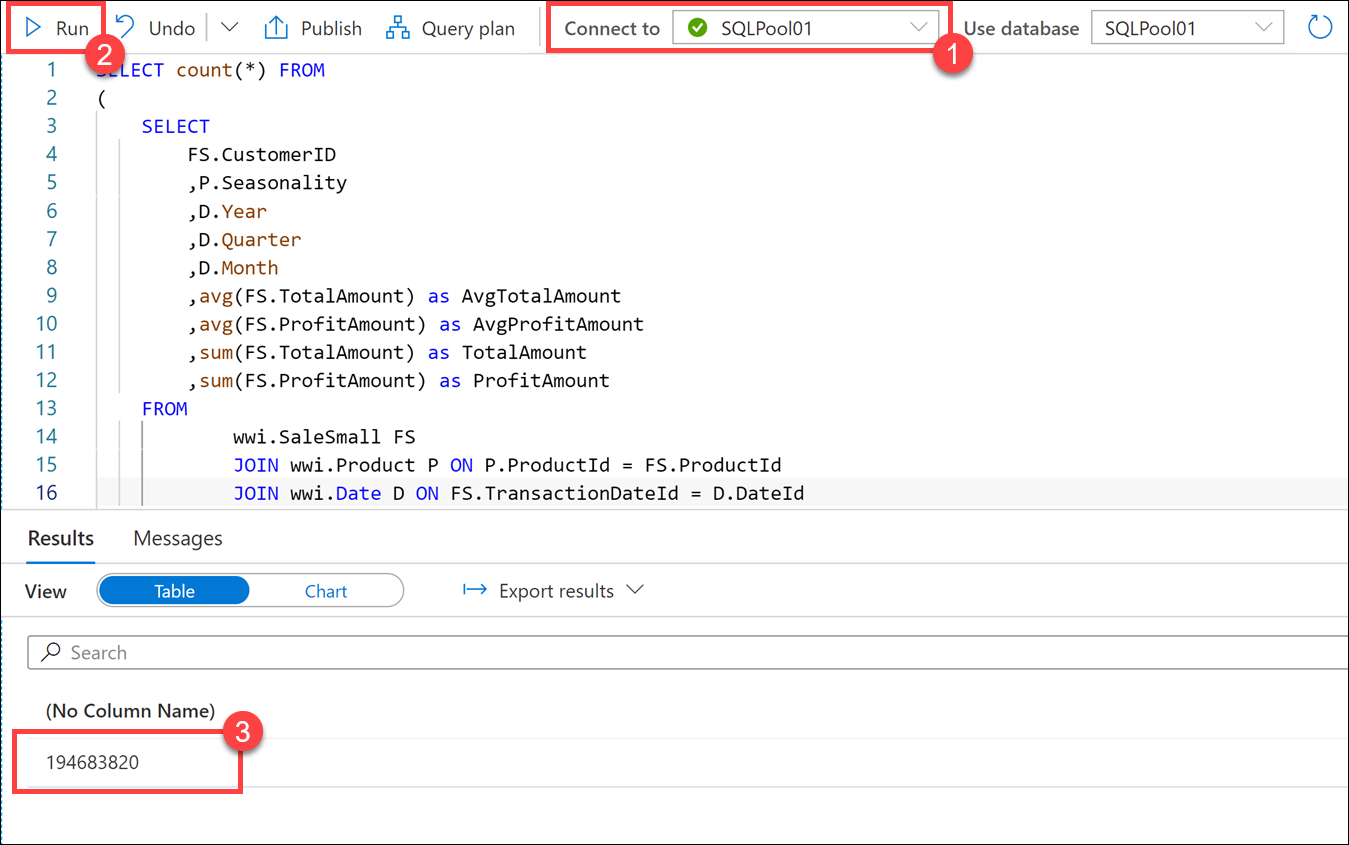
Connect to SQLPool01, then execute the following query to get an approximation of its execution time. This will be the query we'll use to bring data in the Power BI report you'll build later in this exercise.
SELECT count(*) FROM
(
    SELECT
        FS.CustomerID
        ,P.Seasonality
        ,D.Year
        ,D.Quarter
        ,D.Month
        ,avg(FS.TotalAmount) as AvgTotalAmount
        ,avg(FS.ProfitAmount) as AvgProfitAmount
        ,sum(FS.TotalAmount) as TotalAmount
        ,sum(FS.ProfitAmount) as ProfitAmount
    FROM
        wwi.SaleSmall FS
        JOIN wwi.Product P ON P.ProductId = FS.ProductId
        JOIN wwi.Date D ON FS.TransactionDateId = D.DateId
    GROUP BY
        FS.CustomerID
        ,P.Seasonality
        ,D.Year
        ,D.Quarter
        ,D.Month
) T
You should see a query result of 194683820.
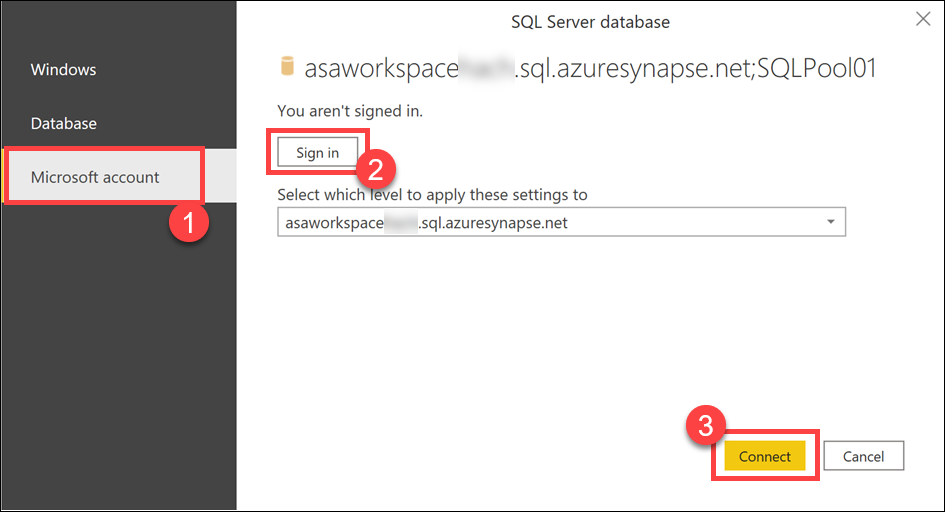
To connect to your data source, open the downloaded .pbids file in Power BI Desktop. Select the Microsoft account (1) option on the left, Sign in (2) (with the same credentials you use for connecting to the Synapse workspace) and click Connect (3).
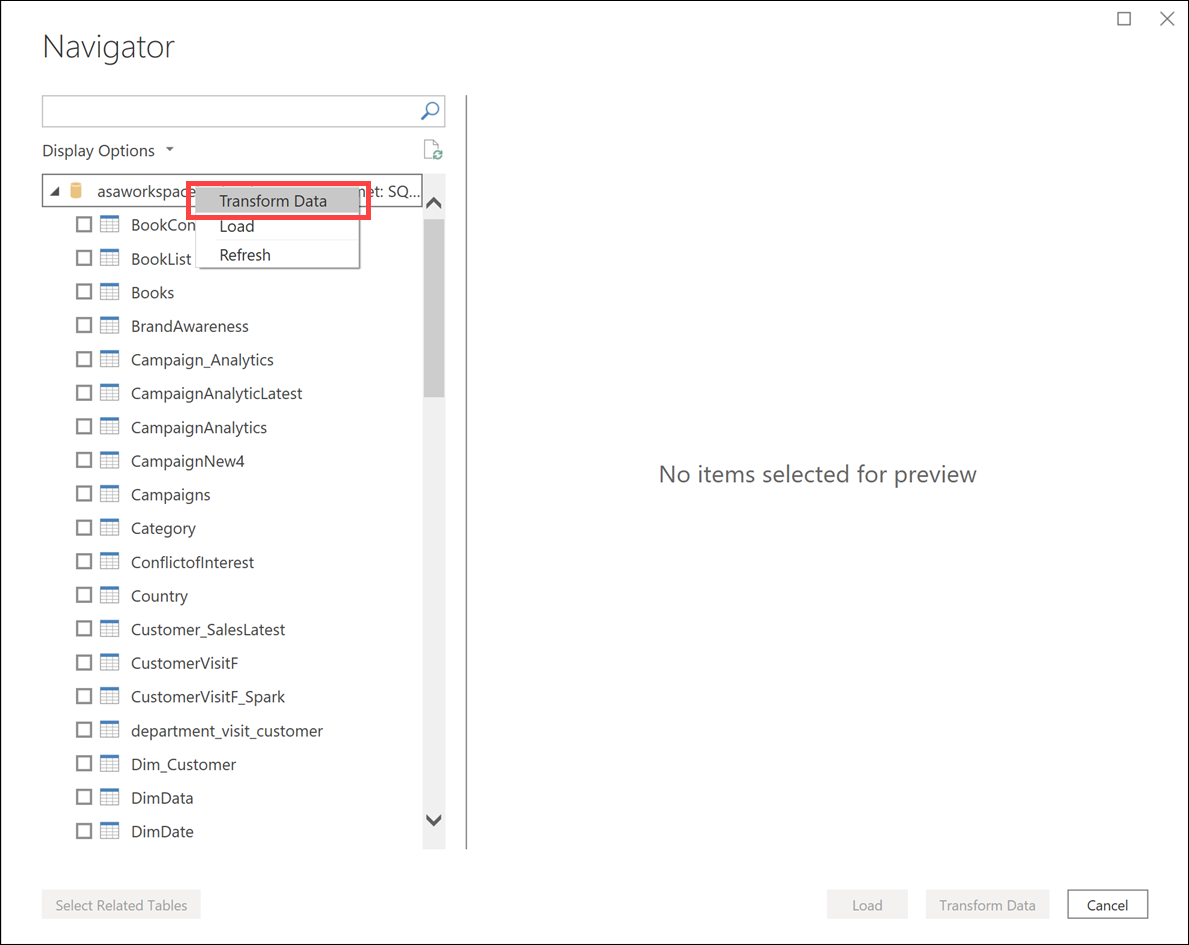
In the Navigator dialog, right-click on the root database node and select Transform data.
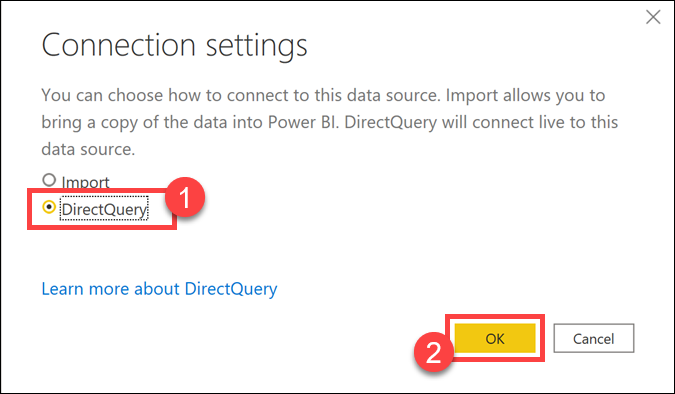
Select the DirectQuery (1) option in the connection settings dialog since our intention is not to bring a copy of the data into Power BI but to be able to query the data source while working with the report visualizations. Click OK (2) and wait a few seconds while the connection is configured.
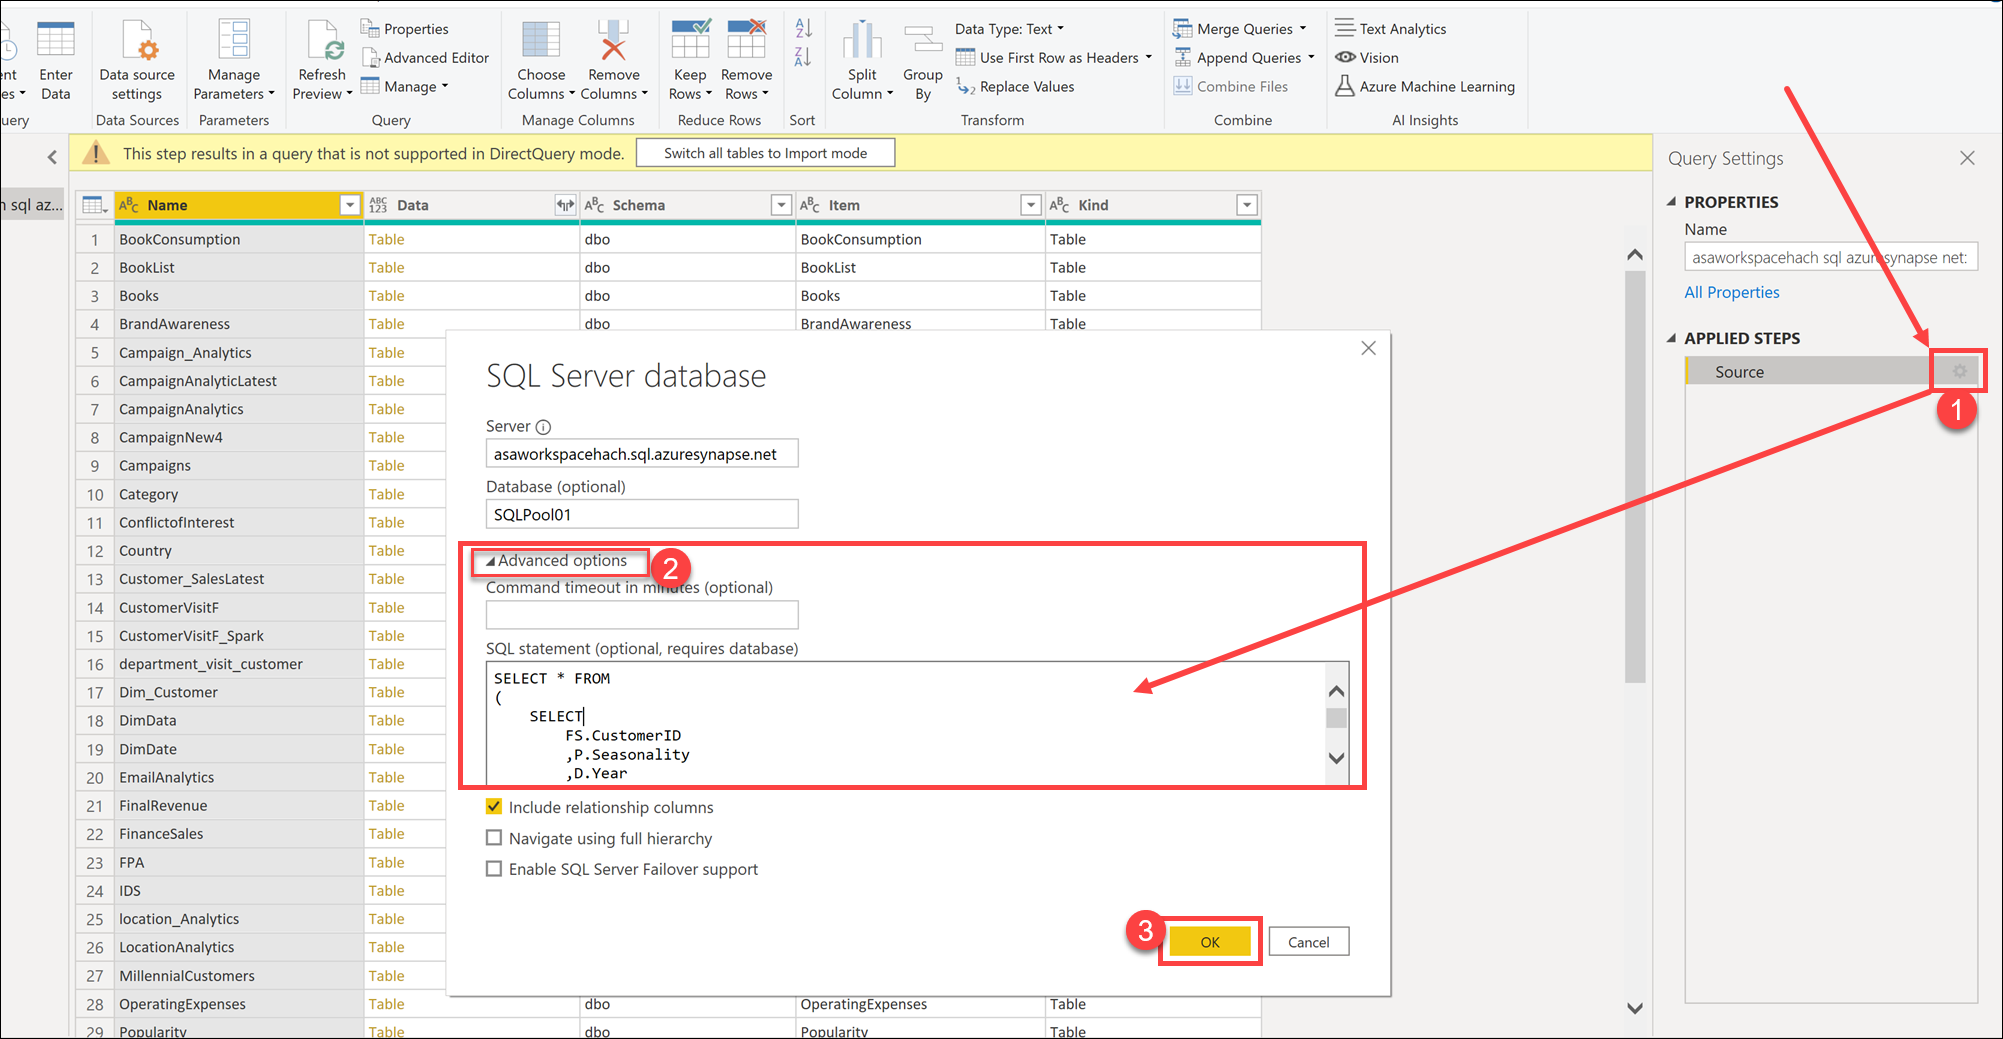
In the Power Query editor, open the settings page of the Source (1) step in the query. Expand the Advanced options (2) section, paste the following query and click OK (3).
SELECT * FROM
(
    SELECT
        FS.CustomerID
        ,P.Seasonality
        ,D.Year
        ,D.Quarter
        ,D.Month
        ,avg(FS.TotalAmount) as AvgTotalAmount
        ,avg(FS.ProfitAmount) as AvgProfitAmount
        ,sum(FS.TotalAmount) as TotalAmount
        ,sum(FS.ProfitAmount) as ProfitAmount
    FROM
        wwi.SaleSmall FS
        JOIN wwi.Product P ON P.ProductId = FS.ProductId
        JOIN wwi.Date D ON FS.TransactionDateId = D.DateId
    GROUP BY
        FS.CustomerID
        ,P.Seasonality
        ,D.Year
        ,D.Quarter
        ,D.Month
) T
Note
This step will take at least 40-60 seconds to execute since it submits the query directly on the Synapse SQL Pool connection.
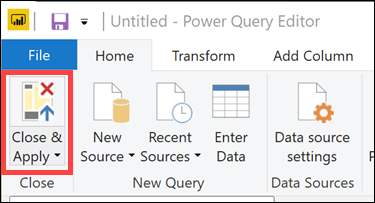
Select Close & Apply on the topmost left corner of the editor window to apply the query and fetch the initial schema in the Power BI designer window.
Back to the Power BI report editor, expand the Visualizations menu on the right, then select the Line and stacked column chart visualization.
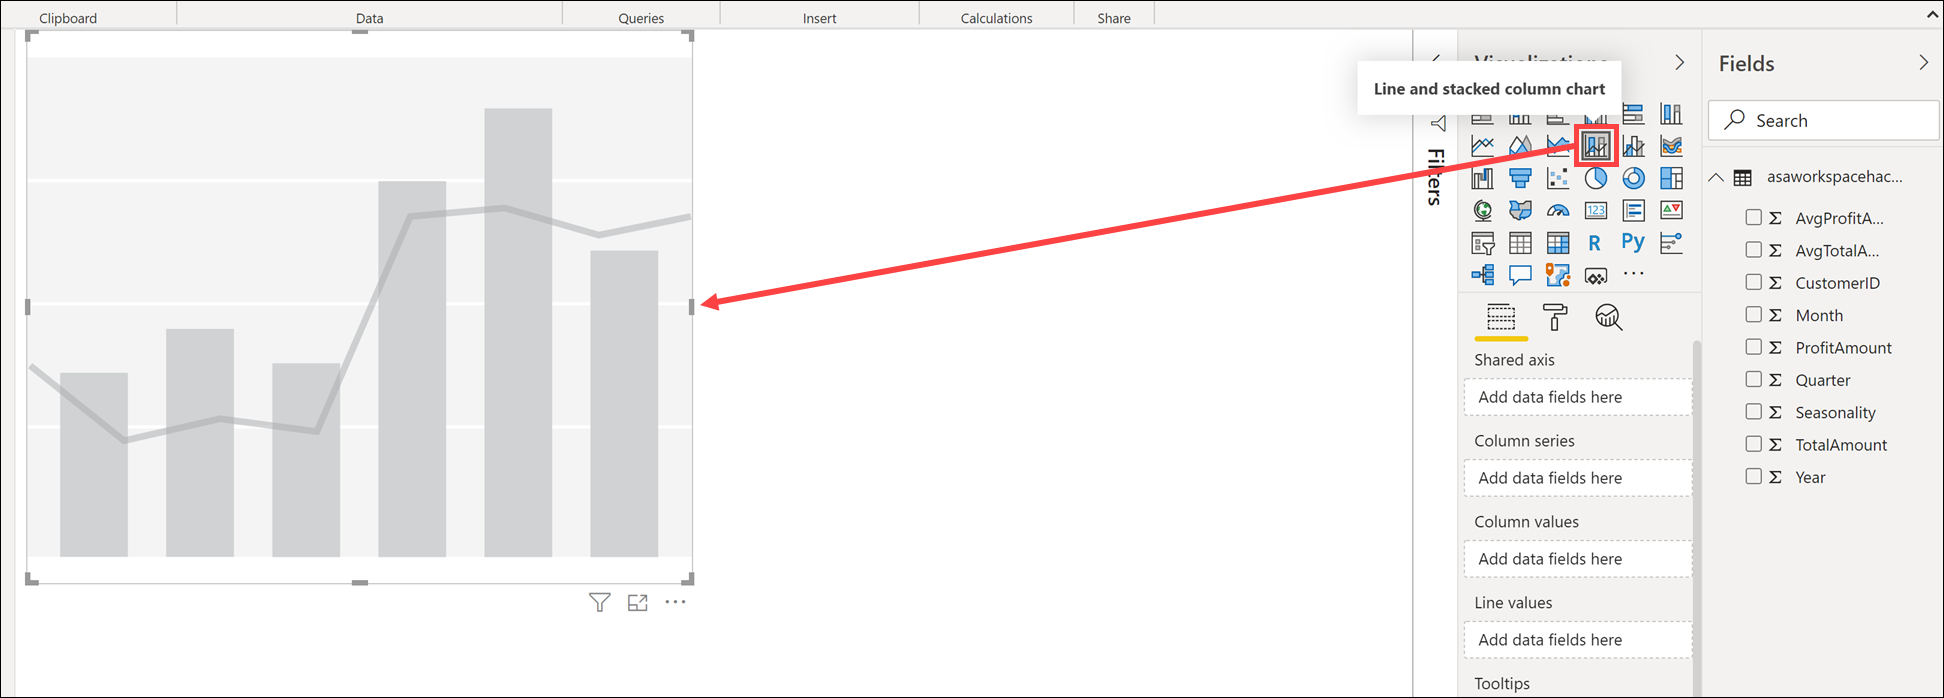
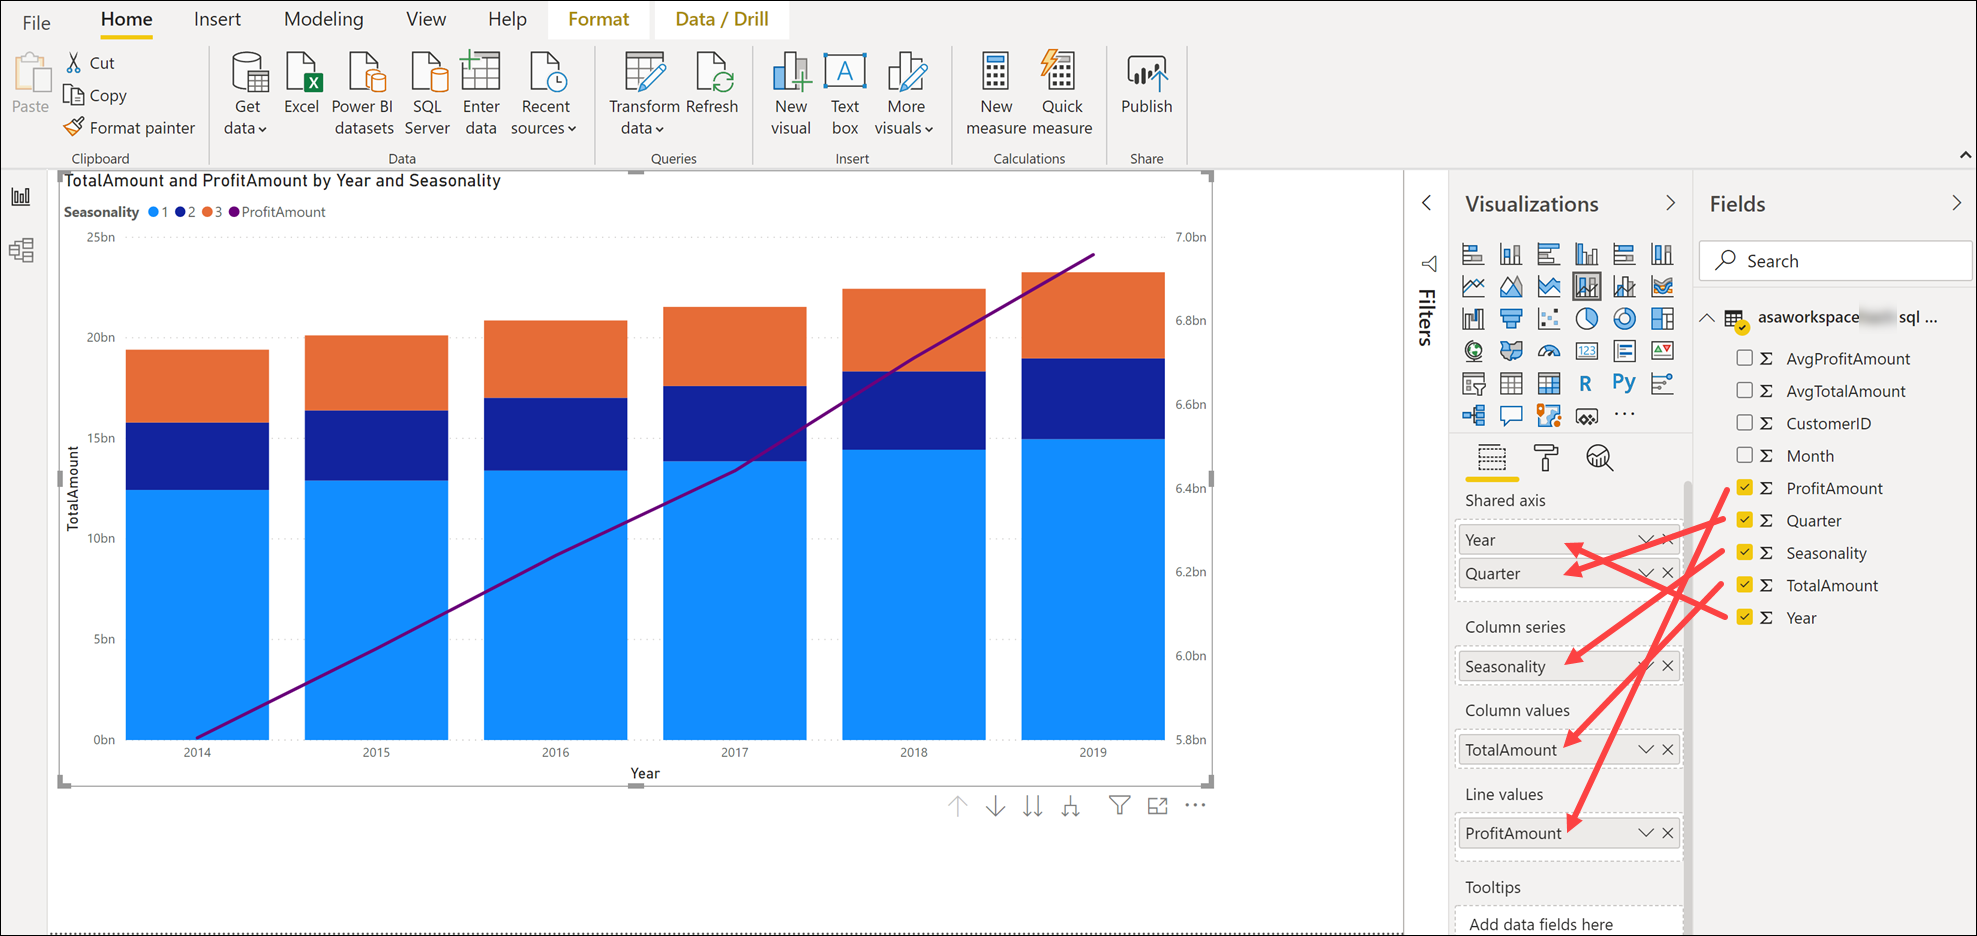
Select the newly created chart to expand its properties pane. Using the expanded Fields menu, configure the visualization as follows:
- Shared axis:
Year,Quarter - Column series:
Seasonality - Column values:
TotalAmount - Line values:
ProfitAmount
Note
It will take around 40-60 seconds for the visualization to render due to the live query execution on the Synapse dedicated SQL pool.
- Shared axis:
Switching back to Azure Synapse Studio, you can check the query executed while configuring the visualization in the Power BI Desktop application. Open the Monitor hub, and under the Activities section, open the SQL requests monitor. Make sure you select SQLPool01 in the Pool filter, as by default, SQL on-demand is selected.
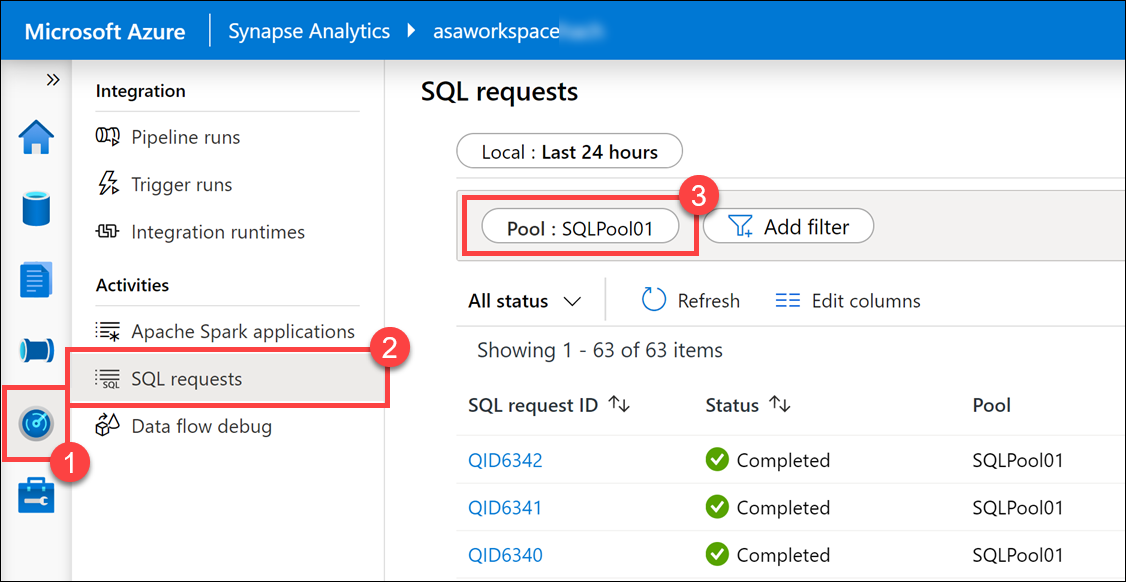
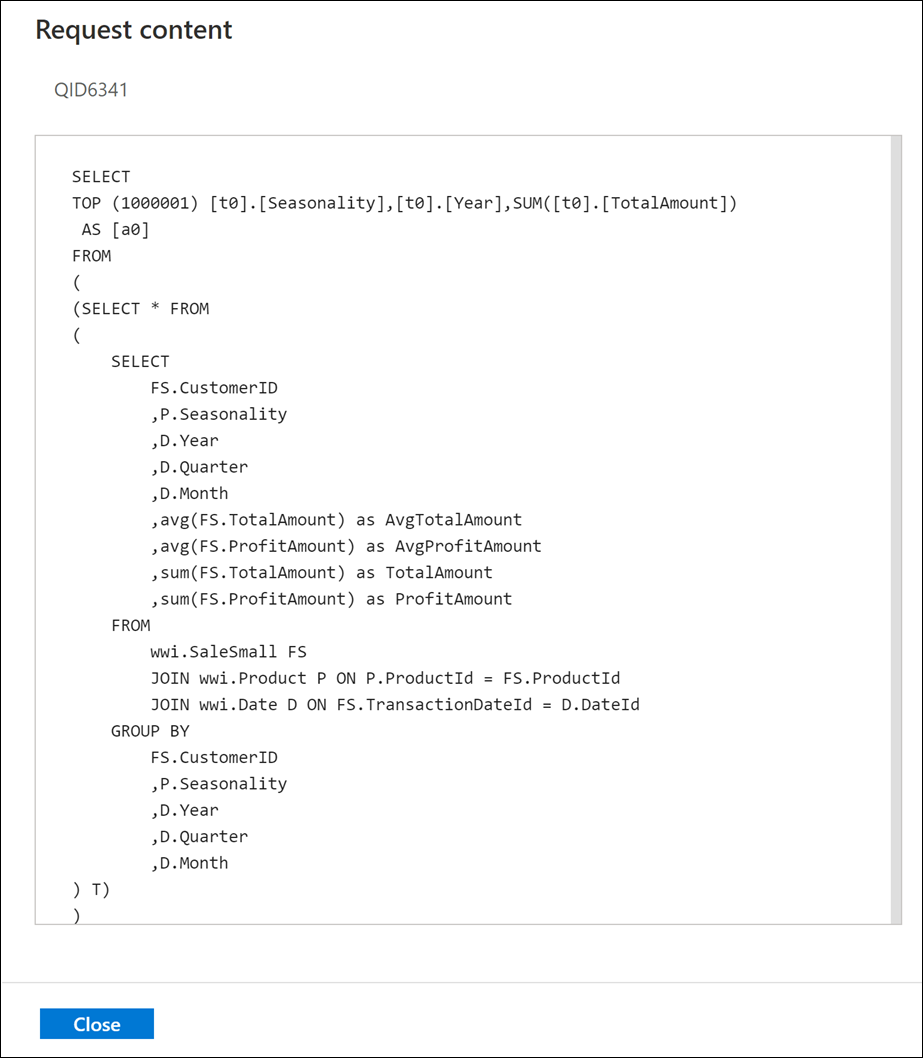
Identify the query behind your visualization in the topmost requests you see in the log and observe the duration, which is about 30 seconds (1). Use the Request content (2) option to look into the actual query submitted from Power BI Desktop.

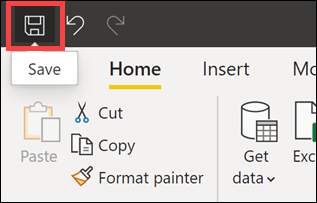
Switch back to the Power BI Desktop application, then click Save in the top-left corner.
Specify a file name, such as
synapse-lab(1), then click Save (2).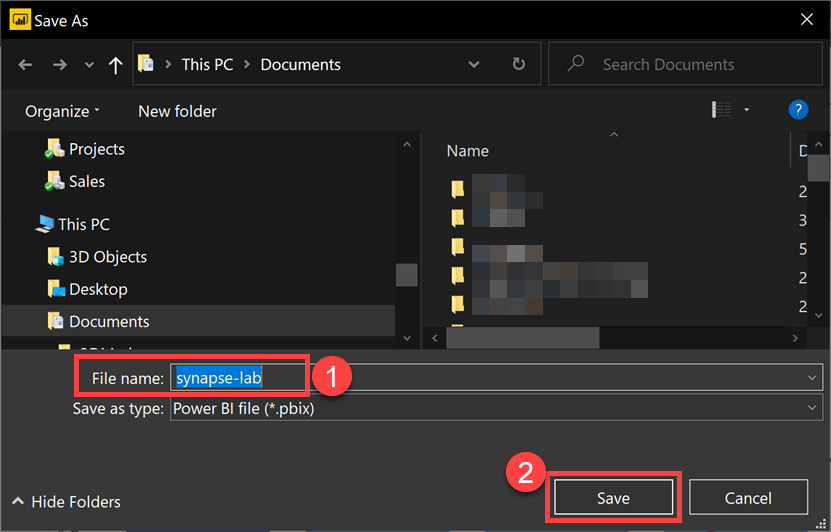
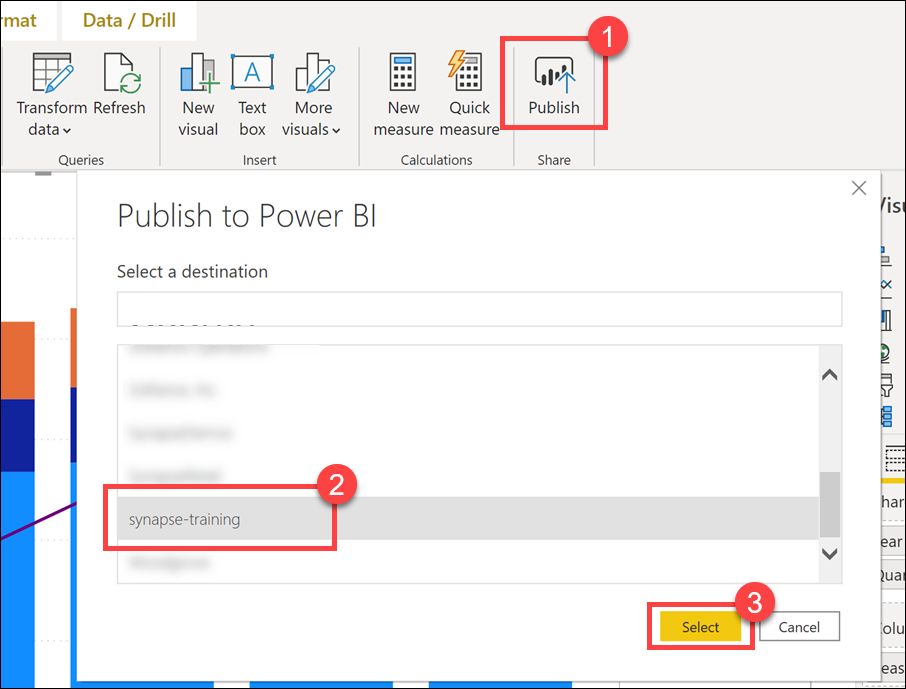
Click Publish above the saved report. Make sure that, in Power BI Desktop, you are signed in with the same account you use in the Power BI portal and in Synapse Studio. You can switch to the proper account from the topmost right corner of the window. In the Publish to Power BI dialog, select the workspace you linked to Synapse (for example, synapse-training), then click Select.
Wait until the publish operation successfully completes.
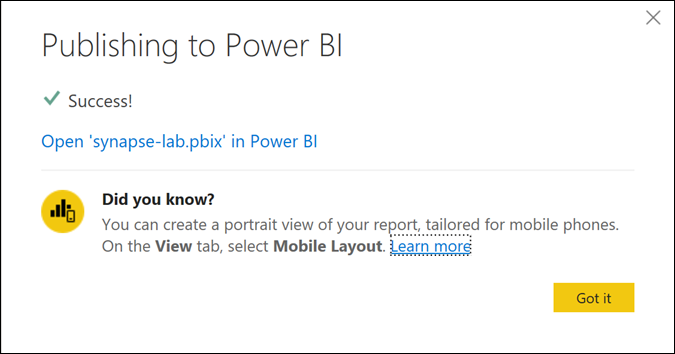
After the operation successfully completes, you should be able to see this report (2) published in the Power BI portal, as well as in Synapse Studio. To view it in Synapse Studio, navigate to the Develop hub and refresh (1) the Power BI reports node.
