Explore the different alert types that Azure Monitor supports
Azure Monitor is a powerful reporting and analytics tool. You can use it for insights into the behavior and running of your environment and applications. You can then respond proactively to faults in your system.
After the downtime that your customers faced, you set up monitoring on your key resources in Azure. With the monitoring in place, you want to make sure the right people are being alerted at the right level.
In this unit, you'll learn how Azure Monitor receives resource data, what makes up an alert, and how and when to use an alert. Finally, you'll learn how to create and manage your own alerts.
Data types in Azure Monitor
Azure Monitor receives data from target resources like applications, operating systems, Azure resources, Azure subscriptions, and Azure tenants. The nature of the resource defines which data types are available. A data type can be a metric, a log, or both a metric and a log:
- The focus for metric-based data types is the numerical time-sensitive values that represent some aspect of the target resource.
- The focus for log-based data types is the querying of content data held in structured, record-based log files that are relevant to the target resource.

You'll learn about the three signal types that you can use to monitor your environment:
- Metric alerts provide an alert trigger when a specified threshold is exceeded. For example, a metric alert can notify you when CPU usage is greater than 95 percent.
- Activity log alerts notify you when Azure resources change state. For example, an activity log alert can notify you when a resource is deleted.
- Log alerts are based on things written to log files. For example, a log alert can notify you when a web server has returned a number of 404 or 500 responses.
Composition of an alert rule
Every alert or notification available in Azure Monitor is the product of a rule. Some of these rules are built into the Azure platform. You can use alert rules to create custom alerts and notifications. No matter which target resource or data source you use, the composition of an alert rule remains the same.
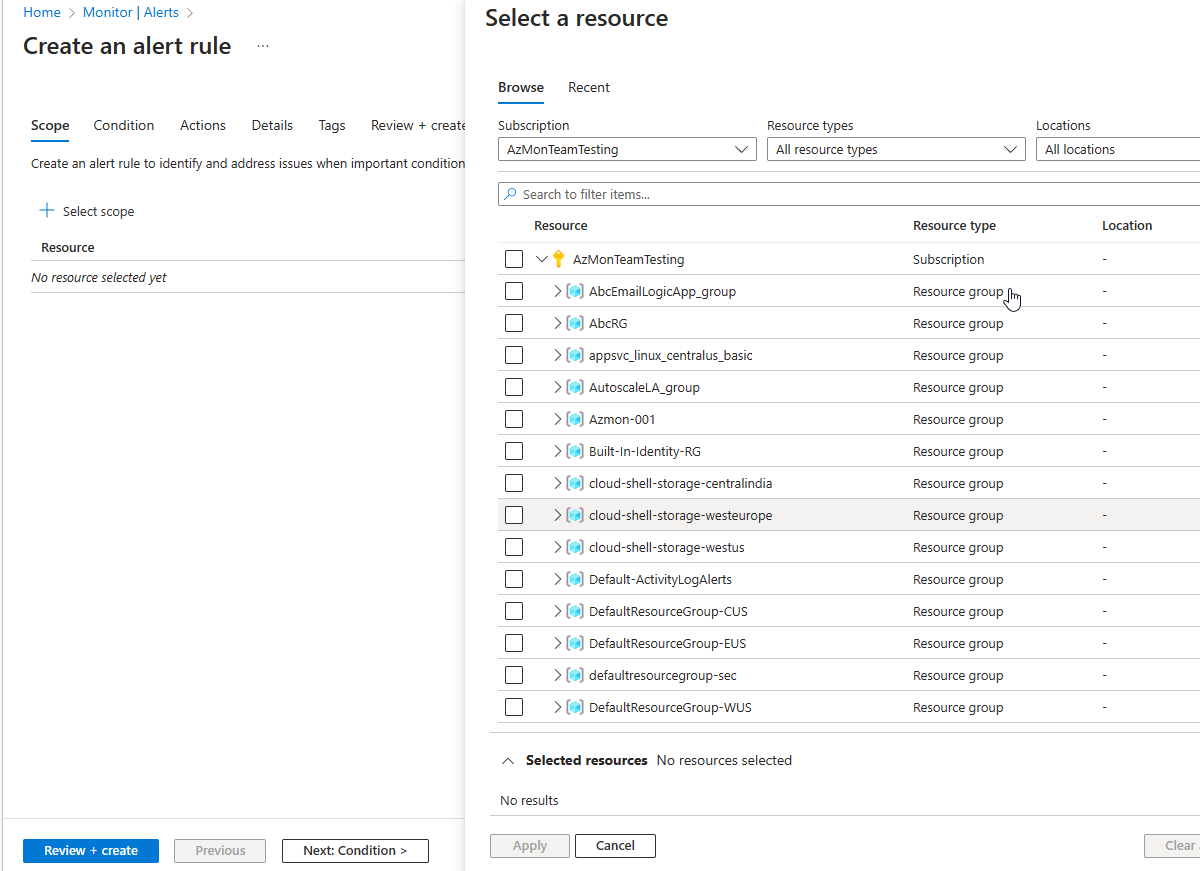
- RESOURCE
- The target resource for the alert rule. You can assign multiple target resources to a single alert rule. The type of resource defines the available signal types.
- CONDITION
- The signal type used to assess the rule. The signal type can be a metric, an activity log, or logs. There are others, but this module doesn't cover them.
- The alert logic applied to the data that's supplied via the signal type. The structure of the alert logic changes depending on the signal type.
- ACTIONS
- The action, like sending an email, sending an SMS message, or using a webhook.
- An action group, which typically contains a unique set of recipients for the action.
- ALERT DETAILS
- An alert name and an alert description that specify the alert's purpose.
- The severity of the alert if the criteria or logic test evaluates
true. The five severity levels are:- 0: Critical
- 1: Error
- 2: Warning
- 3: Informational
- 4: Verbose
Scope of alert rules
You can get monitoring data from across most of the Azure services and report on it by using the Azure Monitor pipeline. In the Azure Monitor pipeline, you can create alert rules for these items and more:
- Metric values
- Log search queries
- Activity log events
- Health of the underlying Azure platform
- Tests for website availability
Manage alert rules
Not every alert rule that you create needs to run forever. With Azure Monitor, you can specify one or more alert rules and enable or disable them, as needed.
As an Azure solution architect, you'd use Azure Monitor to enable tightly focused and specific alerts before any application change. You'd then disable the alerts after a successful deployment.
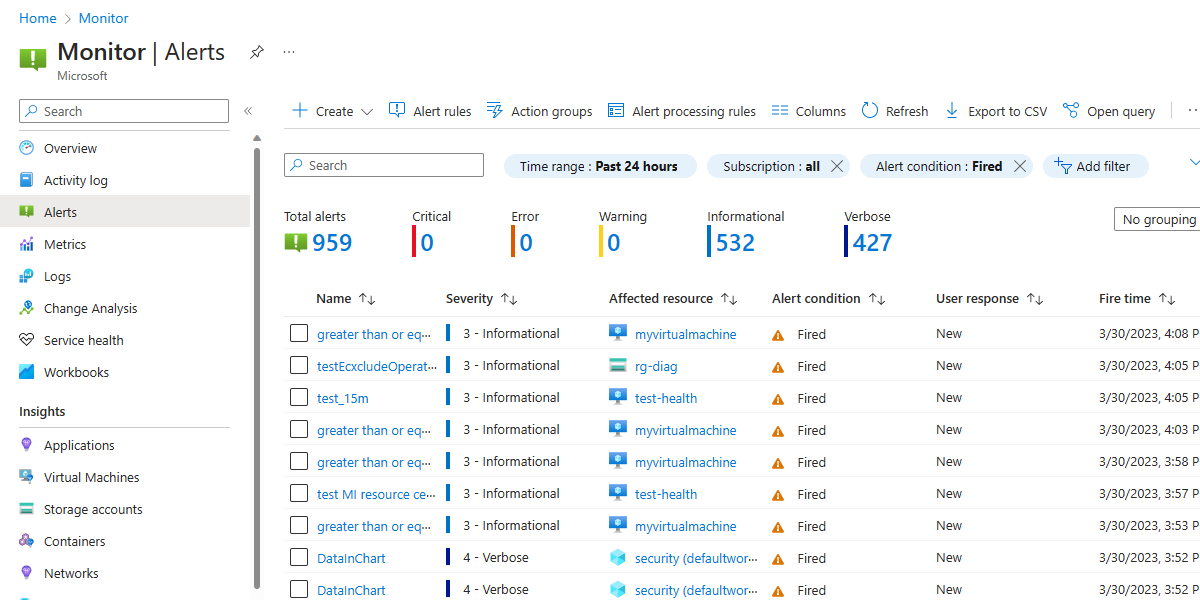
Alert summary view
The alert page shows a summary of all alerts. You can apply filters to the view by using one or more of the following categories: subscriptions, alert condition, severity, or time ranges. The view includes only alerts that match these criteria.
Alert condition
The system sets the alert condition.
- When an alert fires, the alert's monitor condition is set to Fired.
- After the underlying condition that caused the alert to fire clears, the monitor condition is set to Resolved.